Races in Ridge, New York (NY) Detailed Stats
Data:
Races - White alone (%)
Races - White alone (% change since 2000)
Races - Black alone (%)
Races - Black alone (% change since 2000)
Races - American Indian alone (%)
Races - American Indian alone (% change since 2000)
Races - Asian alone (%)
Races - Asian alone (% change since 2000)
Races - Hispanic (%)
Races - Hispanic (% change since 2000)
Races - Native Hawaiian and Other Pacific Islander alone (%)
Races - Native Hawaiian and Other Pacific Islander alone (% change since 2000)
Races - Two or more races(%)
Races - Two or more races(% change since 2000)
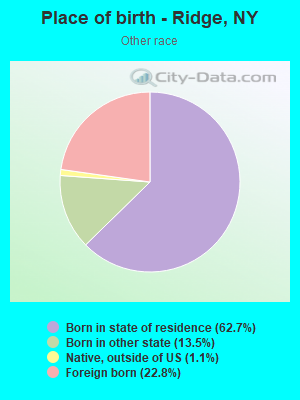
Races - Other race alone (%)
Races - Other race alone (% change since 2000)
Racial diversity
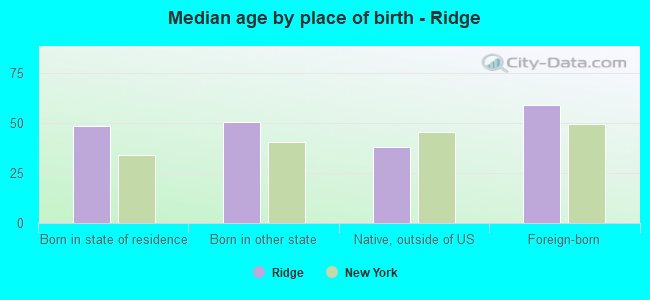
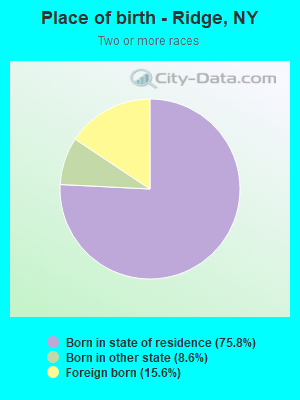
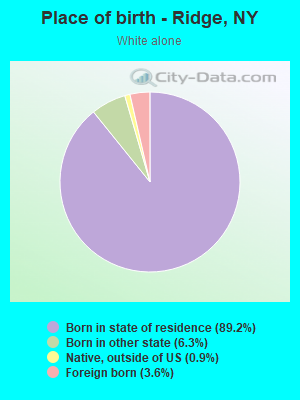
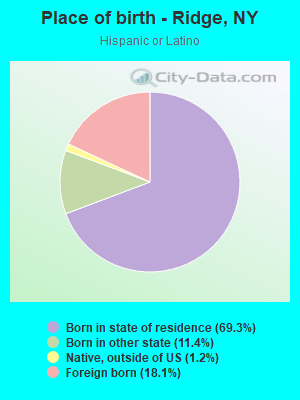
Place of birth - Born in state of residence (%)
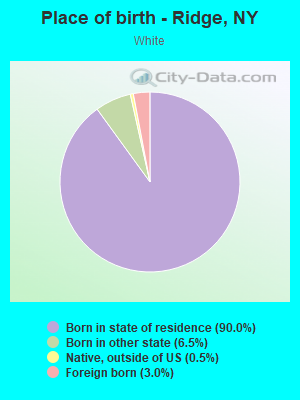
Place of birth - Born in state of residence (%) - White
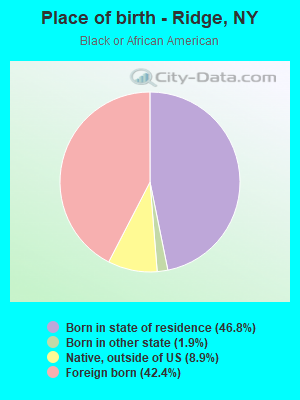
Place of birth - Born in state of residence (%) - Black or African American
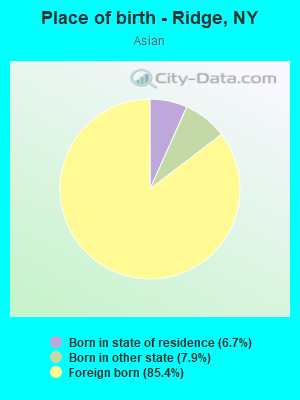
Place of birth - Born in state of residence (%) - Asian
Place of birth - Born in state of residence (%) - Hispanic or Latino
Place of birth - Born in state of residence (%) - American Indian and Alaska Native
Place of birth - Born in state of residence (%) - Multirace
Place of birth - Born in state of residence (%) - Other Race
Place of birth - Born in other state (%)
Place of birth - Born in other state (%) - White
Place of birth - Born in other state (%) - Black or African American
Place of birth - Born in other state (%) - Asian
Place of birth - Born in other state (%) - Hispanic or Latino
Place of birth - Born in other state (%) - American Indian and Alaska Native
Place of birth - Born in other state (%) - Multirace
Place of birth - Born in other state (%) - Other Race
Place of birth - Native, outside of US (%)
Place of birth - Native, outside of US (%) - White
Place of birth - Native, outside of US (%) - Black or African American
Place of birth - Native, outside of US (%) - Asian
Place of birth - Native, outside of US (%) - Hispanic or Latino
Place of birth - Native, outside of US (%) - American Indian and Alaska Native
Place of birth - Native, outside of US (%) - Multirace
Place of birth - Native, outside of US (%) - Other Race
Place of birth - Foreign born (%)
Place of birth - Foreign born (%) - White
Place of birth - Foreign born (%) - Black or African American
Place of birth - Foreign born (%) - Asian
Place of birth - Foreign born (%) - Hispanic or Latino
Place of birth - Foreign born (%) - American Indian and Alaska Native
Place of birth - Foreign born (%) - Multirace
Place of birth - Foreign born (%) - Other Race
Residents speaking English at home (%)
Residents speaking English at home - Born in the United States (%)
Residents speaking English at home - Native, born elsewhere (%)
Residents speaking English at home - Foreign born (%)
Residents speaking Spanish at home (%)
Residents speaking Spanish at home - Born in the United States (%)
Residents speaking Spanish at home - Native, born elsewhere (%)
Residents speaking Spanish at home - Foreign born (%)
Residents speaking other language at home (%)
Residents speaking other language at home - Born in the United States (%)
Residents speaking other language at home - Native, born elsewhere (%)
Residents speaking other language at home - Foreign born (%)
Marital status - Never married (%)
Marital status - Now married (%)
Marital status - Separated (%)
Marital status - Widowed (%)
Marital status - Divorced (%)
Ancestries Reported - Arab (%)
Ancestries Reported - Czech (%)
Ancestries Reported - Danish (%)
Ancestries Reported - Dutch (%)
Ancestries Reported - English (%)
Ancestries Reported - French (%)
Ancestries Reported - French Canadian (%)
Ancestries Reported - German (%)
Ancestries Reported - Greek (%)
Ancestries Reported - Hungarian (%)
Ancestries Reported - Irish (%)
Ancestries Reported - Italian (%)
Ancestries Reported - Lithuanian (%)
Ancestries Reported - Norwegian (%)
Ancestries Reported - Polish (%)
Ancestries Reported - Portuguese (%)
Ancestries Reported - Russian (%)
Ancestries Reported - Scotch-Irish (%)
Ancestries Reported - Scottish (%)
Ancestries Reported - Slovak (%)
Ancestries Reported - Subsaharan African (%)
Ancestries Reported - Swedish (%)
Ancestries Reported - Swiss (%)
Ancestries Reported - Ukrainian (%)
Ancestries Reported - United States (%)
Ancestries Reported - Welsh (%)
Ancestries Reported - West Indian (%)
Ancestries Reported - Other (%)
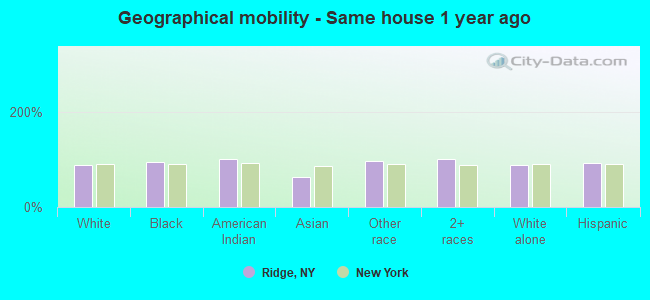
Geographical mobility - Same house 1 year ago (%)
Geographical mobility - Same house 1 year ago (%) - White
Geographical mobility - Same house 1 year ago (%) - Black or African American
Geographical mobility - Same house 1 year ago (%) - Asian
Geographical mobility - Same house 1 year ago (%) - Hispanic or Latino
Geographical mobility - Same house 1 year ago (%) - American Indian and Alaska Native
Geographical mobility - Same house 1 year ago (%) - Multirace
Geographical mobility - Same house 1 year ago (%) - Other Race
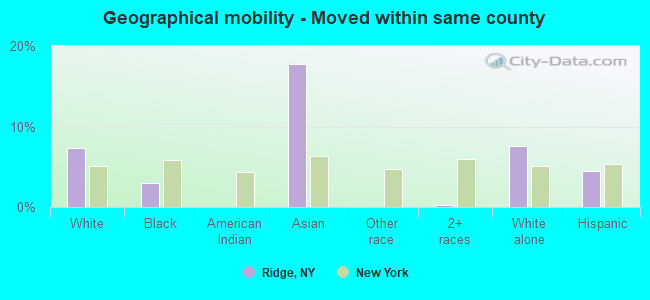
Geographical mobility - Moved within same county (%)
Geographical mobility - Moved within same county (%) - White
Geographical mobility - Moved within same county (%) - Black or African American
Geographical mobility - Moved within same county (%) - Asian
Geographical mobility - Moved within same county (%) - Hispanic or Latino
Geographical mobility - Moved within same county (%) - American Indian and Alaska Native
Geographical mobility - Moved within same county (%) - Multirace
Geographical mobility - Moved within same county (%) - Other Race
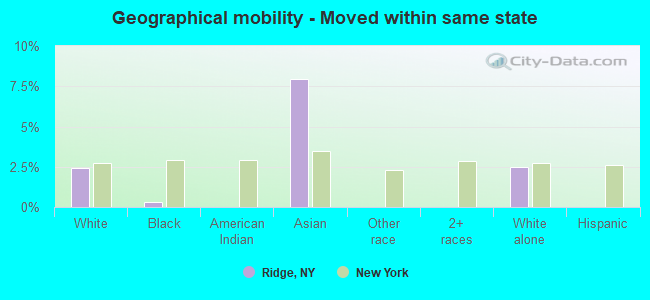
Geographical mobility - Moved from different county within same state (%)
Geographical mobility - Moved from different county within same state (%) - White
Geographical mobility - Moved from different county within same state (%) - Black or African American
Geographical mobility - Moved from different county within same state (%) - Asian
Geographical mobility - Moved from different county within same state (%) - Hispanic or Latino
Geographical mobility - Moved from different county within same state (%) - American Indian and Alaska Native
Geographical mobility - Moved from different county within same state (%) - Multirace
Geographical mobility - Moved from different county within same state (%) - Other Race
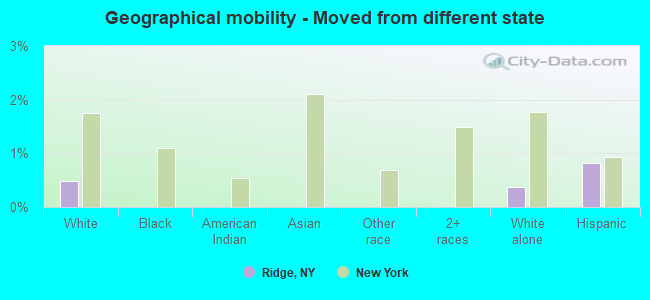
Geographical mobility - Moved from different state (%)
Geographical mobility - Moved from different state (%) - White
Geographical mobility - Moved from different state (%) - Black or African American
Geographical mobility - Moved from different state (%) - Asian
Geographical mobility - Moved from different state (%) - Hispanic or Latino
Geographical mobility - Moved from different state (%) - American Indian and Alaska Native
Geographical mobility - Moved from different state (%) - Multirace
Geographical mobility - Moved from different state (%) - Other Race
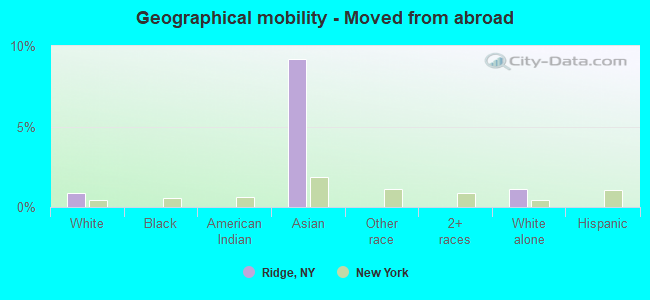
Geographical mobility - Moved from abroad (%)
Geographical mobility - Moved from abroad (%) - White
Geographical mobility - Moved from abroad (%) - Black or African American
Geographical mobility - Moved from abroad (%) - Asian
Geographical mobility - Moved from abroad (%) - Hispanic or Latino
Geographical mobility - Moved from abroad (%) - American Indian and Alaska Native
Geographical mobility - Moved from abroad (%) - Multirace
Geographical mobility - Moved from abroad (%) - Other Race
Place of birth for the foreign-born population - Ireland (%)
Place of birth for the foreign-born population - Denmark (%)
Place of birth for the foreign-born population - Norway (%)
Place of birth for the foreign-born population - Sweden (%)
Place of birth for the foreign-born population - United Kingdom (%)
Place of birth for the foreign-born population - England (%)
Place of birth for the foreign-born population - Scotland (%)
Place of birth for the foreign-born population - Other Northern Europe (%)
Place of birth for the foreign-born population - Austria (%)
Place of birth for the foreign-born population - Belgium (%)
Place of birth for the foreign-born population - France (%)
Place of birth for the foreign-born population - Germany (%)
Place of birth for the foreign-born population - Netherlands (%)
Place of birth for the foreign-born population - Switzerland (%)
Place of birth for the foreign-born population - Other Western Europe (%)
Place of birth for the foreign-born population - Greece (%)
Place of birth for the foreign-born population - Italy (%)
Place of birth for the foreign-born population - Portugal (%)
Place of birth for the foreign-born population - Spain (%)
Place of birth for the foreign-born population - Other Southern Europe (%)
Place of birth for the foreign-born population - Albania (%)
Place of birth for the foreign-born population - Belarus (%)
Place of birth for the foreign-born population - Bosnia and Herzegovina (%)
Place of birth for the foreign-born population - Bulgaria (%)
Place of birth for the foreign-born population - Croatia (%)
Place of birth for the foreign-born population - Czechoslovakia (%)
Place of birth for the foreign-born population - Hungary (%)
Place of birth for the foreign-born population - Latvia (%)
Place of birth for the foreign-born population - Lithuania (%)
Place of birth for the foreign-born population - North Macedonia (Macedonia) (%)
Place of birth for the foreign-born population - Moldova (%)
Place of birth for the foreign-born population - Poland (%)
Place of birth for the foreign-born population - Romania (%)
Place of birth for the foreign-born population - Russia (%)
Place of birth for the foreign-born population - Serbia (%)
Place of birth for the foreign-born population - Ukraine (%)
Place of birth for the foreign-born population - Other Eastern Europe (%)
Place of birth for the foreign-born population - China (%)
Place of birth for the foreign-born population - Hong Kong (%)
Place of birth for the foreign-born population - Taiwan (%)
Place of birth for the foreign-born population - Japan (%)
Place of birth for the foreign-born population - Korea (%)
Place of birth for the foreign-born population - Other Eastern Asia (%)
Place of birth for the foreign-born population - Afghanistan (%)
Place of birth for the foreign-born population - Bangladesh (%)
Place of birth for the foreign-born population - India (%)
Place of birth for the foreign-born population - Iran (%)
Place of birth for the foreign-born population - Kazakhstan (%)
Place of birth for the foreign-born population - Nepal (%)
Place of birth for the foreign-born population - Pakistan (%)
Place of birth for the foreign-born population - Sri Lanka (%)
Place of birth for the foreign-born population - Uzbekistan (%)
Place of birth for the foreign-born population - Other South Central Asia (%)
Place of birth for the foreign-born population - Burma (%)
Place of birth for the foreign-born population - Cambodia (%)
Place of birth for the foreign-born population - Indonesia (%)
Place of birth for the foreign-born population - Laos (%)
Place of birth for the foreign-born population - Malaysia (%)
Place of birth for the foreign-born population - Philippines (%)
Place of birth for the foreign-born population - Singapore (%)
Place of birth for the foreign-born population - Thailand (%)
Place of birth for the foreign-born population - Vietnam (%)
Place of birth for the foreign-born population - Other South Eastern Asia (%)
Place of birth for the foreign-born population - Armenia (%)
Place of birth for the foreign-born population - Iraq (%)
Place of birth for the foreign-born population - Israel (%)
Place of birth for the foreign-born population - Jordan (%)
Place of birth for the foreign-born population - Kuwait (%)
Place of birth for the foreign-born population - Lebanon (%)
Place of birth for the foreign-born population - Saudi Arabia (%)
Place of birth for the foreign-born population - Syria (%)
Place of birth for the foreign-born population - Turkey (%)
Place of birth for the foreign-born population - Yemen (%)
Place of birth for the foreign-born population - Other Western Asia (%)
Place of birth for the foreign-born population - Eritrea (%)
Place of birth for the foreign-born population - Ethiopia (%)
Place of birth for the foreign-born population - Kenya (%)
Place of birth for the foreign-born population - Somalia (%)
Place of birth for the foreign-born population - Uganda (%)
Place of birth for the foreign-born population - Zimbabwe (%)
Place of birth for the foreign-born population - Other Eastern Africa (%)
Place of birth for the foreign-born population - Cameroon (%)
Place of birth for the foreign-born population - Congo (%)
Place of birth for the foreign-born population - Democratic Republic of Congo (Zaire) (%)
Place of birth for the foreign-born population - Other Middle Africa (%)
Place of birth for the foreign-born population - Egypt (%)
Place of birth for the foreign-born population - Morocco (%)
Place of birth for the foreign-born population - Sudan (%)
Place of birth for the foreign-born population - Other Northern Africa (%)
Place of birth for the foreign-born population - South Africa (%)
Place of birth for the foreign-born population - Other Southern Africa (%)
Place of birth for the foreign-born population - Cabo Verde (%)
Place of birth for the foreign-born population - Ghana (%)
Place of birth for the foreign-born population - Liberia (%)
Place of birth for the foreign-born population - Nigeria (%)
Place of birth for the foreign-born population - Senegal (%)
Place of birth for the foreign-born population - Sierra Leone (%)
Place of birth for the foreign-born population - Other Western Africa (%)
Place of birth for the foreign-born population - Australia (%)
Place of birth for the foreign-born population - New Zealand (%)
Place of birth for the foreign-born population - Fiji (%)
Place of birth for the foreign-born population - Micronesia (%)
Place of birth for the foreign-born population - Bahamas (%)
Place of birth for the foreign-born population - Barbados (%)
Place of birth for the foreign-born population - Cuba (%)
Place of birth for the foreign-born population - Dominica (%)
Place of birth for the foreign-born population - Dominican Republic (%)
Place of birth for the foreign-born population - Grenada (%)
Place of birth for the foreign-born population - Haiti (%)
Place of birth for the foreign-born population - Jamaica (%)
Place of birth for the foreign-born population - St. Vincent and the Grenadines (%)
Place of birth for the foreign-born population - Trinidad and Tobago (%)
Place of birth for the foreign-born population - West Indies (%)
Place of birth for the foreign-born population - Other Caribbean (%)
Place of birth for the foreign-born population - Belize (%)
Place of birth for the foreign-born population - Costa Rica (%)
Place of birth for the foreign-born population - El Salvador (%)
Place of birth for the foreign-born population - Guatemala (%)
Place of birth for the foreign-born population - Honduras (%)
Place of birth for the foreign-born population - Mexico (%)
Place of birth for the foreign-born population - Nicaragua (%)
Place of birth for the foreign-born population - Panama (%)
Place of birth for the foreign-born population - Other Central America (%)
Place of birth for the foreign-born population - Argentina (%)
Place of birth for the foreign-born population - Bolivia (%)
Place of birth for the foreign-born population - Brazil (%)
Place of birth for the foreign-born population - Chile (%)
Place of birth for the foreign-born population - Colombia (%)
Place of birth for the foreign-born population - Ecuador (%)
Place of birth for the foreign-born population - Guyana (%)
Place of birth for the foreign-born population - Peru (%)
Place of birth for the foreign-born population - Uruguay (%)
Place of birth for the foreign-born population - Venezuela (%)
Place of birth for the foreign-born population - Other South America (%)
Place of birth for the foreign-born population - Canada (%)
Place of birth for the foreign-born population - Other Northern America (%)
Place of birth for the foreign-born population - Other (%)
Latest news about races in Ridge, NY collected exclusively by city-data.com from local newspapers, TV, and radio stations
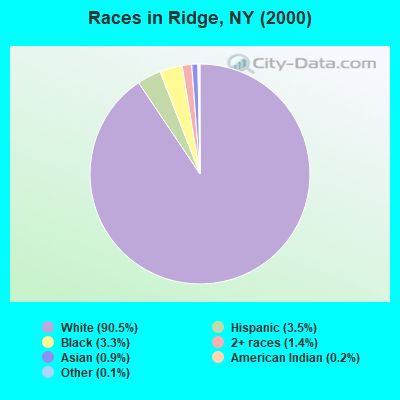
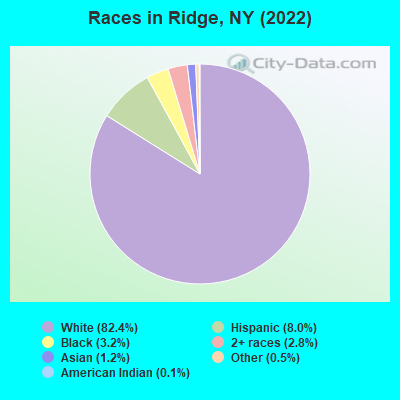
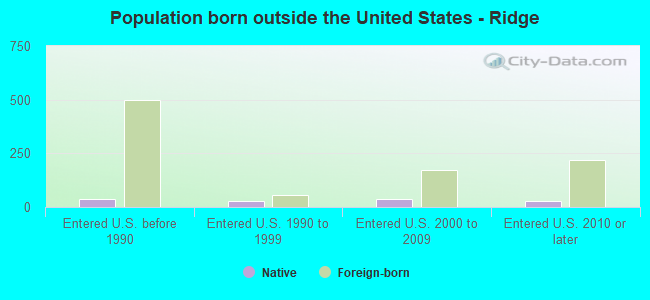
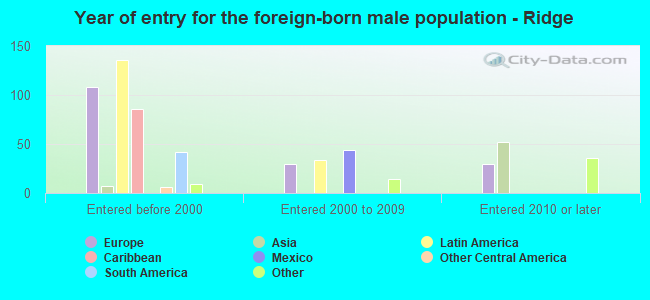
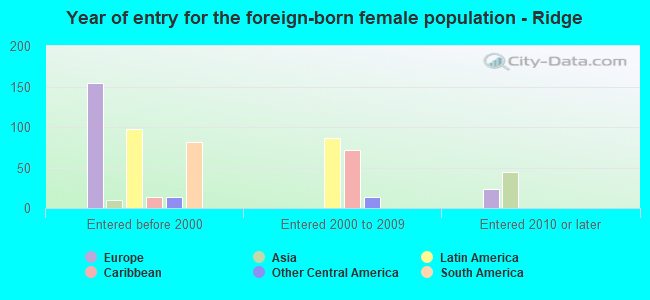
According to 2022 data, the most numerous races in Ridge, NY are White alone (10,706 residents), Hispanic (1,034 residents), and Black alone (420 residents). 88.9% of Ridge residents speak English at home. 6.8% of Ridge, NY residents are foreign-born (2.9% born in Europe, 2.7% born in Latin America, 1.0% born in Asia), which is 221.6% less than the foreign-born rate of 22.0% across the entire state of New York.
Race distribution in Ridge
2000 2022
11,760,981 62.0% White alone 2,867,583 15.1% Hispanic 2,812,623 14.8% Black alone 1,035,926 5.5% Asian alone 366,116 1.9% Two or more races 75,499 0.4% Other race alone 52,499 0.3% American Indian alone 5,230 0.03% Native Hawaiian and Other
10,408,933 52.9% White alone 3,867,299 19.7% Hispanic 2,633,840 13.4% Black alone 1,776,286 9.0% Asian alone 732,670 3.7% Two or more races 216,110 1.1% Other race alone 35,082 0.2% American Indian alone 6,931 0.04% Native Hawaiian and Other
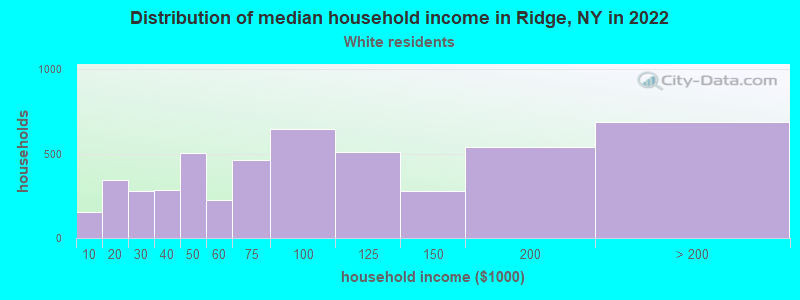
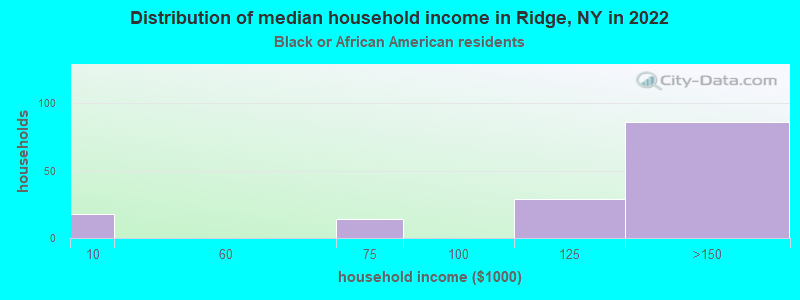
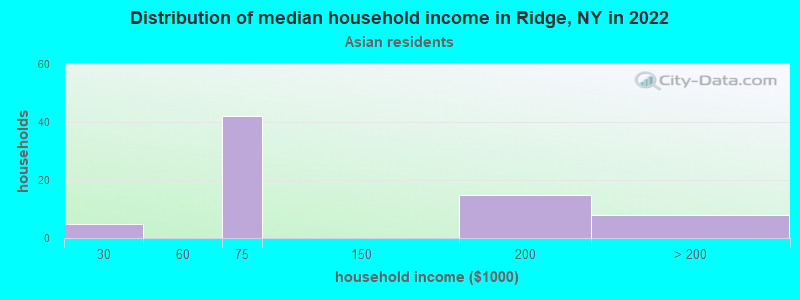
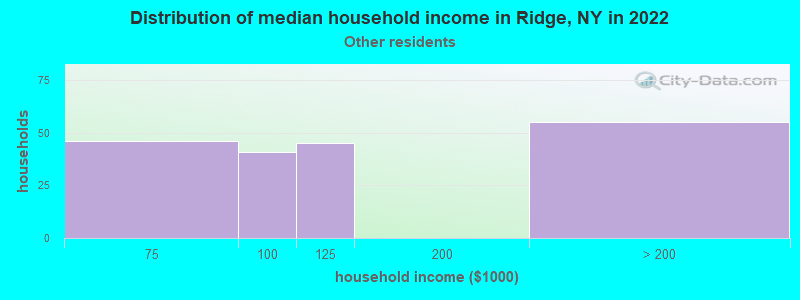
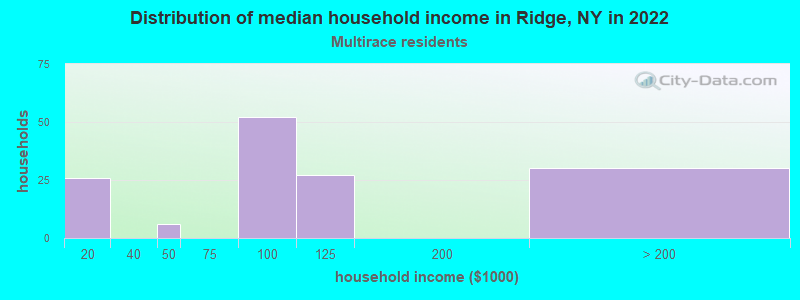
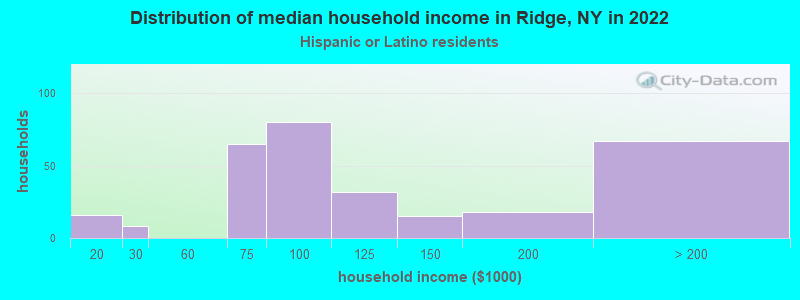
Income and house value in Ridge Median household income in 2022 $83,281 White non-Hispanic householders$150,911 Black householders$95,233 Some other race householders$93,292 Two or more races householders$90,319 Hispanic or Latino race householdersMedian 2022 house value $420,437 White Non-Hispanic householders$440,034 Black or African American householders$334,034 American Indian or Alaska Native householders $408,264 Asian householders$457,849 Some other race householders$494,964 Two or more races householders$577,211 Hispanic or Latino householders
Median age by race in Ridge
54.1 Median age for White residents49.3 59.1 42.5 Median age for Black or African American residents56.7 42.1 28.5 Median age for American Indian / Alaska Native residents-807,017,543.1 -513,692,161.9 31.8 Median age for Asian residents34.5 30.9 -742,816,091.2 Median age for Native Hawaiian / Pacific Islander residents-831,187,409.8 -771,300,447.7 38.7 Median age for Other race residents37.8 40.0 20.0 Median age for Two or more races residents23.6 19.3 54.0 Median age for White alone residents50.0 59.2 31.6 Median age for Hispanic or Latino residents30.8 34.8
Owner/renter occupied households by race in Ridge
House owners and renters - White residents 4,491 90.4% Owner occupied475 9.6% Renter occupiedHouse owners and renters - Black or African American residents 130 100.0% Owner occupiedHouse owners and renters - Asian residents 16 27.3% Owner occupied43 72.7% Renter occupiedHouse owners and renters - Other race residents 107 50.6% Owner occupied104 49.4% Renter occupiedHouse owners and renters - Two or more races residents 96 81.7% Owner occupied22 18.3% Renter occupiedHouse owners and renters - White alone residents 4,524 90.3% Owner occupied488 9.7% Renter occupiedHouse owners and renters - Hispanic or Latino residents 210 66.3% Owner occupied107 33.7% Renter occupied
Language usage in Ridge
English speakers - Total 88.9% of residents of Ridge speak English at home.
3.9% of residents speak Spanish at home 341 68.9% Speak English very well154 31.1% Speak English less than very well6.0% of residents speak other language at home 555 73.2% Speak English very well203 26.8% Speak English less than very well
English speakers - Born in the United States 98.4% of residents of Ridge speak English at home.
1.0% of residents speak Spanish at home 8 100.0% Speak English very well1.1% of residents speak other language at home 9 100.0% Speak English very well
English speakers - Native, born elsewhere 73.4% of residents of Ridge speak English at home.
2.8% of residents speak Spanish at home 3 100.0% Speak English very well18.3% of residents speak other language at home 20 100.0% Speak English less than very well
English speakers - Foreign-born 25.1% of residents of Ridge speak English at home.
17.8% of residents speak Spanish at home 45 26.2% Speak English very well127 73.8% Speak English less than very well55.2% of residents speak other language at home 367 68.9% Speak English very well166 31.1% Speak English less than very well
White (Caucasian) - Speak only English Native:
99.8% (10,067)Foreign-born:
54.2% (170)
White (Caucasian) - Speak another language Native:
1.5% (155)Foreign-born:
53.3% (167)
Black or African American - Speak only English Native:
85.4% (211)Foreign-born:
9.0% (17)
Black or African American - Speak another language Native:
15.6% (39)Foreign-born:
82.0% (156)
Asian - Speak another language Native:
100.0% (9)Foreign-born:
98.5% (122)
Other race - Speak only English Native:
53.1% (185)Foreign-born:
19.2% (23)
Other race - Speak another language Native:
48.5% (169)Foreign-born:
78.1% (94)
Two or more races - Speak only English Native:
67.8% (289)Foreign-born:
10.1% (9)
Two or more races - Speak another language Native:
32.3% (138)Foreign-born:
90.2% (82)
White alone - Speak only English Native:
98.7% (9,988)Foreign-born:
48.3% (185)
White alone - Speak another language Native:
1.1% (110)Foreign-born:
51.7% (198)
Hispanic or Latino - Speak only English Native:
62.6% (446)Foreign-born:
6.7% (12)
Hispanic or Latino - Speak another language Native:
38.3% (273)Foreign-born:
93.3% (170)
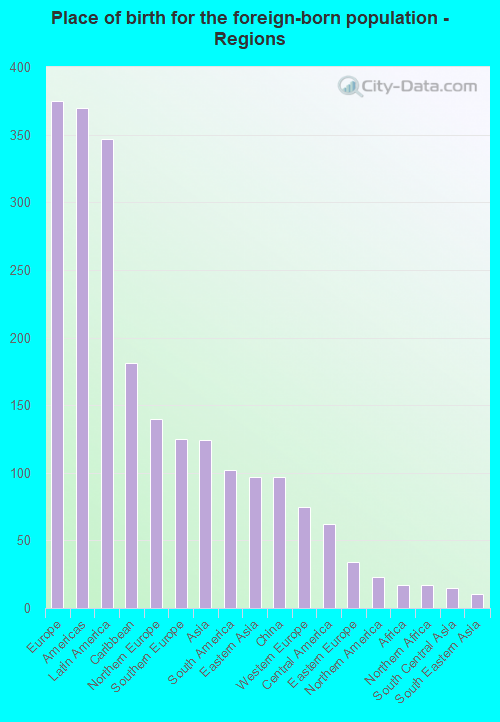
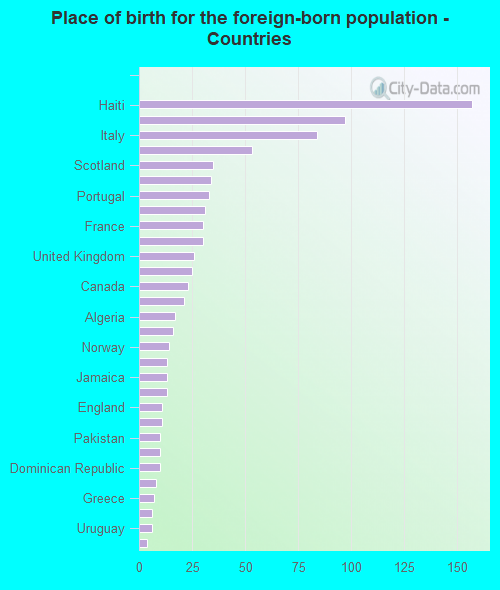
Foreign-born residents in Ridge 889 residents are foreign born (2.9% Europe , 2.7% Latin America , 1.0% Asia ).
This city:
6.8%New York:
22.6%
Marital status for residents in Ridge Marital status - White (Caucasian) population 15 years and over
Males 32.7% Never married55.9% Now married0.6% Separated4.6% Widowed6.2% DivorcedFemales 22.9% Never married46.0% Now married3.4% Separated17.7% Widowed9.9% DivorcedWomen who gave birth in the past 12 months Now married:
100.0% (19)Unmarried:
0.0% (0)
Women who did not give birth in the past 12 months Now married:
44.7% (763)Unmarried:
55.3% (942)
Marital status - Black or African American population 15 years and over
Males 8.6% Never married25.8% Now married0.0% Separated0.0% Widowed65.6% DivorcedFemales 79.3% Never married14.1% Now married0.0% Separated0.0% Widowed6.6% DivorcedWomen who did not give birth in the past 12 months Now married:
0.0% (0)Unmarried:
100.0% (153)
Marital status - American Indian / Alaska Native population 15 years and over
Males 100.0% Never married0.0% Now married0.0% Separated0.0% Widowed0.0% DivorcedFemales 100.0% Never married0.0% Now married0.0% Separated0.0% Widowed0.0% DivorcedWomen who did not give birth in the past 12 months Now married:
0.0% (0)Unmarried:
100.0% (13)
Marital status - Asian population 15 years and over
Males 41.2% Never married58.8% Now married0.0% Separated0.0% Widowed0.0% DivorcedFemales 60.6% Never married39.4% Now married0.0% Separated0.0% Widowed0.0% DivorcedWomen who did not give birth in the past 12 months Now married:
27.3% (16)Unmarried:
72.7% (42)
Marital status - Other race population 15 years and over
Males 11.6% Never married76.1% Now married0.0% Separated0.0% Widowed12.3% DivorcedFemales 11.7% Never married73.1% Now married0.0% Separated0.0% Widowed15.2% DivorcedWomen who gave birth in the past 12 months Now married:
100.0% (60)Unmarried:
0.0% (0)
Women who did not give birth in the past 12 months Now married:
71.2% (61)Unmarried:
28.8% (25)
Marital status - Two or more races population 15 years and over
Males 31.6% Never married68.4% Now married0.0% Separated0.0% Widowed0.0% DivorcedFemales 54.0% Never married41.0% Now married0.0% Separated5.0% Widowed0.0% DivorcedWomen who did not give birth in the past 12 months Now married:
25.0% (26)Unmarried:
75.0% (79)
Marital status - White alone, not Hispanic / Latino population 15 years and over
Males 31.5% Never married56.7% Now married0.6% Separated4.8% Widowed6.5% DivorcedFemales 22.1% Never married46.3% Now married3.6% Separated17.7% Widowed10.3% DivorcedWomen who gave birth in the past 12 months Now married:
100.0% (21)Unmarried:
0.0% (0)
Women who did not give birth in the past 12 months Now married:
46.6% (814)Unmarried:
53.4% (934)
Marital status - Hispanic or Latino population 15 years and over
Males 39.3% Never married55.6% Now married0.0% Separated0.0% Widowed5.1% DivorcedFemales 31.3% Never married54.9% Now married0.0% Separated9.3% Widowed4.5% DivorcedWomen who gave birth in the past 12 months Now married:
100.0% (42)Unmarried:
0.0% (0)
Women who did not give birth in the past 12 months Now married:
31.8% (57)Unmarried:
68.2% (122)
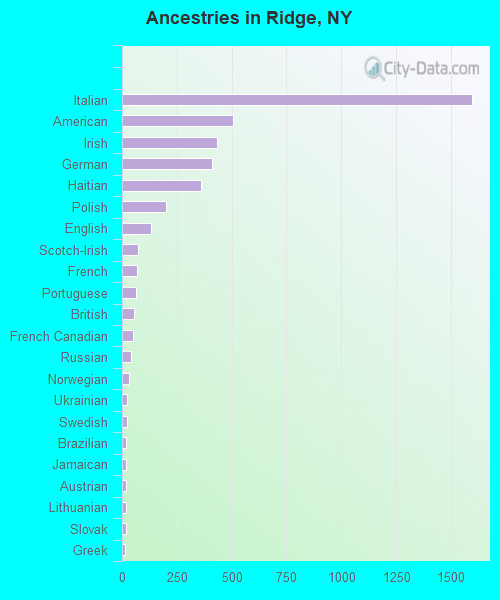
Ancestries in Ridge
1,594 31.4% Italian505 10.0% American434 8.6% Irish410 8.1% German359 7.1% Haitian200 3.9% Polish133 2.6% English71 1.4% Scotch-Irish70 1.4% French66 1.3% Portuguese56 1.1% British49 1.0% French Canadian43 0.8% Russian32 0.6% Norwegian25 0.5% Ukrainian21 0.4% Swedish19 0.4% Brazilian19 0.4% Jamaican18 0.4% Austrian18 0.4% Lithuanian18 0.4% Slovak15 0.3% Greek13 0.3% Scandinavian9 0.2% Danish5 0.10% Scottish5 0.10% Welsh4 0.08% Eastern European
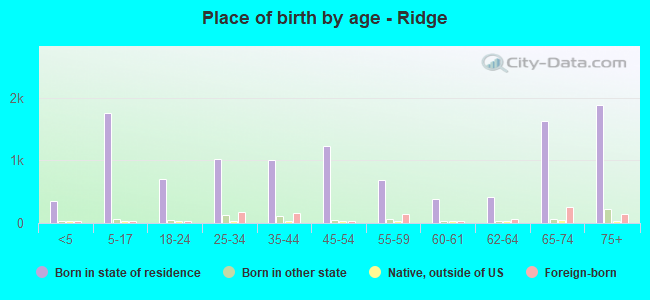
Children Nativity (place of birth) in Ridge
Children under 6 years - Living with two parents Both parents native 316 100.0% NativeBoth parents foreign-born 35 100.0% NativeOne native, one foreign-born parent 12 100.0% NativeChildren under 6 years - Living with one parent Native parent 36 100.0% NativeForeign-born parent 23 100.0% NativeChildren 6 to 17 years - Living with two parents Both parents native 1,237 100.0% NativeBoth parents foreign-born 17 100.0% NativeOne native, one foreign-born parent 22 100.0% NativeChildren 6 to 17 years - Living with one parent Native parent 184 100.0% NativeForeign-born parent 197 51.5% Native186 48.5% Foreign-born
Grandparents responsible for own grandchildren in Ridge
Grandparents (30 to 59 years) White / Caucasian 15 33.6% Responsible for grandchildren29 66.4% Not responsible for grandchildrenWhite alone, not Hispanic / Latino 14 36.0% Responsible for grandchildren25 64.0% Not responsible for grandchildrenHispanic or Latino 9 100.0% Not responsible for grandchildren
Grandparents (60 years and over) White / Caucasian 80 100.0% Not responsible for grandchildrenWhite alone, not Hispanic / Latino 87 100.0% Not responsible for grandchildren