Races in Ridgefield, Washington (WA) Detailed Stats
Ancestries, Foreign-born residents, place of birth
Settings
X


Recent posts about races in Ridgefield, Washington on our local forum with over 2,400,000 registered users:
 | Retiring and buying $450k house possible? (37 replies) |
| Salmon Creek vs. Fishers Landing (222 replies) |
| Ridgefield fastest-growing city again. Any end in sight? (7 replies) |
| Ballpark costs for add-on garage are insane! (33 replies) |
| What's the Vibe in Ridgefield, WA vs. Camas, WA (20 replies) |
| The Waterfront, Downtown, Midtown, Uptown thread (40 replies) |
Latest news about races in Ridgefield, WA collected exclusively by city-data.com from local newspapers, TV, and radio stations
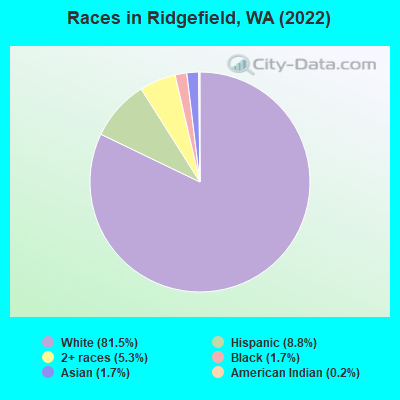
According to 2022 data, the most numerous races in Ridgefield, WA are White alone (9,601 residents), Hispanic (1,033 residents), and Asian alone (202 residents). 93.2% of Ridgefield residents speak English at home. 5.7% of Ridgefield, WA residents are foreign-born (1.5% born in Asia, 1.4% born in Europe, 1.2% born in Latin America, 1.2% born in Oceania), which is 161.3% less than the foreign-born rate of 15.0% across the entire state of Washington.
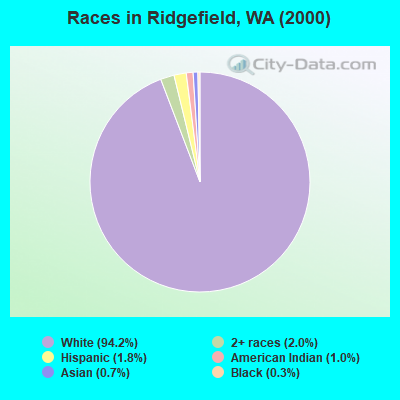
Race distribution in Ridgefield
2000
2022

- 2,02294.2%White alone
- 442.0%Two or more races
- 381.8%Hispanic
- 211.0%American Indian alone
- 140.7%Asian alone
- 60.3%Black alone
- 10.05%Native Hawaiian and Other
Pacific Islander alone - 10.05%Other race alone
-
- 9,60181.5%White alone
- 1,0338.8%Hispanic
- 6225.3%Two or more races
- 2021.7%Asian alone
- 2021.7%Black alone
- 230.2%American Indian alone
- 30.03%Native Hawaiian and Other
Pacific Islander alone
2000
2022
-
- 4,652,49078.9%White alone
- 441,5097.5%Hispanic
- 319,4015.4%Asian alone
- 184,6313.1%Black alone
- 175,9263.0%Two or more races
- 85,3961.4%American Indian alone
- 22,7790.4%Native Hawaiian and Other
Pacific Islander alone - 11,9890.2%Other race alone

-
- 4,941,45663.5%White alone
- 1,093,31314.0%Hispanic
- 755,8329.7%Asian alone
- 523,4486.7%Two or more races
- 299,5373.8%Black alone
- 69,0240.9%American Indian alone
- 52,2310.7%Native Hawaiian and Other
Pacific Islander alone - 50,9450.7%Other race alone

Income and house value in Ridgefield
- Median household income in 2022
- $103,562White non-Hispanic householders
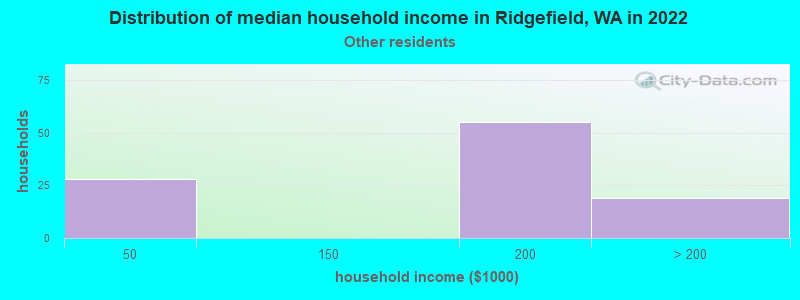
- over $200,000Some other race householders
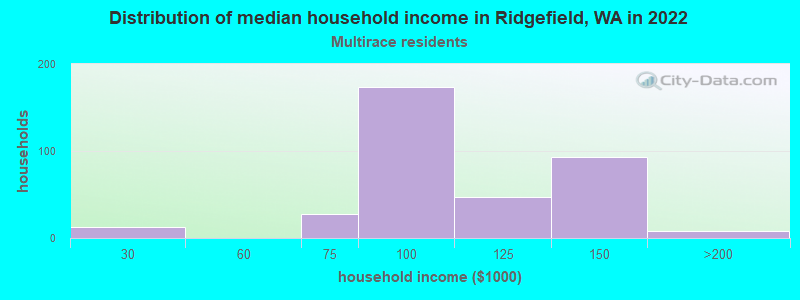
- $90,659Two or more races householders
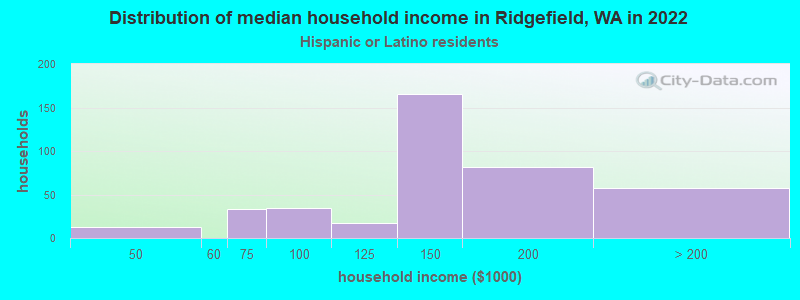
- $145,957Hispanic or Latino race householders
- Median 2022 house value
- $652,763White Non-Hispanic householders
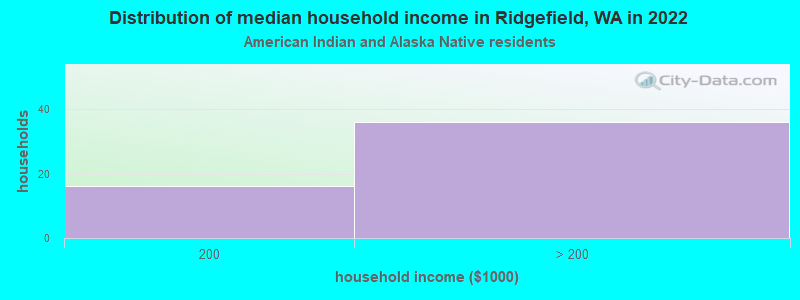
- $564,496American Indian or Alaska Native householders
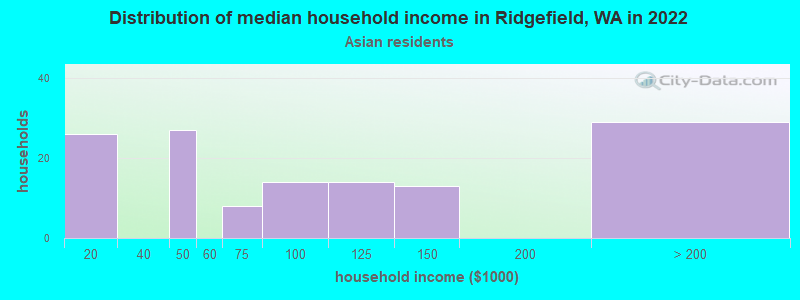
- $307,907Asian householders
- $390,015Native Hawaiian and other Pacific Islander householders
- $701,207Two or more races householders
- over $1,000,000Hispanic or Latino householders
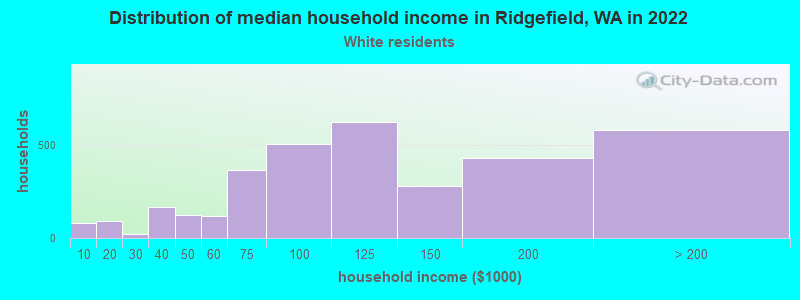
Household income for White non-Hispanic householders
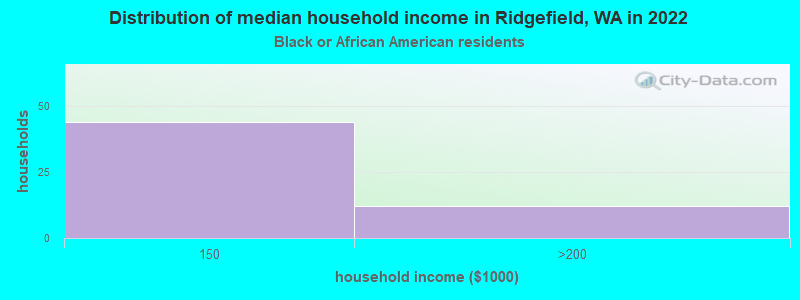
Household income for Black householders
Household income for American Indian and Alaska Native householders
Household income for Asian householders
Household income for Some other race householders
Household income for Two or more races householders
Household income for Hispanic or Latino race householders
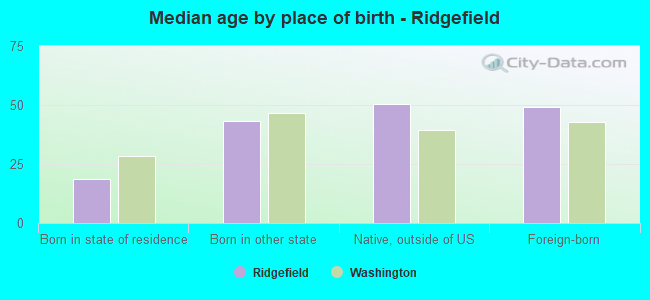
Median age by race in Ridgefield
- 35.3Median age for White residents
- 35.1Males
- 36.4Females
- 34.6Median age for Black or African American residents
- 15.1Males
- 37.2Females
- 12.1Median age for American Indian / Alaska Native residents
- 47.6Males
- 10.8Females
- 58.3Median age for Asian residents
- 59.7Males
- 62.2Females
- -779,279,278.5Median age for Native Hawaiian / Pacific Islander residents
- -779,310,344.0Males
- -928,017,717.8Females
- 25.8Median age for Other race residents
- 25.6Males
- -733,556,298.0Females
- 33.0Median age for Two or more races residents
- 39.2Males
- 17.2Females
- 35.4Median age for White alone residents
- 35.1Males
- 35.8Females
- 24.8Median age for Hispanic or Latino residents
- 32.5Males
- 22.0Females
Owner/renter occupied households by race in Ridgefield
- House owners and renters - White residents
- 2,84083.9%Owner occupied
- 54516.1%Renter occupied
- House owners and renters - Black or African American residents
- 31100.0%Owner occupied
- House owners and renters - American Indian / Alaska Native residents
- 42100.0%Owner occupied
- House owners and renters - Asian residents
- 7954.3%Owner occupied
- 6745.7%Renter occupied
- House owners and renters - Other race residents
- 5565.6%Owner occupied
- 2934.4%Renter occupied
- House owners and renters - Two or more races residents
- 35385.5%Owner occupied
- 6014.5%Renter occupied
- House owners and renters - White alone residents
- 2,72884.2%Owner occupied
- 51315.8%Renter occupied
- House owners and renters - Hispanic or Latino residents
- 27968.2%Owner occupied
- 13031.8%Renter occupied
Language usage in Ridgefield
- English speakers - Total
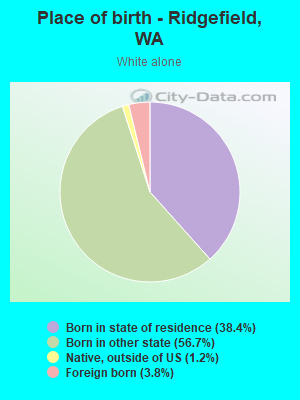
- 93.2% of residents of Ridgefield speak English at home.
- 4.7% of residents speak Spanish at home
- 42484.0%Speak English very well
- 8116.0%Speak English less than very well
- 2.5% of residents speak other language at home
- 14051.5%Speak English very well
- 13248.5%Speak English less than very well
- English speakers - Born in the United States
- 96.3% of residents of Ridgefield speak English at home.
- 1.7% of residents speak Spanish at home
- 107100.0%Speak English very well
- 0.6% of residents speak other language at home
- 40100.0%Speak English very well
All residents speak only English at home
- English speakers - Foreign-born
- 54.6% of residents of Ridgefield speak English at home.
- 16.7% of residents speak Spanish at home
- 6461.0%Speak English very well
- 4139.0%Speak English less than very well
- 32.0% of residents speak other language at home
- 10049.8%Speak English very well
- 10150.2%Speak English less than very well
White (Caucasian) - Speak only English
| Native: | 98.7% (8,545) |
| Foreign-born: | 99.5% (325) |
White (Caucasian) - Speak another language
| Native: | 1.5% (132) |
| Foreign-born: | 19.0% (62) |
Black or African American - Speak only English
| Native: | 100.0% (121) |
| Foreign-born: | 100.0% (15) |
Two or more races - Speak another language
| Native: | 40.0% (317) |
| Foreign-born: | 100.0% (203) |
White alone - Speak only English
| Native: | 99.1% (8,436) |
| Foreign-born: | 94.0% (342) |
White alone - Speak another language
| Native: | 0.4% (32) |
| Foreign-born: | 15.5% (56) |
Hispanic or Latino - Speak another language
| Native: | 37.2% (329) |
| Foreign-born: | 100.0% (96) |
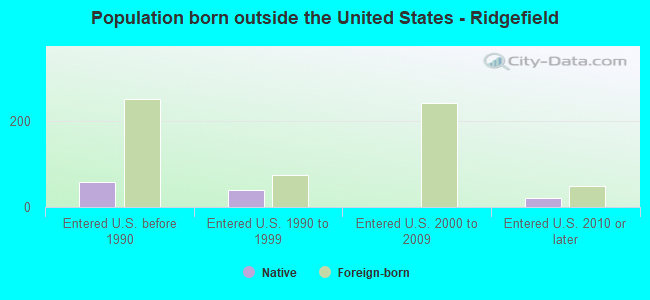
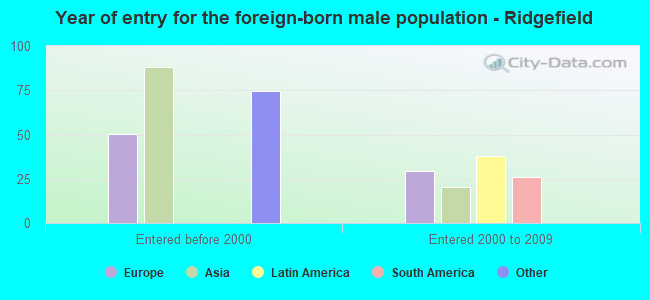
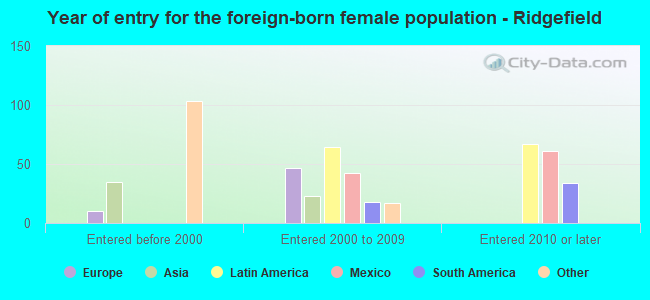
Foreign-born residents in Ridgefield
676 residents are foreign born (1.5% Asia, 1.4% Europe, 1.2% Latin America, 1.2% Oceania).
| This city: | 5.7% |
| Washington: | 14.9% |
Marital status for residents in Ridgefield
Marital status - White (Caucasian) population 15 years and over
- Males
- 24.5%Never married
- 68.4%Now married
- 2.8%Separated
- 0.8%Widowed
- 3.5%Divorced
- Females
- 21.2%Never married
- 59.4%Now married
- 2.1%Separated
- 3.2%Widowed
- 14.1%Divorced
Women who gave birth in the past 12 months
| Now married: | 100.0% (92) |
| Unmarried: | 0.0% (0) |
Women who did not give birth in the past 12 months
| Now married: | 58.5% (1,274) |
| Unmarried: | 41.5% (903) |
Marital status - Black or African American population 15 years and over
- Males
- 26.4%Never married
- 73.6%Now married
- 0.0%Separated
- 0.0%Widowed
- 0.0%Divorced
- Females
- 0.0%Never married
- 100.0%Now married
- 0.0%Separated
- 0.0%Widowed
- 0.0%Divorced
Women who gave birth in the past 12 months
| Now married: | 100.0% (33) |
| Unmarried: | 0.0% (0) |
Women who did not give birth in the past 12 months
| Now married: | 100.0% (13) |
| Unmarried: | 0.0% (0) |
Marital status - Asian population 15 years and over
- Males
- 0.0%Never married
- 100.0%Now married
- 0.0%Separated
- 0.0%Widowed
- 0.0%Divorced
- Females
- 10.8%Never married
- 79.7%Now married
- 0.0%Separated
- 9.5%Widowed
- 0.0%Divorced
Women who did not give birth in the past 12 months
| Now married: | 76.5% (28) |
| Unmarried: | 23.5% (9) |
Marital status - Other race population 15 years and over
- Males
- 36.6%Never married
- 63.4%Now married
- 0.0%Separated
- 0.0%Widowed
- 0.0%Divorced
- Females
- 0.0%Never married
- 100.0%Now married
- 0.0%Separated
- 0.0%Widowed
- 0.0%Divorced
Women who did not give birth in the past 12 months
| Now married: | 100.0% (31) |
| Unmarried: | 0.0% (0) |
Marital status - Two or more races population 15 years and over
- Males
- 20.1%Never married
- 68.9%Now married
- 0.0%Separated
- 0.0%Widowed
- 10.9%Divorced
- Females
- 18.7%Never married
- 58.9%Now married
- 13.9%Separated
- 7.2%Widowed
- 1.4%Divorced
Women who did not give birth in the past 12 months
| Now married: | 71.3% (134) |
| Unmarried: | 28.7% (54) |
Marital status - White alone, not Hispanic / Latino population 15 years and over
- Males
- 21.9%Never married
- 70.7%Now married
- 2.9%Separated
- 0.8%Widowed
- 3.7%Divorced
- Females
- 21.7%Never married
- 59.1%Now married
- 2.1%Separated
- 3.3%Widowed
- 13.8%Divorced
Women who gave birth in the past 12 months
| Now married: | 100.0% (82) |
| Unmarried: | 0.0% (0) |
Women who did not give birth in the past 12 months
| Now married: | 58.2% (1,277) |
| Unmarried: | 41.8% (916) |
Marital status - Hispanic or Latino population 15 years and over
- Males
- 50.2%Never married
- 40.8%Now married
- 0.0%Separated
- 0.0%Widowed
- 9.1%Divorced
- Females
- 8.6%Never married
- 69.3%Now married
- 10.4%Separated
- 0.0%Widowed
- 11.8%Divorced
Women who gave birth in the past 12 months
| Now married: | 100.0% (15) |
| Unmarried: | 0.0% (0) |
Women who did not give birth in the past 12 months
| Now married: | 77.3% (165) |
| Unmarried: | 22.7% (49) |
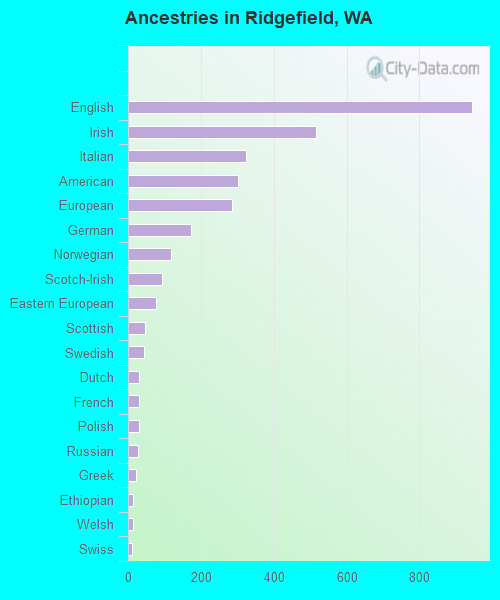
Ancestries in Ridgefield

- 94420.3%English
- 51511.1%Irish
- 3237.0%Italian
- 3036.5%American
- 2856.1%European
- 1723.7%German
- 1182.5%Norwegian
- 942.0%Scotch-Irish
- 771.7%Eastern European
- 481.0%Scottish
- 451.0%Swedish
- 300.6%Dutch
- 300.6%French
- 290.6%Polish
- 280.6%Russian
- 230.5%Greek
- 150.3%Ethiopian
- 130.3%Welsh
- 120.3%Swiss
- 80.2%Portuguese
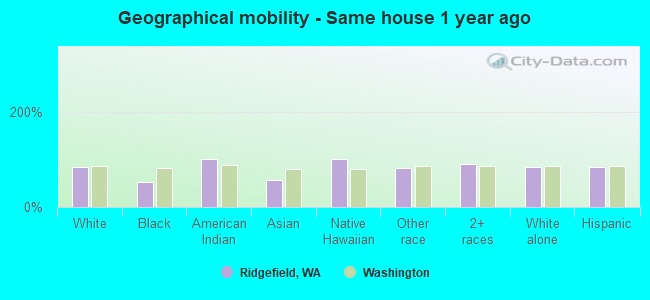
Geographical mobility in Ridgefield

- Same house 1 year ago
- 8,07884.2%White (Caucasian)
- 8553.0%Black or African American
- 217100.0%American Indian / Alaska Native
- 11355.7%Asian
- 4100.0%Native Hawaiian / Pacific Islander
- 15881.1%Other race
- 1,00389.9%Two or more races
- 8,03684.4%White alone, not Hispanic / Latino
- 86383.8%Hispanic or Latino
-
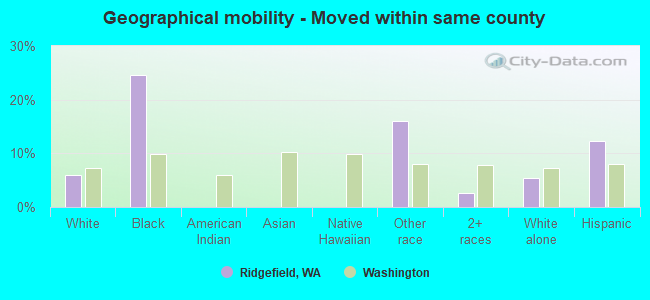
- Moved within same county
- 5705.9%White / Caucasian
- 4024.6%Black or African American
- 3116.1%Other race
- 292.6%Two or more races
- 5075.3%White alone, not Hispanic / Latino
- 12612.2%Hispanic or Latino
-
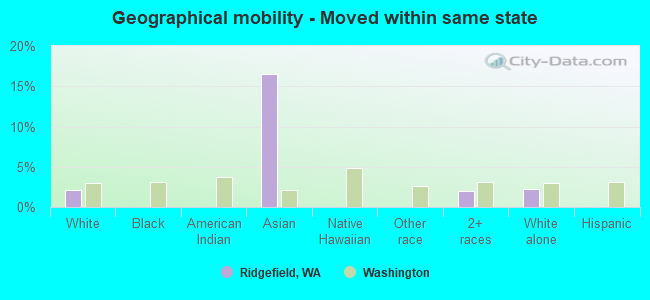
- Moved within same state
- 2002.1%White / Caucasian
- 3416.5%Asian
- 222.0%Two or more races
- 2162.3%White alone, not Hispanic / Latino
-
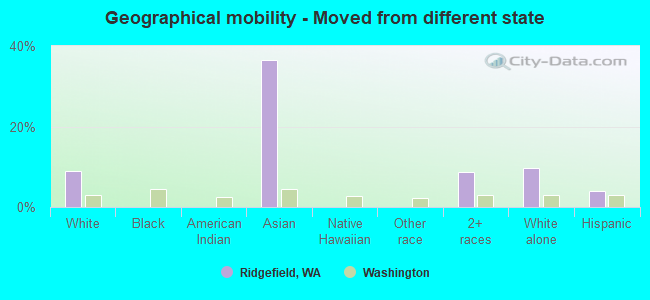
- Moved from different state
- 8578.9%White / Caucasian
- 7436.6%Asian
- 978.7%Two or more races
- 9139.6%White alone, not Hispanic / Latino
- 424.1%Hispanic or Latino
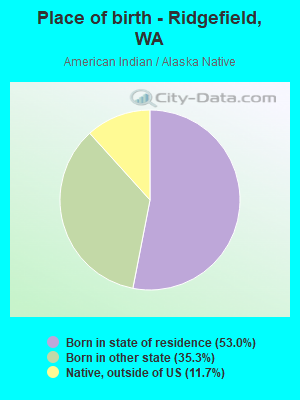
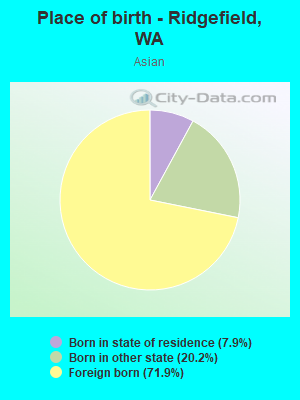
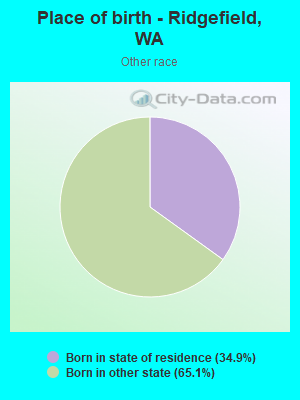
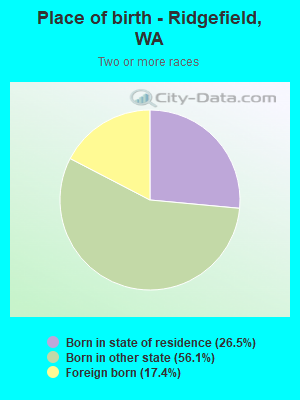
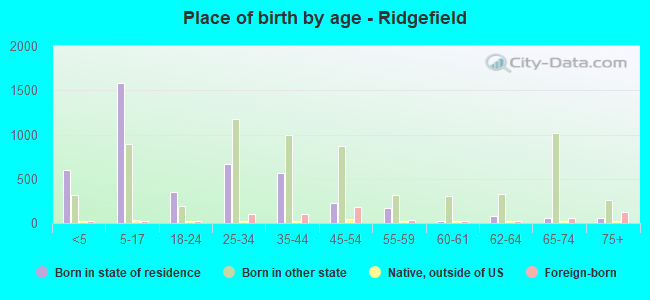
Children Nativity (place of birth) in Ridgefield
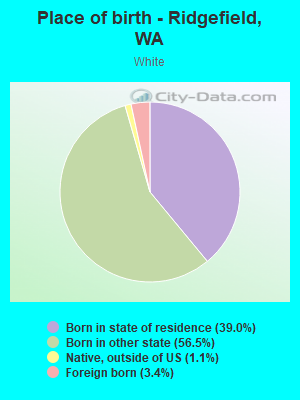
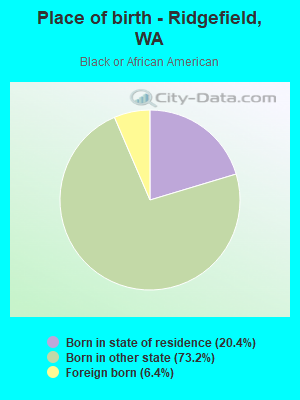
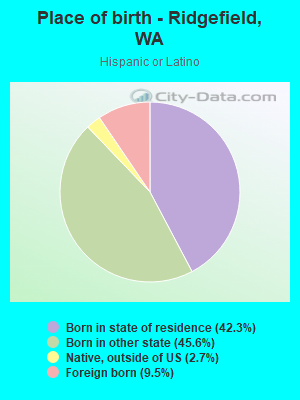
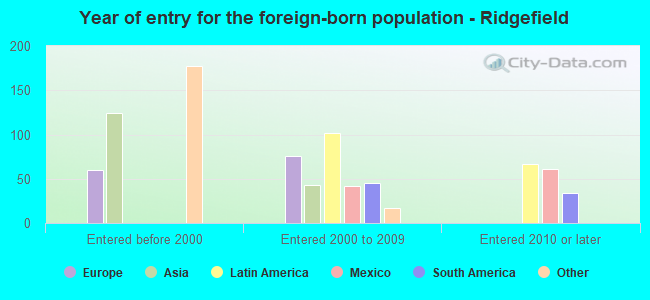
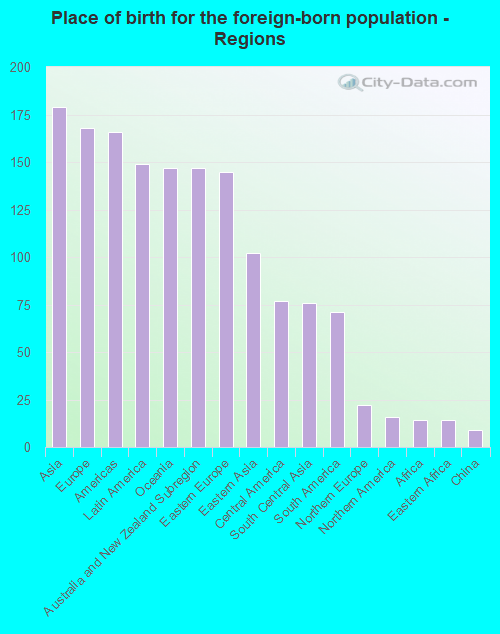
Place of birth for residents in Ridgefield
![Place of birth for the foreign-born population - Regions]()
- 179Asia
- 168Europe
- 166Americas
- 149Latin America
- 147Oceania
- 147Australia and New Zealand Subregion
- 145Eastern Europe
- 102Eastern Asia
- 77Central America
- 76South Central Asia
- 71South America
- 22Northern Europe
- 16Northern America
- 14Africa
- 14Eastern Africa
- 9China
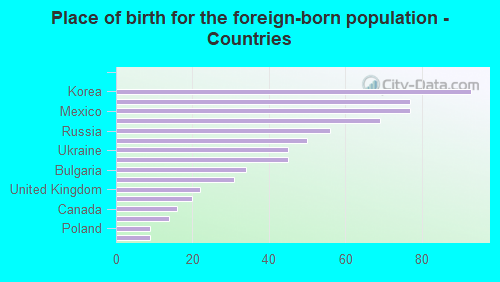
![Place of birth for the foreign-born population - Countries]()
- 93Korea
- 77New Zealand
- 77Mexico
- 69Australia
- 56Russia
- 50Brazil
- 45Ukraine
- 45India
- 34Bulgaria
- 31Iran
- 22United Kingdom
- 20Venezuela
- 16Canada
- 14Ethiopia
- 9Poland
- 9Hong Kong
Grandparents responsible for own grandchildren in Ridgefield
Zip codes: 98642.