Races in River Falls, Wisconsin (WI) Detailed Stats
Data:
Races - White alone (%)
Races - White alone (% change since 2000)
Races - Black alone (%)
Races - Black alone (% change since 2000)
Races - American Indian alone (%)
Races - American Indian alone (% change since 2000)
Races - Asian alone (%)
Races - Asian alone (% change since 2000)
Races - Hispanic (%)
Races - Hispanic (% change since 2000)
Races - Native Hawaiian and Other Pacific Islander alone (%)
Races - Native Hawaiian and Other Pacific Islander alone (% change since 2000)
Races - Two or more races(%)
Races - Two or more races(% change since 2000)
Races - Other race alone (%)
Races - Other race alone (% change since 2000)
Racial diversity
Place of birth - Born in state of residence (%)
Place of birth - Born in state of residence (%) - White
Place of birth - Born in state of residence (%) - Black or African American
Place of birth - Born in state of residence (%) - Asian
Place of birth - Born in state of residence (%) - Hispanic or Latino
Place of birth - Born in state of residence (%) - American Indian and Alaska Native
Place of birth - Born in state of residence (%) - Multirace
Place of birth - Born in state of residence (%) - Other Race
Place of birth - Born in other state (%)
Place of birth - Born in other state (%) - White
Place of birth - Born in other state (%) - Black or African American
Place of birth - Born in other state (%) - Asian
Place of birth - Born in other state (%) - Hispanic or Latino
Place of birth - Born in other state (%) - American Indian and Alaska Native
Place of birth - Born in other state (%) - Multirace
Place of birth - Born in other state (%) - Other Race
Place of birth - Native, outside of US (%)
Place of birth - Native, outside of US (%) - White
Place of birth - Native, outside of US (%) - Black or African American
Place of birth - Native, outside of US (%) - Asian
Place of birth - Native, outside of US (%) - Hispanic or Latino
Place of birth - Native, outside of US (%) - American Indian and Alaska Native
Place of birth - Native, outside of US (%) - Multirace
Place of birth - Native, outside of US (%) - Other Race
Place of birth - Foreign born (%)
Place of birth - Foreign born (%) - White
Place of birth - Foreign born (%) - Black or African American
Place of birth - Foreign born (%) - Asian
Place of birth - Foreign born (%) - Hispanic or Latino
Place of birth - Foreign born (%) - American Indian and Alaska Native
Place of birth - Foreign born (%) - Multirace
Place of birth - Foreign born (%) - Other Race
Residents speaking English at home (%)
Residents speaking English at home - Born in the United States (%)
Residents speaking English at home - Native, born elsewhere (%)
Residents speaking English at home - Foreign born (%)
Residents speaking Spanish at home (%)
Residents speaking Spanish at home - Born in the United States (%)
Residents speaking Spanish at home - Native, born elsewhere (%)
Residents speaking Spanish at home - Foreign born (%)
Residents speaking other language at home (%)
Residents speaking other language at home - Born in the United States (%)
Residents speaking other language at home - Native, born elsewhere (%)
Residents speaking other language at home - Foreign born (%)
Marital status - Never married (%)
Marital status - Now married (%)
Marital status - Separated (%)
Marital status - Widowed (%)
Marital status - Divorced (%)
Ancestries Reported - Arab (%)
Ancestries Reported - Czech (%)
Ancestries Reported - Danish (%)
Ancestries Reported - Dutch (%)
Ancestries Reported - English (%)
Ancestries Reported - French (%)
Ancestries Reported - French Canadian (%)
Ancestries Reported - German (%)
Ancestries Reported - Greek (%)
Ancestries Reported - Hungarian (%)
Ancestries Reported - Irish (%)
Ancestries Reported - Italian (%)
Ancestries Reported - Lithuanian (%)
Ancestries Reported - Norwegian (%)
Ancestries Reported - Polish (%)
Ancestries Reported - Portuguese (%)
Ancestries Reported - Russian (%)
Ancestries Reported - Scotch-Irish (%)
Ancestries Reported - Scottish (%)
Ancestries Reported - Slovak (%)
Ancestries Reported - Subsaharan African (%)
Ancestries Reported - Swedish (%)
Ancestries Reported - Swiss (%)
Ancestries Reported - Ukrainian (%)
Ancestries Reported - United States (%)
Ancestries Reported - Welsh (%)
Ancestries Reported - West Indian (%)
Ancestries Reported - Other (%)
Geographical mobility - Same house 1 year ago (%)
Geographical mobility - Same house 1 year ago (%) - White
Geographical mobility - Same house 1 year ago (%) - Black or African American
Geographical mobility - Same house 1 year ago (%) - Asian
Geographical mobility - Same house 1 year ago (%) - Hispanic or Latino
Geographical mobility - Same house 1 year ago (%) - American Indian and Alaska Native
Geographical mobility - Same house 1 year ago (%) - Multirace
Geographical mobility - Same house 1 year ago (%) - Other Race
Geographical mobility - Moved within same county (%)
Geographical mobility - Moved within same county (%) - White
Geographical mobility - Moved within same county (%) - Black or African American
Geographical mobility - Moved within same county (%) - Asian
Geographical mobility - Moved within same county (%) - Hispanic or Latino
Geographical mobility - Moved within same county (%) - American Indian and Alaska Native
Geographical mobility - Moved within same county (%) - Multirace
Geographical mobility - Moved within same county (%) - Other Race
Geographical mobility - Moved from different county within same state (%)
Geographical mobility - Moved from different county within same state (%) - White
Geographical mobility - Moved from different county within same state (%) - Black or African American
Geographical mobility - Moved from different county within same state (%) - Asian
Geographical mobility - Moved from different county within same state (%) - Hispanic or Latino
Geographical mobility - Moved from different county within same state (%) - American Indian and Alaska Native
Geographical mobility - Moved from different county within same state (%) - Multirace
Geographical mobility - Moved from different county within same state (%) - Other Race
Geographical mobility - Moved from different state (%)
Geographical mobility - Moved from different state (%) - White
Geographical mobility - Moved from different state (%) - Black or African American
Geographical mobility - Moved from different state (%) - Asian
Geographical mobility - Moved from different state (%) - Hispanic or Latino
Geographical mobility - Moved from different state (%) - American Indian and Alaska Native
Geographical mobility - Moved from different state (%) - Multirace
Geographical mobility - Moved from different state (%) - Other Race
Geographical mobility - Moved from abroad (%)
Geographical mobility - Moved from abroad (%) - White
Geographical mobility - Moved from abroad (%) - Black or African American
Geographical mobility - Moved from abroad (%) - Asian
Geographical mobility - Moved from abroad (%) - Hispanic or Latino
Geographical mobility - Moved from abroad (%) - American Indian and Alaska Native
Geographical mobility - Moved from abroad (%) - Multirace
Geographical mobility - Moved from abroad (%) - Other Race
Place of birth for the foreign-born population - Ireland (%)
Place of birth for the foreign-born population - Denmark (%)
Place of birth for the foreign-born population - Norway (%)
Place of birth for the foreign-born population - Sweden (%)
Place of birth for the foreign-born population - United Kingdom (%)
Place of birth for the foreign-born population - England (%)
Place of birth for the foreign-born population - Scotland (%)
Place of birth for the foreign-born population - Other Northern Europe (%)
Place of birth for the foreign-born population - Austria (%)
Place of birth for the foreign-born population - Belgium (%)
Place of birth for the foreign-born population - France (%)
Place of birth for the foreign-born population - Germany (%)
Place of birth for the foreign-born population - Netherlands (%)
Place of birth for the foreign-born population - Switzerland (%)
Place of birth for the foreign-born population - Other Western Europe (%)
Place of birth for the foreign-born population - Greece (%)
Place of birth for the foreign-born population - Italy (%)
Place of birth for the foreign-born population - Portugal (%)
Place of birth for the foreign-born population - Spain (%)
Place of birth for the foreign-born population - Other Southern Europe (%)
Place of birth for the foreign-born population - Albania (%)
Place of birth for the foreign-born population - Belarus (%)
Place of birth for the foreign-born population - Bosnia and Herzegovina (%)
Place of birth for the foreign-born population - Bulgaria (%)
Place of birth for the foreign-born population - Croatia (%)
Place of birth for the foreign-born population - Czechoslovakia (%)
Place of birth for the foreign-born population - Hungary (%)
Place of birth for the foreign-born population - Latvia (%)
Place of birth for the foreign-born population - Lithuania (%)
Place of birth for the foreign-born population - North Macedonia (Macedonia) (%)
Place of birth for the foreign-born population - Moldova (%)
Place of birth for the foreign-born population - Poland (%)
Place of birth for the foreign-born population - Romania (%)
Place of birth for the foreign-born population - Russia (%)
Place of birth for the foreign-born population - Serbia (%)
Place of birth for the foreign-born population - Ukraine (%)
Place of birth for the foreign-born population - Other Eastern Europe (%)
Place of birth for the foreign-born population - China (%)
Place of birth for the foreign-born population - Hong Kong (%)
Place of birth for the foreign-born population - Taiwan (%)
Place of birth for the foreign-born population - Japan (%)
Place of birth for the foreign-born population - Korea (%)
Place of birth for the foreign-born population - Other Eastern Asia (%)
Place of birth for the foreign-born population - Afghanistan (%)
Place of birth for the foreign-born population - Bangladesh (%)
Place of birth for the foreign-born population - India (%)
Place of birth for the foreign-born population - Iran (%)
Place of birth for the foreign-born population - Kazakhstan (%)
Place of birth for the foreign-born population - Nepal (%)
Place of birth for the foreign-born population - Pakistan (%)
Place of birth for the foreign-born population - Sri Lanka (%)
Place of birth for the foreign-born population - Uzbekistan (%)
Place of birth for the foreign-born population - Other South Central Asia (%)
Place of birth for the foreign-born population - Burma (%)
Place of birth for the foreign-born population - Cambodia (%)
Place of birth for the foreign-born population - Indonesia (%)
Place of birth for the foreign-born population - Laos (%)
Place of birth for the foreign-born population - Malaysia (%)
Place of birth for the foreign-born population - Philippines (%)
Place of birth for the foreign-born population - Singapore (%)
Place of birth for the foreign-born population - Thailand (%)
Place of birth for the foreign-born population - Vietnam (%)
Place of birth for the foreign-born population - Other South Eastern Asia (%)
Place of birth for the foreign-born population - Armenia (%)
Place of birth for the foreign-born population - Iraq (%)
Place of birth for the foreign-born population - Israel (%)
Place of birth for the foreign-born population - Jordan (%)
Place of birth for the foreign-born population - Kuwait (%)
Place of birth for the foreign-born population - Lebanon (%)
Place of birth for the foreign-born population - Saudi Arabia (%)
Place of birth for the foreign-born population - Syria (%)
Place of birth for the foreign-born population - Turkey (%)
Place of birth for the foreign-born population - Yemen (%)
Place of birth for the foreign-born population - Other Western Asia (%)
Place of birth for the foreign-born population - Eritrea (%)
Place of birth for the foreign-born population - Ethiopia (%)
Place of birth for the foreign-born population - Kenya (%)
Place of birth for the foreign-born population - Somalia (%)
Place of birth for the foreign-born population - Uganda (%)
Place of birth for the foreign-born population - Zimbabwe (%)
Place of birth for the foreign-born population - Other Eastern Africa (%)
Place of birth for the foreign-born population - Cameroon (%)
Place of birth for the foreign-born population - Congo (%)
Place of birth for the foreign-born population - Democratic Republic of Congo (Zaire) (%)
Place of birth for the foreign-born population - Other Middle Africa (%)
Place of birth for the foreign-born population - Egypt (%)
Place of birth for the foreign-born population - Morocco (%)
Place of birth for the foreign-born population - Sudan (%)
Place of birth for the foreign-born population - Other Northern Africa (%)
Place of birth for the foreign-born population - South Africa (%)
Place of birth for the foreign-born population - Other Southern Africa (%)
Place of birth for the foreign-born population - Cabo Verde (%)
Place of birth for the foreign-born population - Ghana (%)
Place of birth for the foreign-born population - Liberia (%)
Place of birth for the foreign-born population - Nigeria (%)
Place of birth for the foreign-born population - Senegal (%)
Place of birth for the foreign-born population - Sierra Leone (%)
Place of birth for the foreign-born population - Other Western Africa (%)
Place of birth for the foreign-born population - Australia (%)
Place of birth for the foreign-born population - New Zealand (%)
Place of birth for the foreign-born population - Fiji (%)
Place of birth for the foreign-born population - Micronesia (%)
Place of birth for the foreign-born population - Bahamas (%)
Place of birth for the foreign-born population - Barbados (%)
Place of birth for the foreign-born population - Cuba (%)
Place of birth for the foreign-born population - Dominica (%)
Place of birth for the foreign-born population - Dominican Republic (%)
Place of birth for the foreign-born population - Grenada (%)
Place of birth for the foreign-born population - Haiti (%)
Place of birth for the foreign-born population - Jamaica (%)
Place of birth for the foreign-born population - St. Vincent and the Grenadines (%)
Place of birth for the foreign-born population - Trinidad and Tobago (%)
Place of birth for the foreign-born population - West Indies (%)
Place of birth for the foreign-born population - Other Caribbean (%)
Place of birth for the foreign-born population - Belize (%)
Place of birth for the foreign-born population - Costa Rica (%)
Place of birth for the foreign-born population - El Salvador (%)
Place of birth for the foreign-born population - Guatemala (%)
Place of birth for the foreign-born population - Honduras (%)
Place of birth for the foreign-born population - Mexico (%)
Place of birth for the foreign-born population - Nicaragua (%)
Place of birth for the foreign-born population - Panama (%)
Place of birth for the foreign-born population - Other Central America (%)
Place of birth for the foreign-born population - Argentina (%)
Place of birth for the foreign-born population - Bolivia (%)
Place of birth for the foreign-born population - Brazil (%)
Place of birth for the foreign-born population - Chile (%)
Place of birth for the foreign-born population - Colombia (%)
Place of birth for the foreign-born population - Ecuador (%)
Place of birth for the foreign-born population - Guyana (%)
Place of birth for the foreign-born population - Peru (%)
Place of birth for the foreign-born population - Uruguay (%)
Place of birth for the foreign-born population - Venezuela (%)
Place of birth for the foreign-born population - Other South America (%)
Place of birth for the foreign-born population - Canada (%)
Place of birth for the foreign-born population - Other Northern America (%)
Place of birth for the foreign-born population - Other (%)
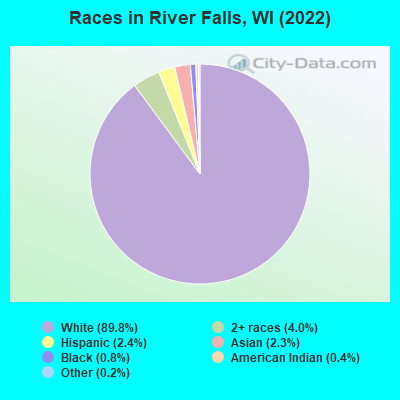
According to 2022 data, the most numerous races in River Falls, WI are White alone (14,548 residents), Hispanic (386 residents), and Black alone (123 residents). 95.6% of River Falls residents speak English at home. 2.4% of River Falls, WI residents are foreign-born (1.6% born in Asia, 0.4% born in Europe), which is 110.9% less than the foreign-born rate of 5.0% across the entire state of Wisconsin.
Race distribution in River Falls
2000 2022
4,681,630 87.3% White alone 300,245 5.6% Black alone 192,921 3.6% Hispanic 87,995 1.6% Asian alone 51,921 1.0% Two or more races 43,980 0.8% American Indian alone 3,637 0.07% Other race alone 1,346 0.03% Native Hawaiian and Other
4,654,031 79.0% White alone 447,022 7.6% Hispanic 345,678 5.9% Black alone 217,532 3.7% Two or more races 172,242 2.9% Asian alone 33,762 0.6% American Indian alone 19,680 0.3% Other race alone 2,592 0.04% Native Hawaiian and Other
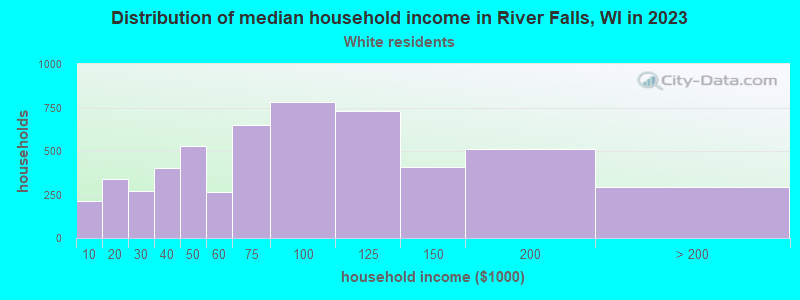
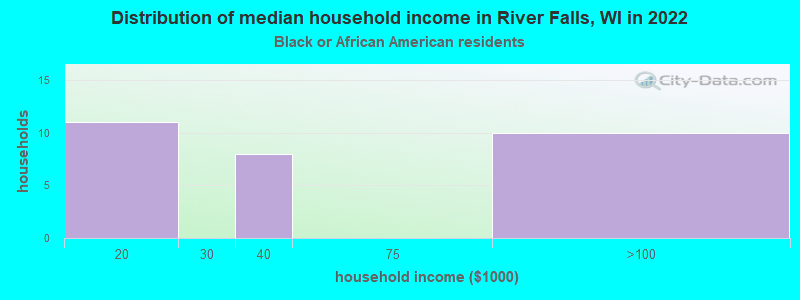
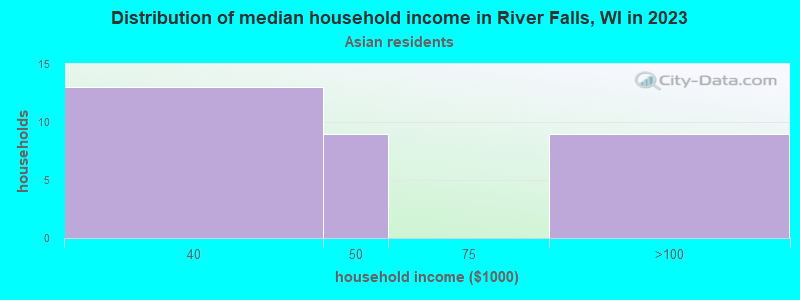
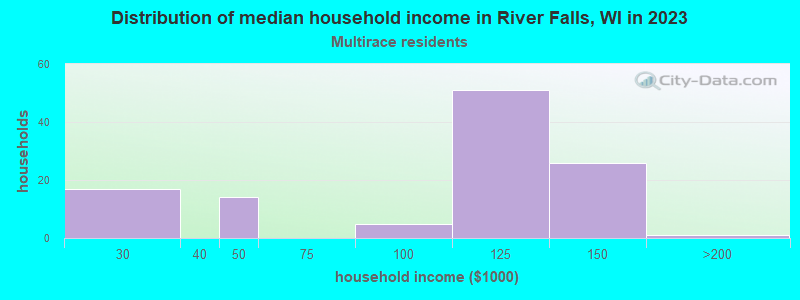
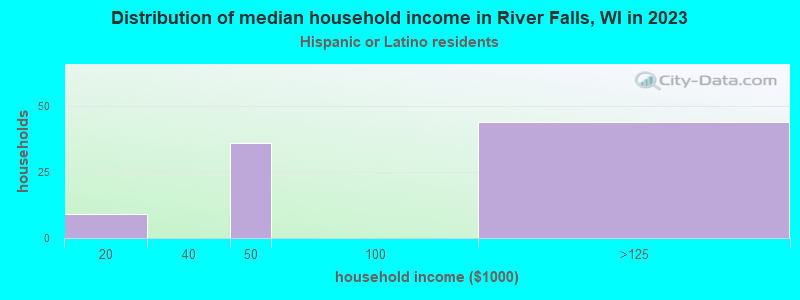
Income and house value in River Falls Median household income in 2022 $71,830 White non-Hispanic householders$90,776 Asian householders$100,649 Two or more races householders$47,055 Hispanic or Latino race householdersMedian 2022 house value $303,665 White Non-Hispanic householders$294,115 American Indian or Alaska Native householders $202,920 Asian householders$268,571 Some other race householders$432,818 Two or more races householders$268,571 Hispanic or Latino householders
Median age by race in River Falls
28.7 Median age for White residents31.8 25.5 22.8 Median age for Black or African American residents25.3 23.2 20.1 Median age for American Indian / Alaska Native residents13.7 -689,393,938.7 22.2 Median age for Asian residents23.1 22.0 -825,688,072.6 Median age for Native Hawaiian / Pacific Islander residents-862,745,097.2 -732,444,443.7 24.1 Median age for Other race residents26.3 24.0 20.6 Median age for Two or more races residents21.7 14.3 28.7 Median age for White alone residents31.6 26.2 25.1 Median age for Hispanic or Latino residents31.2 23.2
Owner/renter occupied households by race in River Falls
House owners and renters - White residents 3,102 58.8% Owner occupied2,170 41.2% Renter occupiedHouse owners and renters - Black or African American residents 46 100.0% Renter occupiedHouse owners and renters - Asian residents 3 8.8% Owner occupied35 91.2% Renter occupiedHouse owners and renters - Other race residents 14 100.0% Renter occupiedHouse owners and renters - Two or more races residents 49 52.0% Owner occupied45 48.0% Renter occupiedHouse owners and renters - White alone residents 3,115 58.8% Owner occupied2,179 41.2% Renter occupiedHouse owners and renters - Hispanic or Latino residents 20 23.4% Owner occupied65 76.6% Renter occupied
Language usage in River Falls
English speakers - Total 95.6% of residents of River Falls speak English at home.
1.4% of residents speak Spanish at home 164 77.0% Speak English very well49 23.0% Speak English less than very well3.0% of residents speak other language at home 356 75.4% Speak English very well116 24.6% Speak English less than very well
English speakers - Born in the United States 97.4% of residents of River Falls speak English at home.
1.4% of residents speak Spanish at home 107 89.2% Speak English very well13 10.8% Speak English less than very well1.1% of residents speak other language at home 92 96.8% Speak English very well3 3.2% Speak English less than very well
English speakers - Native, born elsewhere 69.4% of residents of River Falls speak English at home.
19.2% of residents speak Spanish at home 23 62.2% Speak English very well14 37.8% Speak English less than very well10.4% of residents speak other language at home 16 80.0% Speak English very well4 20.0% Speak English less than very well
English speakers - Foreign-born 15.6% of residents of River Falls speak English at home.
8.3% of residents speak Spanish at home 13 40.6% Speak English very well19 59.4% Speak English less than very well76.3% of residents speak other language at home 188 64.2% Speak English very well105 35.8% Speak English less than very well
White (Caucasian) - Speak only English Native:
99.0% (13,861)Foreign-born:
43.6% (41)
White (Caucasian) - Speak another language Native:
1.2% (174)Foreign-born:
57.3% (53)
Black or African American - Speak another language Native:
12.3% (16)Foreign-born:
100.0% (25)
Asian - Speak only English Native:
56.1% (109)Foreign-born:
8.3% (15)
Asian - Speak another language Native:
44.7% (87)Foreign-born:
92.7% (164)
Native Hawaiian / Pacific Islander - Speak another language Native:
100.0% (3)Foreign-born:
100.0% (2)
Other race - Speak another language Native:
23.6% (11)Foreign-born:
98.8% (13)
Two or more races - Speak another language Native:
2.2% (17)Foreign-born:
100.0% (54)
White alone - Speak only English Native:
99.0% (13,789)Foreign-born:
35.2% (45)
White alone - Speak another language Native:
1.0% (137)Foreign-born:
64.9% (82)
Hispanic or Latino - Speak another language Native:
38.7% (134)Foreign-born:
100.0% (34)
Foreign-born residents in River Falls 384 residents are foreign born (1.6% Asia , 0.4% Europe ).
This city:
2.4%Wisconsin:
5.0%
Marital status for residents in River Falls Marital status - White (Caucasian) population 15 years and over
Males 49.4% Never married41.2% Now married0.5% Separated1.1% Widowed7.8% DivorcedFemales 54.9% Never married33.4% Now married0.0% Separated4.5% Widowed7.2% DivorcedWomen who gave birth in the past 12 months Now married:
94.9% (125)Unmarried:
5.1% (7)
Women who did not give birth in the past 12 months Now married:
23.9% (1,111)Unmarried:
76.1% (3,544)
Marital status - Black or African American population 15 years and over
Males 90.1% Never married0.0% Now married0.0% Separated0.0% Widowed9.9% DivorcedFemales 100.0% Never married0.0% Now married0.0% Separated0.0% Widowed0.0% DivorcedWomen who did not give birth in the past 12 months Now married:
0.0% (0)Unmarried:
100.0% (73)
Marital status - American Indian / Alaska Native population 15 years and over
Males 100.0% Never married0.0% Now married0.0% Separated0.0% Widowed0.0% DivorcedFemales 100.0% Never married0.0% Now married0.0% Separated0.0% Widowed0.0% DivorcedWomen who did not give birth in the past 12 months Now married:
0.0% (0)Unmarried:
100.0% (8)
Marital status - Asian population 15 years and over
Males 81.2% Never married5.2% Now married0.0% Separated0.0% Widowed13.5% DivorcedFemales 70.8% Never married8.8% Now married0.0% Separated1.8% Widowed18.6% DivorcedWomen who did not give birth in the past 12 months Now married:
5.2% (10)Unmarried:
94.8% (180)
Marital status - Other race population 15 years and over
Males 100.0% Never married0.0% Now married0.0% Separated0.0% Widowed0.0% DivorcedFemales 71.0% Never married29.0% Now married0.0% Separated0.0% Widowed0.0% DivorcedWomen who did not give birth in the past 12 months Now married:
0.0% (0)Unmarried:
100.0% (20)
Marital status - Two or more races population 15 years and over
Males 77.1% Never married20.2% Now married0.0% Separated0.0% Widowed2.7% DivorcedFemales 37.7% Never married24.7% Now married0.0% Separated0.0% Widowed37.7% DivorcedWomen who did not give birth in the past 12 months Now married:
9.3% (16)Unmarried:
90.7% (159)
Marital status - White alone, not Hispanic / Latino population 15 years and over
Males 49.3% Never married41.4% Now married0.5% Separated1.2% Widowed7.6% DivorcedFemales 54.5% Never married33.7% Now married0.0% Separated4.6% Widowed7.3% DivorcedWomen who gave birth in the past 12 months Now married:
94.9% (127)Unmarried:
5.1% (7)
Women who did not give birth in the past 12 months Now married:
24.0% (1,122)Unmarried:
76.0% (3,545)
Marital status - Hispanic or Latino population 15 years and over
Males 73.2% Never married15.6% Now married0.0% Separated0.0% Widowed11.2% DivorcedFemales 62.8% Never married37.2% Now married0.0% Separated0.0% Widowed0.0% DivorcedWomen who did not give birth in the past 12 months Now married:
22.4% (23)Unmarried:
77.6% (79)
Ancestries in River Falls
2,075 32.3% German619 9.6% Irish573 8.9% Norwegian351 5.5% English319 5.0% European318 5.0% Scandinavian200 3.1% Swedish175 2.7% American141 2.2% Italian131 2.0% Czech118 1.8% Polish57 0.9% French46 0.7% Arab43 0.7% Celtic37 0.6% Austrian28 0.4% Palestinian22 0.3% Scotch-Irish21 0.3% Iranian21 0.3% Scottish19 0.3% Finnish17 0.3% French Canadian17 0.3% Kenyan14 0.2% Hungarian13 0.2% Russian13 0.2% Slovene11 0.2% Swiss11 0.2% Yugoslavian10 0.2% Northern European10 0.2% Czechoslovakian9 0.1% Ethiopian9 0.1% Ukrainian8 0.1% Belgian8 0.1% Slavic7 0.1% British6 0.09% Danish5 0.08% Dutch5 0.08% Icelander1 0.02% Lithuanian
Geographical mobility in River Falls Same house 1 year ago 9,345 64.7% White (Caucasian)70 47.6% Black or African American51 71.4% American Indian / Alaska Native110 30.1% Asian5 100.0% Native Hawaiian / Pacific Islander8 12.7% Other race595 70.0% Two or more races9,343 64.6% White alone, not Hispanic / Latino232 61.1% Hispanic or LatinoMoved within same county 1,399 9.7% White / Caucasian42 28.5% Black or African American8 2.1% Asian1,431 9.9% White alone, not Hispanic / LatinoMoved within same state 1,643 11.4% White / Caucasian8 5.4% Black or African American12 17.0% American Indian / Alaska Native3 0.9% Asian21 34.6% Other race108 12.7% Two or more races1,635 11.3% White alone, not Hispanic / Latino29 7.6% Hispanic or LatinoMoved from different state 1,967 13.6% White / Caucasian18 11.9% Black or African American5 7.0% American Indian / Alaska Native165 45.0% Asian51 84.5% Other race148 17.3% Two or more races1,988 13.7% White alone, not Hispanic / Latino116 30.5% Hispanic or LatinoMoved from abroad 22 0.2% White22 14.6% Black or African American124 33.7% Asian37 9.9% Hispanic or Latino
Children Nativity (place of birth) in River Falls
Children under 6 years - Living with two parents Both parents native 555 100.0% NativeChildren under 6 years - Living with one parent Native parent 159 100.0% NativeChildren 6 to 17 years - Living with two parents Both parents native 1,225 100.0% NativeBoth parents foreign-born 9 100.0% NativeOne native, one foreign-born parent 49 100.0% NativeChildren 6 to 17 years - Living with one parent Native parent 587 100.0% NativeForeign-born parent 5 48.4% Native5 51.6% Foreign-born
Grandparents responsible for own grandchildren in River Falls
Grandparents (30 to 59 years) White / Caucasian 19 100.0% Not responsible for grandchildrenWhite alone, not Hispanic / Latino 19 100.0% Not responsible for grandchildrenGrandparents (60 years and over) White / Caucasian 17 15.3% Responsible for grandchildren96 84.7% Not responsible for grandchildrenWhite alone, not Hispanic / Latino 17 14.9% Responsible for grandchildren99 85.1% Not responsible for grandchildren