Races in River Vale, New Jersey (NJ) Detailed Stats
Ancestries, Foreign-born residents, place of birth

Recent posts about races in River Vale, New Jersey on our local forum with over 2,400,000 registered users:
 | Opinions on River Vale, NJ (3 replies) |
| Moving from greater Philly area suburb to Northern NJ (72 replies) |
| Housing Market is going nuts (78 replies) |
| Narrow it down for me please: Allendale, Wyckoff, Old Tappan, River Vale, Ramsey (8 replies) |
| River Vale NJ advice (0 replies) |
| Looking to buy in NJ, commute to Midtown but outside rush hour (2 replies) |
11.5% of River Vale, NJ residents are foreign-born (5.5% born in Europe, 3.2% born in Asia, 2.2% born in Latin America), which is 99.7% less than the foreign-born rate of 23.0% across the entire state of New Jersey.
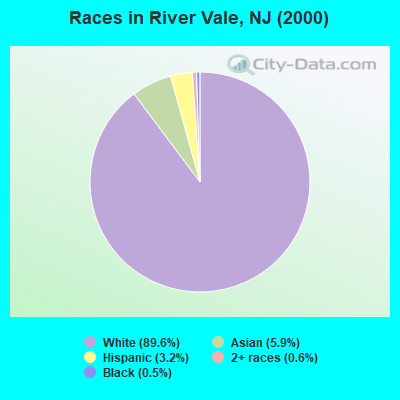
Race distribution in River Vale

- 8,47089.6%White alone
- 5565.9%Asian alone
- 3043.2%Hispanic
- 580.6%Two or more races
- 500.5%Black alone
- 90.10%Other race alone
- 20.02%Native Hawaiian and Other
Pacific Islander alone
2000
2022
-
- 5,557,20966.0%White alone
- 1,117,19113.3%Hispanic
- 1,096,17113.0%Black alone
- 477,0125.7%Asian alone
- 133,6891.6%Two or more races
- 19,5650.2%Other race alone
- 11,3380.1%American Indian alone
- 2,1750.03%Native Hawaiian and Other
Pacific Islander alone

-
- 4,766,47651.5%White alone
- 2,028,47021.9%Hispanic
- 1,111,63212.0%Black alone
- 923,54610.0%Asian alone
- 332,2373.6%Two or more races
- 89,8471.0%Other race alone
- 8,5570.09%American Indian alone
- 9340.01%Native Hawaiian and Other
Pacific Islander alone

Income and house value in River Vale
- Median household income in 2022
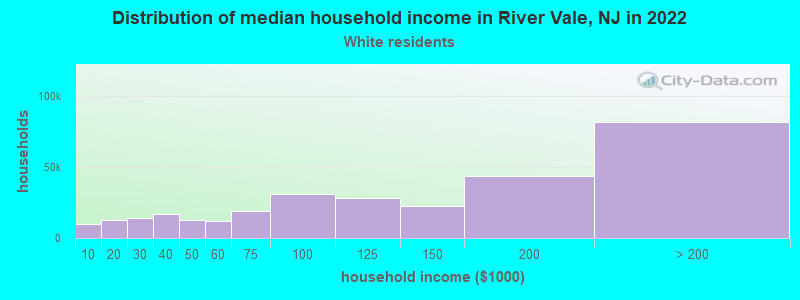
- $169,734White non-Hispanic householders
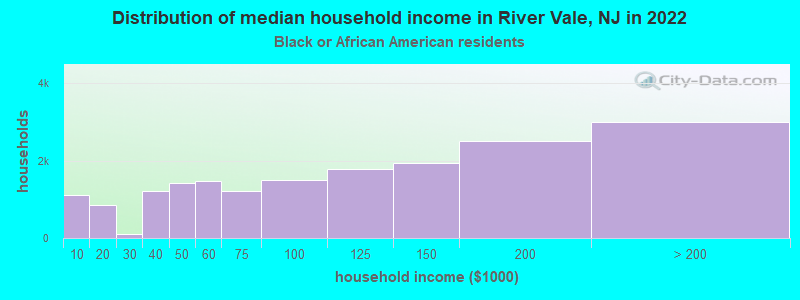
- $94,338Black householders
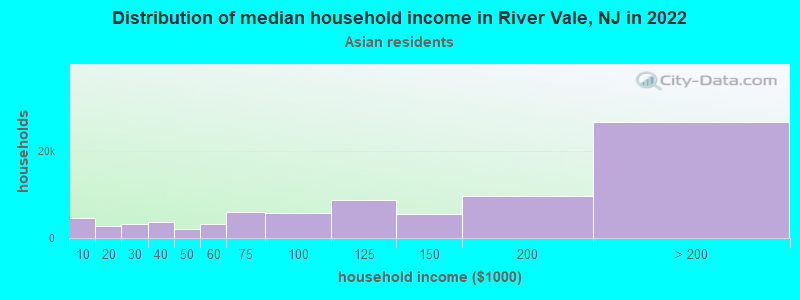
- $191,405Asian householders
- $84,529Some other race householders
- over $200,000Two or more races householders
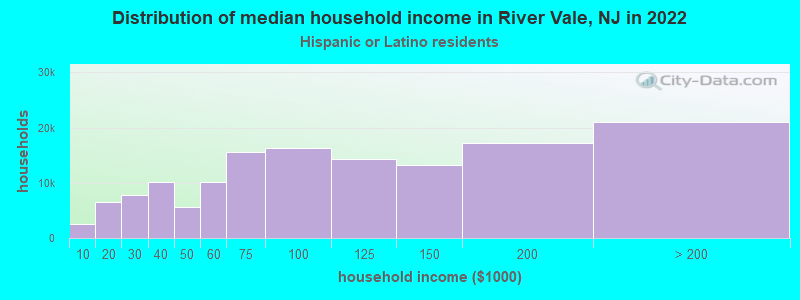
- $183,424Hispanic or Latino race householders
- Median 2022 house value
- $841,468White Non-Hispanic householders
- $390,458Black or African American householders
- $987,320Asian householders
- $390,458Some other race householders
- $660,776Two or more races householders
- $807,108Hispanic or Latino householders
Household income for White non-Hispanic householders
Household income for Black householders
Household income for Asian householders
Household income for Two or more races householders
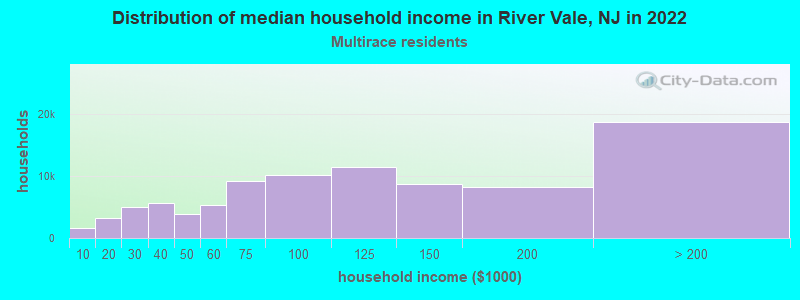
Household income for Hispanic or Latino race householders
Foreign-born residents in River Vale
1,088 residents are foreign born (5.5% Europe, 3.2% Asia, 2.2% Latin America).
| This city: | 11.5% |
| New Jersey: | 17.5% |
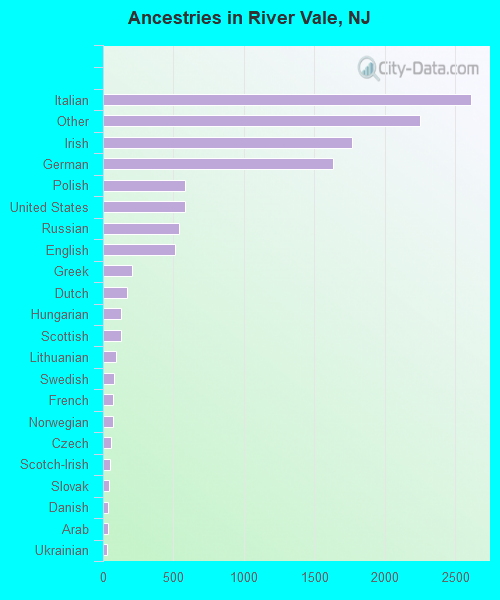
Ancestries in River Vale

- 2,61022.3%Italian
- 2,25319.2%Other
- 1,76715.1%Irish
- 1,63413.9%German
- 5815.0%Polish
- 5794.9%United States
- 5384.6%Russian
- 5094.3%English
- 2061.8%Greek
- 1671.4%Dutch
- 1301.1%Hungarian
- 1271.1%Scottish
- 890.8%Lithuanian
- 780.7%Swedish
- 740.6%French
- 730.6%Norwegian
- 590.5%Czech
- 510.4%Scotch-Irish
- 420.4%Slovak
- 390.3%Danish
- 360.3%Arab
- 260.2%Ukrainian
- 210.2%West Indian
- 180.2%Swiss
- 120.1%Portuguese
- 70.06%Welsh
Zip codes: 07675.