Races in Riverdale, Utah (UT) Detailed Stats
Data:
Races - White alone (%)
Races - White alone (% change since 2000)
Races - Black alone (%)
Races - Black alone (% change since 2000)
Races - American Indian alone (%)
Races - American Indian alone (% change since 2000)
Races - Asian alone (%)
Races - Asian alone (% change since 2000)
Races - Hispanic (%)
Races - Hispanic (% change since 2000)
Races - Native Hawaiian and Other Pacific Islander alone (%)
Races - Native Hawaiian and Other Pacific Islander alone (% change since 2000)
Races - Two or more races(%)
Races - Two or more races(% change since 2000)
Races - Other race alone (%)
Races - Other race alone (% change since 2000)
Racial diversity
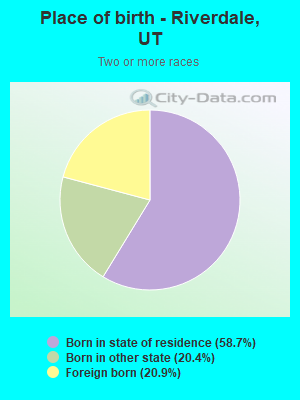
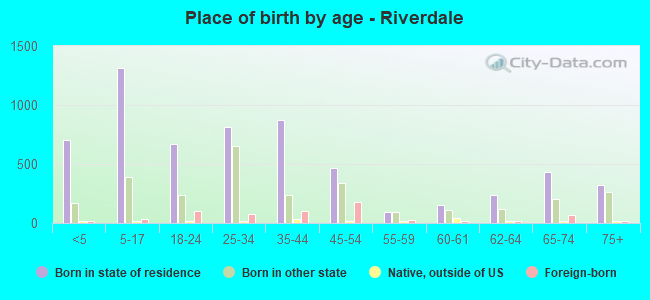
Place of birth - Born in state of residence (%)
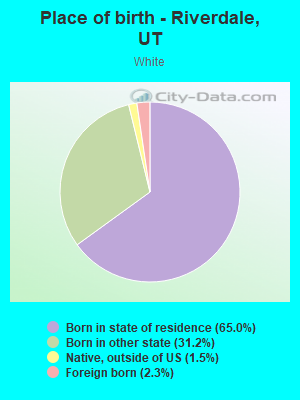
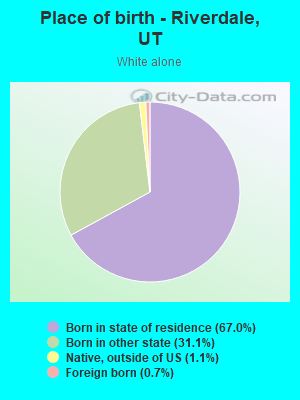
Place of birth - Born in state of residence (%) - White
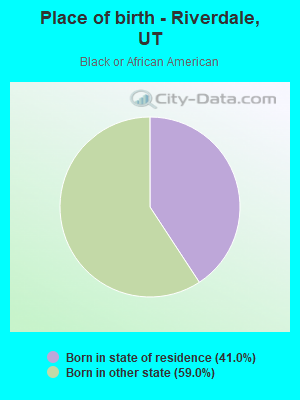
Place of birth - Born in state of residence (%) - Black or African American
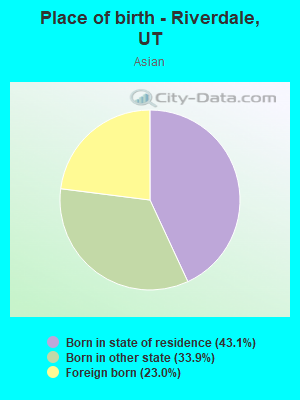
Place of birth - Born in state of residence (%) - Asian
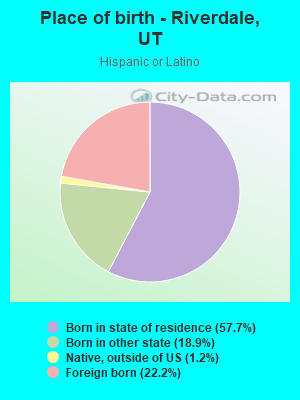
Place of birth - Born in state of residence (%) - Hispanic or Latino
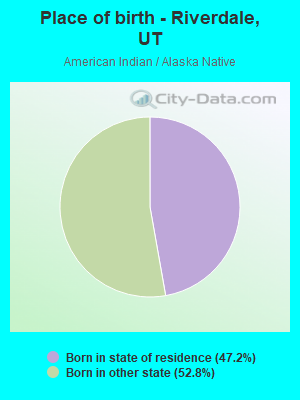
Place of birth - Born in state of residence (%) - American Indian and Alaska Native
Place of birth - Born in state of residence (%) - Multirace
Place of birth - Born in state of residence (%) - Other Race
Place of birth - Born in other state (%)
Place of birth - Born in other state (%) - White
Place of birth - Born in other state (%) - Black or African American
Place of birth - Born in other state (%) - Asian
Place of birth - Born in other state (%) - Hispanic or Latino
Place of birth - Born in other state (%) - American Indian and Alaska Native
Place of birth - Born in other state (%) - Multirace
Place of birth - Born in other state (%) - Other Race
Place of birth - Native, outside of US (%)
Place of birth - Native, outside of US (%) - White
Place of birth - Native, outside of US (%) - Black or African American
Place of birth - Native, outside of US (%) - Asian
Place of birth - Native, outside of US (%) - Hispanic or Latino
Place of birth - Native, outside of US (%) - American Indian and Alaska Native
Place of birth - Native, outside of US (%) - Multirace
Place of birth - Native, outside of US (%) - Other Race
Place of birth - Foreign born (%)
Place of birth - Foreign born (%) - White
Place of birth - Foreign born (%) - Black or African American
Place of birth - Foreign born (%) - Asian
Place of birth - Foreign born (%) - Hispanic or Latino
Place of birth - Foreign born (%) - American Indian and Alaska Native
Place of birth - Foreign born (%) - Multirace
Place of birth - Foreign born (%) - Other Race
Residents speaking English at home (%)
Residents speaking English at home - Born in the United States (%)
Residents speaking English at home - Native, born elsewhere (%)
Residents speaking English at home - Foreign born (%)
Residents speaking Spanish at home (%)
Residents speaking Spanish at home - Born in the United States (%)
Residents speaking Spanish at home - Native, born elsewhere (%)
Residents speaking Spanish at home - Foreign born (%)
Residents speaking other language at home (%)
Residents speaking other language at home - Born in the United States (%)
Residents speaking other language at home - Native, born elsewhere (%)
Residents speaking other language at home - Foreign born (%)
Marital status - Never married (%)
Marital status - Now married (%)
Marital status - Separated (%)
Marital status - Widowed (%)
Marital status - Divorced (%)
Ancestries Reported - Arab (%)
Ancestries Reported - Czech (%)
Ancestries Reported - Danish (%)
Ancestries Reported - Dutch (%)
Ancestries Reported - English (%)
Ancestries Reported - French (%)
Ancestries Reported - French Canadian (%)
Ancestries Reported - German (%)
Ancestries Reported - Greek (%)
Ancestries Reported - Hungarian (%)
Ancestries Reported - Irish (%)
Ancestries Reported - Italian (%)
Ancestries Reported - Lithuanian (%)
Ancestries Reported - Norwegian (%)
Ancestries Reported - Polish (%)
Ancestries Reported - Portuguese (%)
Ancestries Reported - Russian (%)
Ancestries Reported - Scotch-Irish (%)
Ancestries Reported - Scottish (%)
Ancestries Reported - Slovak (%)
Ancestries Reported - Subsaharan African (%)
Ancestries Reported - Swedish (%)
Ancestries Reported - Swiss (%)
Ancestries Reported - Ukrainian (%)
Ancestries Reported - United States (%)
Ancestries Reported - Welsh (%)
Ancestries Reported - West Indian (%)
Ancestries Reported - Other (%)
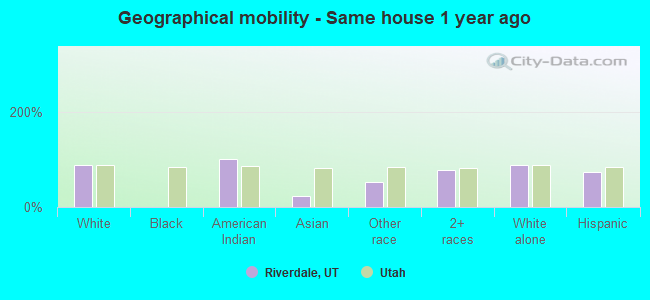
Geographical mobility - Same house 1 year ago (%)
Geographical mobility - Same house 1 year ago (%) - White
Geographical mobility - Same house 1 year ago (%) - Black or African American
Geographical mobility - Same house 1 year ago (%) - Asian
Geographical mobility - Same house 1 year ago (%) - Hispanic or Latino
Geographical mobility - Same house 1 year ago (%) - American Indian and Alaska Native
Geographical mobility - Same house 1 year ago (%) - Multirace
Geographical mobility - Same house 1 year ago (%) - Other Race
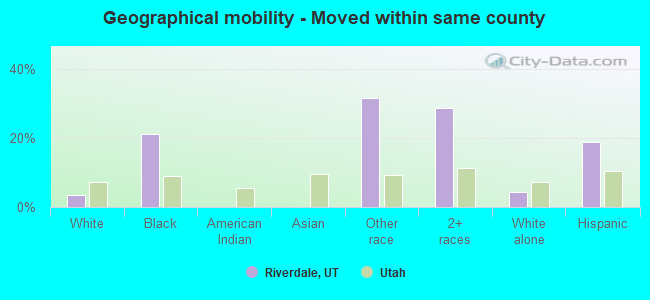
Geographical mobility - Moved within same county (%)
Geographical mobility - Moved within same county (%) - White
Geographical mobility - Moved within same county (%) - Black or African American
Geographical mobility - Moved within same county (%) - Asian
Geographical mobility - Moved within same county (%) - Hispanic or Latino
Geographical mobility - Moved within same county (%) - American Indian and Alaska Native
Geographical mobility - Moved within same county (%) - Multirace
Geographical mobility - Moved within same county (%) - Other Race
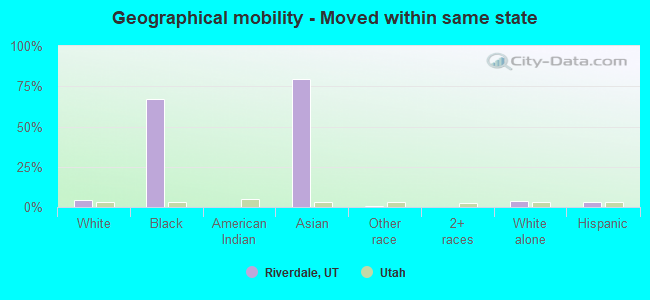
Geographical mobility - Moved from different county within same state (%)
Geographical mobility - Moved from different county within same state (%) - White
Geographical mobility - Moved from different county within same state (%) - Black or African American
Geographical mobility - Moved from different county within same state (%) - Asian
Geographical mobility - Moved from different county within same state (%) - Hispanic or Latino
Geographical mobility - Moved from different county within same state (%) - American Indian and Alaska Native
Geographical mobility - Moved from different county within same state (%) - Multirace
Geographical mobility - Moved from different county within same state (%) - Other Race
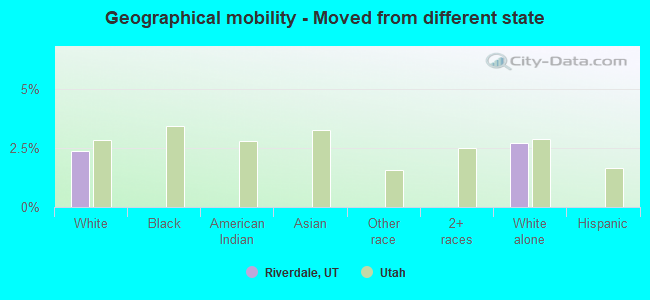
Geographical mobility - Moved from different state (%)
Geographical mobility - Moved from different state (%) - White
Geographical mobility - Moved from different state (%) - Black or African American
Geographical mobility - Moved from different state (%) - Asian
Geographical mobility - Moved from different state (%) - Hispanic or Latino
Geographical mobility - Moved from different state (%) - American Indian and Alaska Native
Geographical mobility - Moved from different state (%) - Multirace
Geographical mobility - Moved from different state (%) - Other Race
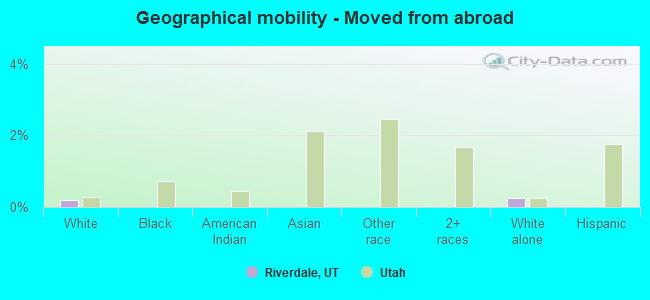
Geographical mobility - Moved from abroad (%)
Geographical mobility - Moved from abroad (%) - White
Geographical mobility - Moved from abroad (%) - Black or African American
Geographical mobility - Moved from abroad (%) - Asian
Geographical mobility - Moved from abroad (%) - Hispanic or Latino
Geographical mobility - Moved from abroad (%) - American Indian and Alaska Native
Geographical mobility - Moved from abroad (%) - Multirace
Geographical mobility - Moved from abroad (%) - Other Race
Place of birth for the foreign-born population - Ireland (%)
Place of birth for the foreign-born population - Denmark (%)
Place of birth for the foreign-born population - Norway (%)
Place of birth for the foreign-born population - Sweden (%)
Place of birth for the foreign-born population - United Kingdom (%)
Place of birth for the foreign-born population - England (%)
Place of birth for the foreign-born population - Scotland (%)
Place of birth for the foreign-born population - Other Northern Europe (%)
Place of birth for the foreign-born population - Austria (%)
Place of birth for the foreign-born population - Belgium (%)
Place of birth for the foreign-born population - France (%)
Place of birth for the foreign-born population - Germany (%)
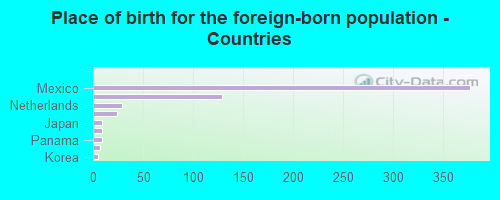
Place of birth for the foreign-born population - Netherlands (%)
Place of birth for the foreign-born population - Switzerland (%)
Place of birth for the foreign-born population - Other Western Europe (%)
Place of birth for the foreign-born population - Greece (%)
Place of birth for the foreign-born population - Italy (%)
Place of birth for the foreign-born population - Portugal (%)
Place of birth for the foreign-born population - Spain (%)
Place of birth for the foreign-born population - Other Southern Europe (%)
Place of birth for the foreign-born population - Albania (%)
Place of birth for the foreign-born population - Belarus (%)
Place of birth for the foreign-born population - Bosnia and Herzegovina (%)
Place of birth for the foreign-born population - Bulgaria (%)
Place of birth for the foreign-born population - Croatia (%)
Place of birth for the foreign-born population - Czechoslovakia (%)
Place of birth for the foreign-born population - Hungary (%)
Place of birth for the foreign-born population - Latvia (%)
Place of birth for the foreign-born population - Lithuania (%)
Place of birth for the foreign-born population - North Macedonia (Macedonia) (%)
Place of birth for the foreign-born population - Moldova (%)
Place of birth for the foreign-born population - Poland (%)
Place of birth for the foreign-born population - Romania (%)
Place of birth for the foreign-born population - Russia (%)
Place of birth for the foreign-born population - Serbia (%)
Place of birth for the foreign-born population - Ukraine (%)
Place of birth for the foreign-born population - Other Eastern Europe (%)
Place of birth for the foreign-born population - China (%)
Place of birth for the foreign-born population - Hong Kong (%)
Place of birth for the foreign-born population - Taiwan (%)
Place of birth for the foreign-born population - Japan (%)
Place of birth for the foreign-born population - Korea (%)
Place of birth for the foreign-born population - Other Eastern Asia (%)
Place of birth for the foreign-born population - Afghanistan (%)
Place of birth for the foreign-born population - Bangladesh (%)
Place of birth for the foreign-born population - India (%)
Place of birth for the foreign-born population - Iran (%)
Place of birth for the foreign-born population - Kazakhstan (%)
Place of birth for the foreign-born population - Nepal (%)
Place of birth for the foreign-born population - Pakistan (%)
Place of birth for the foreign-born population - Sri Lanka (%)
Place of birth for the foreign-born population - Uzbekistan (%)
Place of birth for the foreign-born population - Other South Central Asia (%)
Place of birth for the foreign-born population - Burma (%)
Place of birth for the foreign-born population - Cambodia (%)
Place of birth for the foreign-born population - Indonesia (%)
Place of birth for the foreign-born population - Laos (%)
Place of birth for the foreign-born population - Malaysia (%)
Place of birth for the foreign-born population - Philippines (%)
Place of birth for the foreign-born population - Singapore (%)
Place of birth for the foreign-born population - Thailand (%)
Place of birth for the foreign-born population - Vietnam (%)
Place of birth for the foreign-born population - Other South Eastern Asia (%)
Place of birth for the foreign-born population - Armenia (%)
Place of birth for the foreign-born population - Iraq (%)
Place of birth for the foreign-born population - Israel (%)
Place of birth for the foreign-born population - Jordan (%)
Place of birth for the foreign-born population - Kuwait (%)
Place of birth for the foreign-born population - Lebanon (%)
Place of birth for the foreign-born population - Saudi Arabia (%)
Place of birth for the foreign-born population - Syria (%)
Place of birth for the foreign-born population - Turkey (%)
Place of birth for the foreign-born population - Yemen (%)
Place of birth for the foreign-born population - Other Western Asia (%)
Place of birth for the foreign-born population - Eritrea (%)
Place of birth for the foreign-born population - Ethiopia (%)
Place of birth for the foreign-born population - Kenya (%)
Place of birth for the foreign-born population - Somalia (%)
Place of birth for the foreign-born population - Uganda (%)
Place of birth for the foreign-born population - Zimbabwe (%)
Place of birth for the foreign-born population - Other Eastern Africa (%)
Place of birth for the foreign-born population - Cameroon (%)
Place of birth for the foreign-born population - Congo (%)
Place of birth for the foreign-born population - Democratic Republic of Congo (Zaire) (%)
Place of birth for the foreign-born population - Other Middle Africa (%)
Place of birth for the foreign-born population - Egypt (%)
Place of birth for the foreign-born population - Morocco (%)
Place of birth for the foreign-born population - Sudan (%)
Place of birth for the foreign-born population - Other Northern Africa (%)
Place of birth for the foreign-born population - South Africa (%)
Place of birth for the foreign-born population - Other Southern Africa (%)
Place of birth for the foreign-born population - Cabo Verde (%)
Place of birth for the foreign-born population - Ghana (%)
Place of birth for the foreign-born population - Liberia (%)
Place of birth for the foreign-born population - Nigeria (%)
Place of birth for the foreign-born population - Senegal (%)
Place of birth for the foreign-born population - Sierra Leone (%)
Place of birth for the foreign-born population - Other Western Africa (%)
Place of birth for the foreign-born population - Australia (%)
Place of birth for the foreign-born population - New Zealand (%)
Place of birth for the foreign-born population - Fiji (%)
Place of birth for the foreign-born population - Micronesia (%)
Place of birth for the foreign-born population - Bahamas (%)
Place of birth for the foreign-born population - Barbados (%)
Place of birth for the foreign-born population - Cuba (%)
Place of birth for the foreign-born population - Dominica (%)
Place of birth for the foreign-born population - Dominican Republic (%)
Place of birth for the foreign-born population - Grenada (%)
Place of birth for the foreign-born population - Haiti (%)
Place of birth for the foreign-born population - Jamaica (%)
Place of birth for the foreign-born population - St. Vincent and the Grenadines (%)
Place of birth for the foreign-born population - Trinidad and Tobago (%)
Place of birth for the foreign-born population - West Indies (%)
Place of birth for the foreign-born population - Other Caribbean (%)
Place of birth for the foreign-born population - Belize (%)
Place of birth for the foreign-born population - Costa Rica (%)
Place of birth for the foreign-born population - El Salvador (%)
Place of birth for the foreign-born population - Guatemala (%)
Place of birth for the foreign-born population - Honduras (%)
Place of birth for the foreign-born population - Mexico (%)
Place of birth for the foreign-born population - Nicaragua (%)
Place of birth for the foreign-born population - Panama (%)
Place of birth for the foreign-born population - Other Central America (%)
Place of birth for the foreign-born population - Argentina (%)
Place of birth for the foreign-born population - Bolivia (%)
Place of birth for the foreign-born population - Brazil (%)
Place of birth for the foreign-born population - Chile (%)
Place of birth for the foreign-born population - Colombia (%)
Place of birth for the foreign-born population - Ecuador (%)
Place of birth for the foreign-born population - Guyana (%)
Place of birth for the foreign-born population - Peru (%)
Place of birth for the foreign-born population - Uruguay (%)
Place of birth for the foreign-born population - Venezuela (%)
Place of birth for the foreign-born population - Other South America (%)
Place of birth for the foreign-born population - Canada (%)
Place of birth for the foreign-born population - Other Northern America (%)
Place of birth for the foreign-born population - Other (%)
Latest news about races in Riverdale, UT collected exclusively by city-data.com from local newspapers, TV, and radio stations
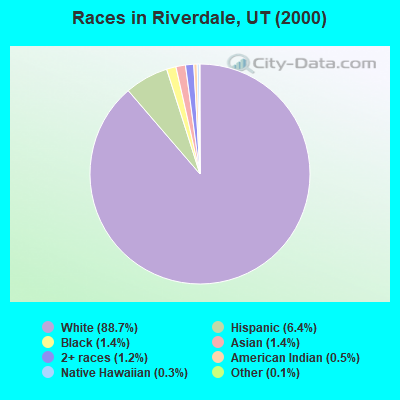
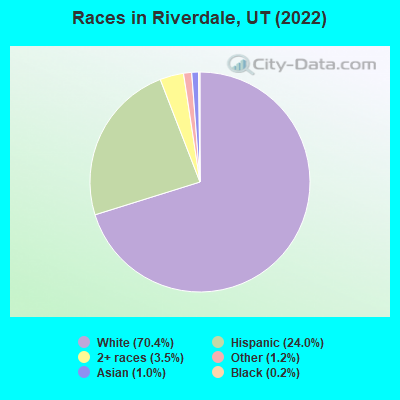
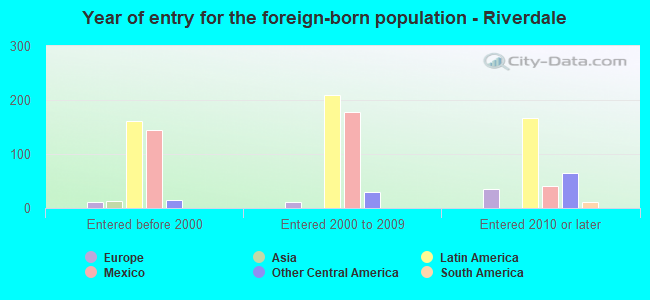
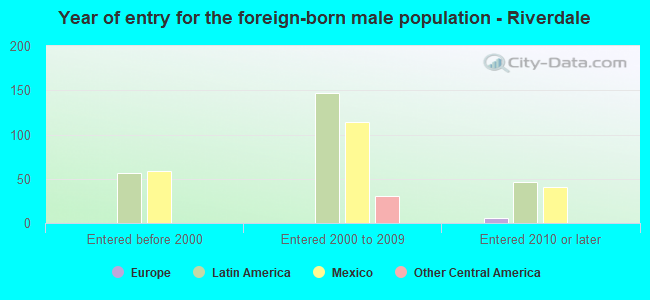
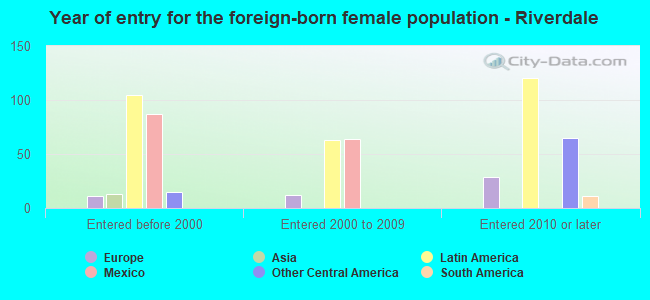
According to 2022 data, the most numerous races in Riverdale, UT are White alone (6,722 residents), Hispanic (2,291 residents), and Two or more races (330 residents). 81.5% of Riverdale residents speak English at home. 6.3% of Riverdale, UT residents are foreign-born (5.4% born in Latin America), which is 27.1% less than the foreign-born rate of 8.0% across the entire state of Utah.
Race distribution in Riverdale
2000 2022
1,904,265 85.3% White alone 201,559 9.0% Hispanic 36,483 1.6% Asian alone 31,308 1.4% Two or more races 26,663 1.2% American Indian alone 14,806 0.7% Native Hawaiian and Other 16,137 0.7% Black alone 1,948 0.09% Other race alone
2,557,466 75.6% White alone 512,086 15.1% Hispanic 119,308 3.5% Two or more races 82,388 2.4% Asian alone 36,978 1.1% Native Hawaiian and Other 34,873 1.0% Black alone 22,803 0.7% American Indian alone 14,898 0.4% Other race alone
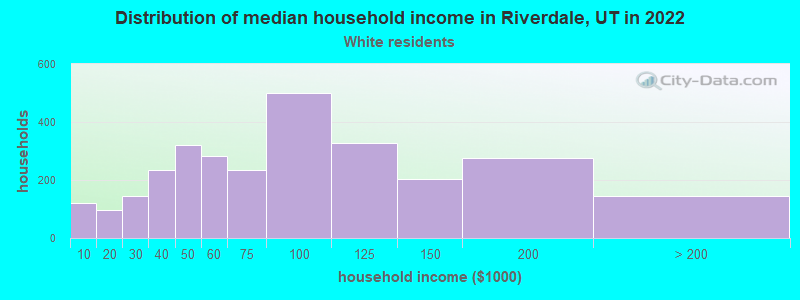
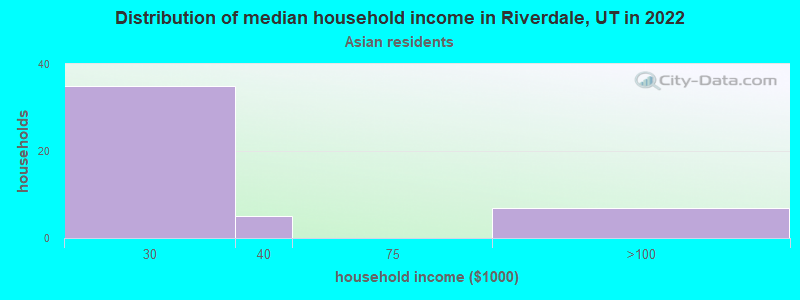
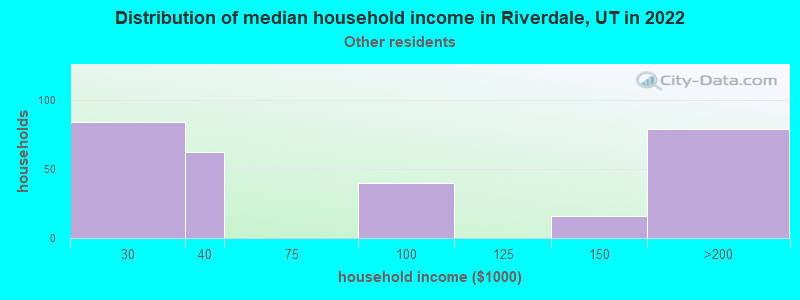
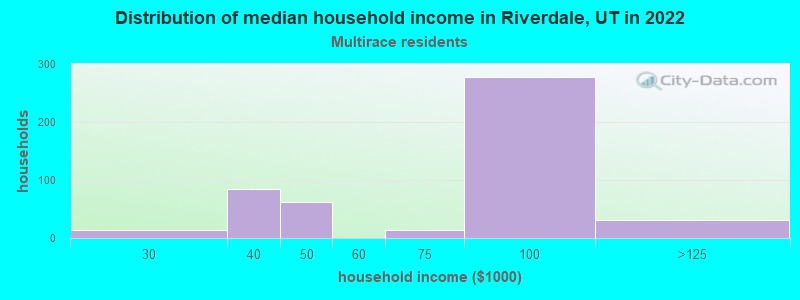
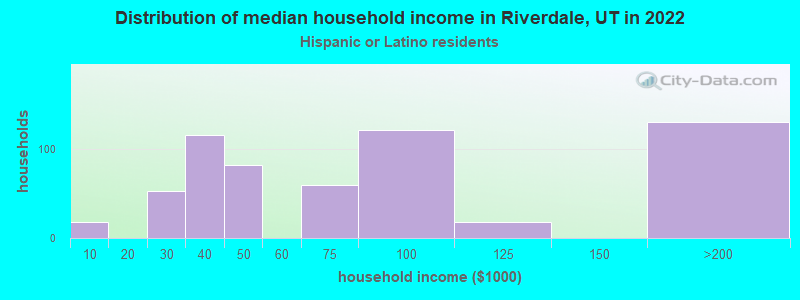
Income and house value in Riverdale Median household income in 2022 $75,396 White non-Hispanic householders$20,016 Asian householders$86,703 Two or more races householdersMedian 2022 house value $431,368 White Non-Hispanic householders$413,645 Black or African American householders$514,287 American Indian or Alaska Native householders $345,601 Asian householders$444,977 Some other race householders$389,592 Two or more races householders$497,197 Hispanic or Latino householders
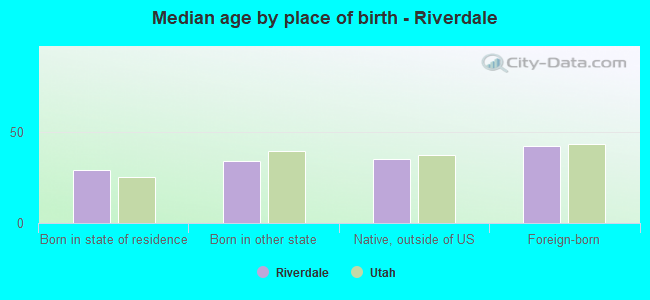
Median age by race in Riverdale
34.6 Median age for White residents36.6 32.9 29.2 Median age for Black or African American residents-682,839,172.7 -745,098,038.5 28.0 Median age for American Indian / Alaska Native residents49.8 -688,311,687.6 27.6 Median age for Asian residents-660,173,159.5 13.3 -1,217,647,057.6 Median age for Native Hawaiian / Pacific Islander residents-1,563,046,190.7 -664,285,713.6 27.1 Median age for Other race residents25.4 32.4 24.8 Median age for Two or more races residents12.3 28.0 37.1 Median age for White alone residents38.1 36.4 21.1 Median age for Hispanic or Latino residents14.5 22.1
Owner/renter occupied households by race in Riverdale
House owners and renters - White residents 2,068 70.9% Owner occupied850 29.1% Renter occupiedHouse owners and renters - Black or African American residents 7 100.0% Renter occupiedHouse owners and renters - American Indian / Alaska Native residents 23 100.0% Owner occupiedHouse owners and renters - Asian residents 13 33.4% Owner occupied26 66.6% Renter occupiedHouse owners and renters - Other race residents 113 52.4% Owner occupied103 47.6% Renter occupiedHouse owners and renters - Two or more races residents 409 86.3% Owner occupied65 13.7% Renter occupiedHouse owners and renters - White alone residents 2,034 72.6% Owner occupied769 27.4% Renter occupiedHouse owners and renters - Hispanic or Latino residents 322 55.9% Owner occupied253 44.1% Renter occupied
Language usage in Riverdale
English speakers - Total 81.5% of residents of Riverdale speak English at home.
16.6% of residents speak Spanish at home 1,225 84.8% Speak English very well219 15.2% Speak English less than very well1.4% of residents speak other language at home 115 92.7% Speak English very well9 7.3% Speak English less than very well
English speakers - Born in the United States 92.0% of residents of Riverdale speak English at home.
7.1% of residents speak Spanish at home 186 100.0% Speak English very well
English speakers - Native, born elsewhere 69.0% of residents of Riverdale speak English at home.
29.3% of residents speak Spanish at home 11 32.4% Speak English very well23 67.6% Speak English less than very well
English speakers - Foreign-born 2.4% of residents of Riverdale speak English at home.
88.0% of residents speak Spanish at home 361 69.2% Speak English very well161 30.8% Speak English less than very well7.9% of residents speak other language at home 47 100.0% Speak English very well
White (Caucasian) - Speak only English Native:
92.6% (6,215)Foreign-born:
8.6% (15)
White (Caucasian) - Speak another language Native:
7.3% (488)Foreign-born:
84.9% (149)
Asian - Speak another language Native:
55.2% (31)Foreign-born:
97.5% (17)
Other race - Speak another language Native:
29.3% (123)Foreign-born:
99.0% (154)
Two or more races - Speak another language Native:
48.3% (444)Foreign-born:
100.0% (298)
White alone - Speak only English Native:
96.1% (6,017)Foreign-born:
34.9% (18)
White alone - Speak another language Native:
3.7% (233)Foreign-born:
48.9% (25)
Hispanic or Latino - Speak another language Native:
57.6% (746)Foreign-born:
100.0% (511)
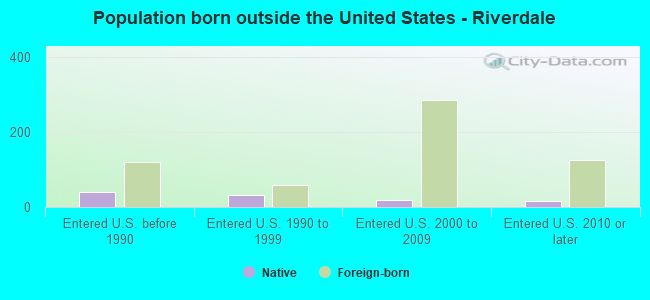
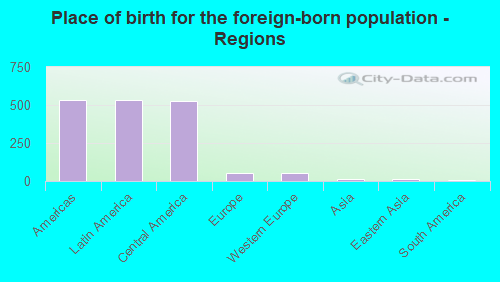
Foreign-born residents in Riverdale 601 residents are foreign born (5.4% Latin America ).
Marital status for residents in Riverdale Marital status - White (Caucasian) population 15 years and over
Males 29.0% Never married58.6% Now married1.4% Separated2.9% Widowed8.1% DivorcedFemales 25.4% Never married53.0% Now married0.0% Separated7.3% Widowed14.3% DivorcedWomen who gave birth in the past 12 months Now married:
62.1% (41)Unmarried:
37.9% (25)
Women who did not give birth in the past 12 months Now married:
55.3% (1,061)Unmarried:
44.7% (859)
Marital status - Black or African American population 15 years and over
Males 62.5% Never married37.5% Now married0.0% Separated0.0% Widowed0.0% DivorcedFemales 0.0% Never married0.0% Now married100.0% Separated0.0% Widowed0.0% DivorcedMarital status - American Indian / Alaska Native population 15 years and over
Males 60.0% Never married0.0% Now married0.0% Separated0.0% Widowed40.0% DivorcedFemales 100.0% Never married0.0% Now married0.0% Separated0.0% Widowed0.0% DivorcedWomen who did not give birth in the past 12 months Now married:
0.0% (0)Unmarried:
100.0% (8)
Marital status - Asian population 15 years and over
Males 77.8% Never married22.2% Now married0.0% Separated0.0% Widowed0.0% DivorcedFemales 0.0% Never married0.0% Now married0.0% Separated64.3% Widowed35.7% DivorcedMarital status - Other race population 15 years and over
Males 14.2% Never married65.0% Now married20.8% Separated0.0% Widowed0.0% DivorcedFemales 23.2% Never married34.8% Now married0.0% Separated19.7% Widowed22.3% DivorcedWomen who gave birth in the past 12 months Now married:
19.6% (10)Unmarried:
80.4% (40)
Women who did not give birth in the past 12 months Now married:
39.5% (49)Unmarried:
60.5% (75)
Marital status - Two or more races population 15 years and over
Males 30.4% Never married69.6% Now married0.0% Separated0.0% Widowed0.0% DivorcedFemales 32.3% Never married48.6% Now married0.0% Separated0.0% Widowed19.1% DivorcedWomen who did not give birth in the past 12 months Now married:
45.2% (123)Unmarried:
54.8% (150)
Marital status - White alone, not Hispanic / Latino population 15 years and over
Males 29.5% Never married57.3% Now married1.5% Separated3.1% Widowed8.6% DivorcedFemales 23.6% Never married52.7% Now married0.0% Separated8.0% Widowed15.7% DivorcedWomen who gave birth in the past 12 months Now married:
62.1% (42)Unmarried:
37.9% (26)
Women who did not give birth in the past 12 months Now married:
55.6% (930)Unmarried:
44.4% (743)
Marital status - Hispanic or Latino population 15 years and over
Males 7.3% Never married84.1% Now married7.5% Separated0.0% Widowed1.2% DivorcedFemales 36.7% Never married45.8% Now married0.0% Separated5.0% Widowed12.5% DivorcedWomen who gave birth in the past 12 months Now married:
19.6% (9)Unmarried:
80.4% (39)
Women who did not give birth in the past 12 months Now married:
46.9% (271)Unmarried:
53.1% (307)
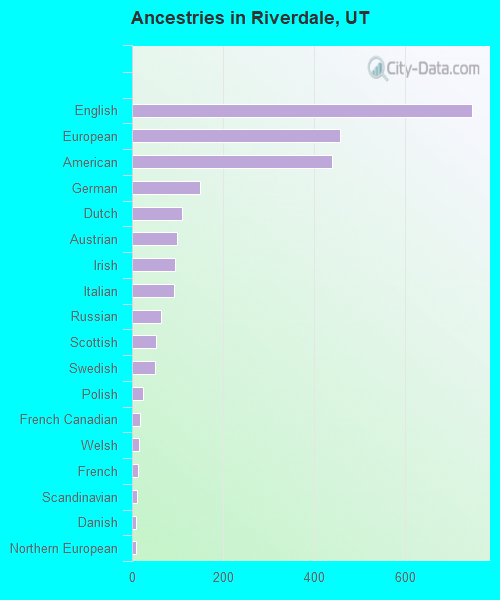
Ancestries in Riverdale
746 17.0% English457 10.4% European438 10.0% American150 3.4% German110 2.5% Dutch98 2.2% Austrian95 2.2% Irish92 2.1% Italian64 1.5% Russian53 1.2% Scottish51 1.2% Swedish24 0.5% Polish17 0.4% French Canadian16 0.4% Welsh13 0.3% French10 0.2% Scandinavian8 0.2% Danish8 0.2% Northern European3 0.07% Norwegian
Children Nativity (place of birth) in Riverdale
Children under 6 years - Living with two parents Both parents native 580 100.0% NativeBoth parents foreign-born 119 100.0% NativeOne native, one foreign-born parent 58 100.0% NativeChildren under 6 years - Living with one parent Native parent 241 100.0% Native
Children 6 to 17 years - Living with two parents Both parents native 1,089 100.0% NativeBoth parents foreign-born 200 96.5% Native7 3.5% Foreign-bornOne native, one foreign-born parent 35 100.0% Foreign-bornChildren 6 to 17 years - Living with one parent Native parent 278 100.0% Native
Grandparents responsible for own grandchildren in Riverdale
Grandparents (30 to 59 years) White / Caucasian 8 100.0% Not responsible for grandchildrenWhite alone, not Hispanic / Latino 8 100.0% Not responsible for grandchildrenGrandparents (60 years and over) White / Caucasian 14 53.5% Responsible for grandchildren12 46.5% Not responsible for grandchildrenWhite alone, not Hispanic / Latino 15 51.0% Responsible for grandchildren14 49.0% Not responsible for grandchildren