Races in Riverside, Ohio (OH) Detailed Stats
Data:
Races - White alone (%)
Races - White alone (% change since 2000)
Races - Black alone (%)
Races - Black alone (% change since 2000)
Races - American Indian alone (%)
Races - American Indian alone (% change since 2000)
Races - Asian alone (%)
Races - Asian alone (% change since 2000)
Races - Hispanic (%)
Races - Hispanic (% change since 2000)
Races - Native Hawaiian and Other Pacific Islander alone (%)
Races - Native Hawaiian and Other Pacific Islander alone (% change since 2000)
Races - Two or more races(%)
Races - Two or more races(% change since 2000)
Races - Other race alone (%)
Races - Other race alone (% change since 2000)
Racial diversity
Place of birth - Born in state of residence (%)
Place of birth - Born in state of residence (%) - White
Place of birth - Born in state of residence (%) - Black or African American
Place of birth - Born in state of residence (%) - Asian
Place of birth - Born in state of residence (%) - Hispanic or Latino
Place of birth - Born in state of residence (%) - American Indian and Alaska Native
Place of birth - Born in state of residence (%) - Multirace
Place of birth - Born in state of residence (%) - Other Race
Place of birth - Born in other state (%)
Place of birth - Born in other state (%) - White
Place of birth - Born in other state (%) - Black or African American
Place of birth - Born in other state (%) - Asian
Place of birth - Born in other state (%) - Hispanic or Latino
Place of birth - Born in other state (%) - American Indian and Alaska Native
Place of birth - Born in other state (%) - Multirace
Place of birth - Born in other state (%) - Other Race
Place of birth - Native, outside of US (%)
Place of birth - Native, outside of US (%) - White
Place of birth - Native, outside of US (%) - Black or African American
Place of birth - Native, outside of US (%) - Asian
Place of birth - Native, outside of US (%) - Hispanic or Latino
Place of birth - Native, outside of US (%) - American Indian and Alaska Native
Place of birth - Native, outside of US (%) - Multirace
Place of birth - Native, outside of US (%) - Other Race
Place of birth - Foreign born (%)
Place of birth - Foreign born (%) - White
Place of birth - Foreign born (%) - Black or African American
Place of birth - Foreign born (%) - Asian
Place of birth - Foreign born (%) - Hispanic or Latino
Place of birth - Foreign born (%) - American Indian and Alaska Native
Place of birth - Foreign born (%) - Multirace
Place of birth - Foreign born (%) - Other Race
Residents speaking English at home (%)
Residents speaking English at home - Born in the United States (%)
Residents speaking English at home - Native, born elsewhere (%)
Residents speaking English at home - Foreign born (%)
Residents speaking Spanish at home (%)
Residents speaking Spanish at home - Born in the United States (%)
Residents speaking Spanish at home - Native, born elsewhere (%)
Residents speaking Spanish at home - Foreign born (%)
Residents speaking other language at home (%)
Residents speaking other language at home - Born in the United States (%)
Residents speaking other language at home - Native, born elsewhere (%)
Residents speaking other language at home - Foreign born (%)
Marital status - Never married (%)
Marital status - Now married (%)
Marital status - Separated (%)
Marital status - Widowed (%)
Marital status - Divorced (%)
Ancestries Reported - Arab (%)
Ancestries Reported - Czech (%)
Ancestries Reported - Danish (%)
Ancestries Reported - Dutch (%)
Ancestries Reported - English (%)
Ancestries Reported - French (%)
Ancestries Reported - French Canadian (%)
Ancestries Reported - German (%)
Ancestries Reported - Greek (%)
Ancestries Reported - Hungarian (%)
Ancestries Reported - Irish (%)
Ancestries Reported - Italian (%)
Ancestries Reported - Lithuanian (%)
Ancestries Reported - Norwegian (%)
Ancestries Reported - Polish (%)
Ancestries Reported - Portuguese (%)
Ancestries Reported - Russian (%)
Ancestries Reported - Scotch-Irish (%)
Ancestries Reported - Scottish (%)
Ancestries Reported - Slovak (%)
Ancestries Reported - Subsaharan African (%)
Ancestries Reported - Swedish (%)
Ancestries Reported - Swiss (%)
Ancestries Reported - Ukrainian (%)
Ancestries Reported - United States (%)
Ancestries Reported - Welsh (%)
Ancestries Reported - West Indian (%)
Ancestries Reported - Other (%)
Geographical mobility - Same house 1 year ago (%)
Geographical mobility - Same house 1 year ago (%) - White
Geographical mobility - Same house 1 year ago (%) - Black or African American
Geographical mobility - Same house 1 year ago (%) - Asian
Geographical mobility - Same house 1 year ago (%) - Hispanic or Latino
Geographical mobility - Same house 1 year ago (%) - American Indian and Alaska Native
Geographical mobility - Same house 1 year ago (%) - Multirace
Geographical mobility - Same house 1 year ago (%) - Other Race
Geographical mobility - Moved within same county (%)
Geographical mobility - Moved within same county (%) - White
Geographical mobility - Moved within same county (%) - Black or African American
Geographical mobility - Moved within same county (%) - Asian
Geographical mobility - Moved within same county (%) - Hispanic or Latino
Geographical mobility - Moved within same county (%) - American Indian and Alaska Native
Geographical mobility - Moved within same county (%) - Multirace
Geographical mobility - Moved within same county (%) - Other Race
Geographical mobility - Moved from different county within same state (%)
Geographical mobility - Moved from different county within same state (%) - White
Geographical mobility - Moved from different county within same state (%) - Black or African American
Geographical mobility - Moved from different county within same state (%) - Asian
Geographical mobility - Moved from different county within same state (%) - Hispanic or Latino
Geographical mobility - Moved from different county within same state (%) - American Indian and Alaska Native
Geographical mobility - Moved from different county within same state (%) - Multirace
Geographical mobility - Moved from different county within same state (%) - Other Race
Geographical mobility - Moved from different state (%)
Geographical mobility - Moved from different state (%) - White
Geographical mobility - Moved from different state (%) - Black or African American
Geographical mobility - Moved from different state (%) - Asian
Geographical mobility - Moved from different state (%) - Hispanic or Latino
Geographical mobility - Moved from different state (%) - American Indian and Alaska Native
Geographical mobility - Moved from different state (%) - Multirace
Geographical mobility - Moved from different state (%) - Other Race
Geographical mobility - Moved from abroad (%)
Geographical mobility - Moved from abroad (%) - White
Geographical mobility - Moved from abroad (%) - Black or African American
Geographical mobility - Moved from abroad (%) - Asian
Geographical mobility - Moved from abroad (%) - Hispanic or Latino
Geographical mobility - Moved from abroad (%) - American Indian and Alaska Native
Geographical mobility - Moved from abroad (%) - Multirace
Geographical mobility - Moved from abroad (%) - Other Race
Place of birth for the foreign-born population - Ireland (%)
Place of birth for the foreign-born population - Denmark (%)
Place of birth for the foreign-born population - Norway (%)
Place of birth for the foreign-born population - Sweden (%)
Place of birth for the foreign-born population - United Kingdom (%)
Place of birth for the foreign-born population - England (%)
Place of birth for the foreign-born population - Scotland (%)
Place of birth for the foreign-born population - Other Northern Europe (%)
Place of birth for the foreign-born population - Austria (%)
Place of birth for the foreign-born population - Belgium (%)
Place of birth for the foreign-born population - France (%)
Place of birth for the foreign-born population - Germany (%)
Place of birth for the foreign-born population - Netherlands (%)
Place of birth for the foreign-born population - Switzerland (%)
Place of birth for the foreign-born population - Other Western Europe (%)
Place of birth for the foreign-born population - Greece (%)
Place of birth for the foreign-born population - Italy (%)
Place of birth for the foreign-born population - Portugal (%)
Place of birth for the foreign-born population - Spain (%)
Place of birth for the foreign-born population - Other Southern Europe (%)
Place of birth for the foreign-born population - Albania (%)
Place of birth for the foreign-born population - Belarus (%)
Place of birth for the foreign-born population - Bosnia and Herzegovina (%)
Place of birth for the foreign-born population - Bulgaria (%)
Place of birth for the foreign-born population - Croatia (%)
Place of birth for the foreign-born population - Czechoslovakia (%)
Place of birth for the foreign-born population - Hungary (%)
Place of birth for the foreign-born population - Latvia (%)
Place of birth for the foreign-born population - Lithuania (%)
Place of birth for the foreign-born population - North Macedonia (Macedonia) (%)
Place of birth for the foreign-born population - Moldova (%)
Place of birth for the foreign-born population - Poland (%)
Place of birth for the foreign-born population - Romania (%)
Place of birth for the foreign-born population - Russia (%)
Place of birth for the foreign-born population - Serbia (%)
Place of birth for the foreign-born population - Ukraine (%)
Place of birth for the foreign-born population - Other Eastern Europe (%)
Place of birth for the foreign-born population - China (%)
Place of birth for the foreign-born population - Hong Kong (%)
Place of birth for the foreign-born population - Taiwan (%)
Place of birth for the foreign-born population - Japan (%)
Place of birth for the foreign-born population - Korea (%)
Place of birth for the foreign-born population - Other Eastern Asia (%)
Place of birth for the foreign-born population - Afghanistan (%)
Place of birth for the foreign-born population - Bangladesh (%)
Place of birth for the foreign-born population - India (%)
Place of birth for the foreign-born population - Iran (%)
Place of birth for the foreign-born population - Kazakhstan (%)
Place of birth for the foreign-born population - Nepal (%)
Place of birth for the foreign-born population - Pakistan (%)
Place of birth for the foreign-born population - Sri Lanka (%)
Place of birth for the foreign-born population - Uzbekistan (%)
Place of birth for the foreign-born population - Other South Central Asia (%)
Place of birth for the foreign-born population - Burma (%)
Place of birth for the foreign-born population - Cambodia (%)
Place of birth for the foreign-born population - Indonesia (%)
Place of birth for the foreign-born population - Laos (%)
Place of birth for the foreign-born population - Malaysia (%)
Place of birth for the foreign-born population - Philippines (%)
Place of birth for the foreign-born population - Singapore (%)
Place of birth for the foreign-born population - Thailand (%)
Place of birth for the foreign-born population - Vietnam (%)
Place of birth for the foreign-born population - Other South Eastern Asia (%)
Place of birth for the foreign-born population - Armenia (%)
Place of birth for the foreign-born population - Iraq (%)
Place of birth for the foreign-born population - Israel (%)
Place of birth for the foreign-born population - Jordan (%)
Place of birth for the foreign-born population - Kuwait (%)
Place of birth for the foreign-born population - Lebanon (%)
Place of birth for the foreign-born population - Saudi Arabia (%)
Place of birth for the foreign-born population - Syria (%)
Place of birth for the foreign-born population - Turkey (%)
Place of birth for the foreign-born population - Yemen (%)
Place of birth for the foreign-born population - Other Western Asia (%)
Place of birth for the foreign-born population - Eritrea (%)
Place of birth for the foreign-born population - Ethiopia (%)
Place of birth for the foreign-born population - Kenya (%)
Place of birth for the foreign-born population - Somalia (%)
Place of birth for the foreign-born population - Uganda (%)
Place of birth for the foreign-born population - Zimbabwe (%)
Place of birth for the foreign-born population - Other Eastern Africa (%)
Place of birth for the foreign-born population - Cameroon (%)
Place of birth for the foreign-born population - Congo (%)
Place of birth for the foreign-born population - Democratic Republic of Congo (Zaire) (%)
Place of birth for the foreign-born population - Other Middle Africa (%)
Place of birth for the foreign-born population - Egypt (%)
Place of birth for the foreign-born population - Morocco (%)
Place of birth for the foreign-born population - Sudan (%)
Place of birth for the foreign-born population - Other Northern Africa (%)
Place of birth for the foreign-born population - South Africa (%)
Place of birth for the foreign-born population - Other Southern Africa (%)
Place of birth for the foreign-born population - Cabo Verde (%)
Place of birth for the foreign-born population - Ghana (%)
Place of birth for the foreign-born population - Liberia (%)
Place of birth for the foreign-born population - Nigeria (%)
Place of birth for the foreign-born population - Senegal (%)
Place of birth for the foreign-born population - Sierra Leone (%)
Place of birth for the foreign-born population - Other Western Africa (%)
Place of birth for the foreign-born population - Australia (%)
Place of birth for the foreign-born population - New Zealand (%)
Place of birth for the foreign-born population - Fiji (%)
Place of birth for the foreign-born population - Micronesia (%)
Place of birth for the foreign-born population - Bahamas (%)
Place of birth for the foreign-born population - Barbados (%)
Place of birth for the foreign-born population - Cuba (%)
Place of birth for the foreign-born population - Dominica (%)
Place of birth for the foreign-born population - Dominican Republic (%)
Place of birth for the foreign-born population - Grenada (%)
Place of birth for the foreign-born population - Haiti (%)
Place of birth for the foreign-born population - Jamaica (%)
Place of birth for the foreign-born population - St. Vincent and the Grenadines (%)
Place of birth for the foreign-born population - Trinidad and Tobago (%)
Place of birth for the foreign-born population - West Indies (%)
Place of birth for the foreign-born population - Other Caribbean (%)
Place of birth for the foreign-born population - Belize (%)
Place of birth for the foreign-born population - Costa Rica (%)
Place of birth for the foreign-born population - El Salvador (%)
Place of birth for the foreign-born population - Guatemala (%)
Place of birth for the foreign-born population - Honduras (%)
Place of birth for the foreign-born population - Mexico (%)
Place of birth for the foreign-born population - Nicaragua (%)
Place of birth for the foreign-born population - Panama (%)
Place of birth for the foreign-born population - Other Central America (%)
Place of birth for the foreign-born population - Argentina (%)
Place of birth for the foreign-born population - Bolivia (%)
Place of birth for the foreign-born population - Brazil (%)
Place of birth for the foreign-born population - Chile (%)
Place of birth for the foreign-born population - Colombia (%)
Place of birth for the foreign-born population - Ecuador (%)
Place of birth for the foreign-born population - Guyana (%)
Place of birth for the foreign-born population - Peru (%)
Place of birth for the foreign-born population - Uruguay (%)
Place of birth for the foreign-born population - Venezuela (%)
Place of birth for the foreign-born population - Other South America (%)
Place of birth for the foreign-born population - Canada (%)
Place of birth for the foreign-born population - Other Northern America (%)
Place of birth for the foreign-born population - Other (%)
Latest news about races in Riverside, OH collected exclusively by city-data.com from local newspapers, TV, and radio stations
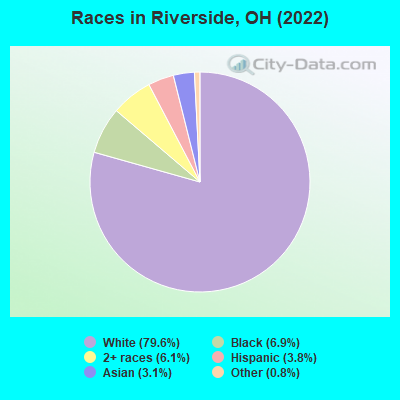
According to 2022 data, the most numerous races in Riverside, OH are White alone (19,407 residents), Black alone (1,686 residents), and Two or more races (1,499 residents). 92.7% of Riverside residents speak English at home. 5.6% of Riverside, OH residents are foreign-born (3.3% born in Asia, 0.9% born in Latin America, 0.6% born in Europe), which is 28.2% greater than the foreign-born rate of 4.0% across the entire state of Ohio.
Race distribution in Riverside
2000 2022
9,538,111 84.0% White alone 1,290,662 11.4% Black alone 217,123 1.9% Hispanic 137,770 1.2% Two or more races 131,670 1.2% Asian alone 21,985 0.2% American Indian alone 13,483 0.1% Other race alone 2,336 0.02% Native Hawaiian and Other
8,948,793 76.1% White alone 1,401,403 11.9% Black alone 529,291 4.5% Two or more races 517,232 4.4% Hispanic 293,387 2.5% Asian alone 52,805 0.4% Other race alone 9,785 0.08% American Indian alone 3,362 0.03% Native Hawaiian and Other
Income and house value in Riverside Median household income in 2022 $58,085 White non-Hispanic householders$42,612 Black householders$79,304 Asian householders$43,143 Two or more races householders$48,588 Hispanic or Latino race householdersMedian 2022 house value $143,681 White Non-Hispanic householders$183,189 Black or African American householders$176,773 American Indian or Alaska Native householders $196,358 Asian householders$160,396 Some other race householders$160,396 Two or more races householders$165,799 Hispanic or Latino householders
Median age by race in Riverside
36.8 Median age for White residents33.4 42.3 31.4 Median age for Black or African American residents29.4 31.2 -1,349,593,494.6 Median age for American Indian / Alaska Native residents-685,185,184.5 -1,438,172,041.6 37.2 Median age for Asian residents38.5 36.2 -800,387,596.1 Median age for Native Hawaiian / Pacific Islander residents-750,242,953.6 -805,394,989.6 44.1 Median age for Other race residents19.7 38.6 16.1 Median age for Two or more races residents18.3 14.8 37.4 Median age for White alone residents33.7 42.5 27.0 Median age for Hispanic or Latino residents27.3 23.1
Owner/renter occupied households by race in Riverside
House owners and renters - White residents 5,782 61.9% Owner occupied3,553 38.1% Renter occupiedHouse owners and renters - Black or African American residents 158 18.3% Owner occupied706 81.7% Renter occupiedHouse owners and renters - Asian residents 116 43.3% Owner occupied153 56.7% Renter occupiedHouse owners and renters - Native Hawaiian / Pacific Islander residents 2 100.0% Owner occupiedHouse owners and renters - Other race residents 119 93.4% Owner occupied8 6.6% Renter occupiedHouse owners and renters - Two or more races residents 72 12.1% Owner occupied522 87.9% Renter occupiedHouse owners and renters - White alone residents 5,764 62.1% Owner occupied3,519 37.9% Renter occupiedHouse owners and renters - Hispanic or Latino residents 136 41.8% Owner occupied190 58.2% Renter occupied
Language usage in Riverside
English speakers - Total 92.7% of residents of Riverside speak English at home.
2.7% of residents speak Spanish at home 273 45.3% Speak English very well330 54.7% Speak English less than very well4.5% of residents speak other language at home 560 54.5% Speak English very well468 45.5% Speak English less than very well
English speakers - Born in the United States 98.0% of residents of Riverside speak English at home.
1.8% of residents speak Spanish at home 40 35.7% Speak English very well72 64.3% Speak English less than very well0.4% of residents speak other language at home 14 58.3% Speak English very well10 41.7% Speak English less than very well
English speakers - Native, born elsewhere 78.2% of residents of Riverside speak English at home.
26.4% of residents speak Spanish at home 83 55.3% Speak English very well67 44.7% Speak English less than very well
English speakers - Foreign-born 22.8% of residents of Riverside speak English at home.
13.5% of residents speak Spanish at home 48 27.6% Speak English very well126 72.4% Speak English less than very well61.2% of residents speak other language at home 385 48.9% Speak English very well403 51.1% Speak English less than very well
White (Caucasian) - Speak only English Native:
98.6% (17,781)Foreign-born:
33.3% (157)
White (Caucasian) - Speak another language Native:
1.3% (236)Foreign-born:
66.7% (314)
Black or African American - Speak only English Native:
97.7% (1,346)Foreign-born:
32.3% (30)
Black or African American - Speak another language Native:
2.3% (31)Foreign-born:
61.1% (57)
Asian - Speak only English Native:
31.1% (42)Foreign-born:
10.2% (61)
Asian - Speak another language Native:
74.0% (100)Foreign-born:
90.6% (545)
Other race - Speak another language Native:
40.2% (165)Foreign-born:
100.0% (75)
Two or more races - Speak only English Native:
89.6% (1,305)Foreign-born:
63.6% (37)
Two or more races - Speak another language Native:
9.7% (141)Foreign-born:
14.2% (8)
White alone - Speak only English Native:
98.9% (17,701)Foreign-born:
41.3% (155)
White alone - Speak another language Native:
0.9% (153)Foreign-born:
57.4% (216)
Hispanic or Latino - Speak only English Native:
48.2% (305)Foreign-born:
17.0% (42)
Hispanic or Latino - Speak another language Native:
53.9% (342)Foreign-born:
83.7% (206)
Foreign-born residents in Riverside 1,359 residents are foreign born (3.3% Asia , 0.9% Latin America , 0.6% Europe ).
Marital status for residents in Riverside Marital status - White (Caucasian) population 15 years and over
Males 42.9% Never married45.1% Now married2.0% Separated2.7% Widowed7.3% DivorcedFemales 30.5% Never married42.2% Now married1.1% Separated8.5% Widowed17.7% DivorcedWomen who gave birth in the past 12 months Now married:
58.7% (107)Unmarried:
41.3% (75)
Women who did not give birth in the past 12 months Now married:
38.7% (1,562)Unmarried:
61.3% (2,471)
Marital status - Black or African American population 15 years and over
Males 52.0% Never married36.5% Now married4.7% Separated0.0% Widowed6.9% DivorcedFemales 74.3% Never married13.3% Now married0.0% Separated7.4% Widowed5.0% DivorcedWomen who gave birth in the past 12 months Now married:
100.0% (22)Unmarried:
0.0% (0)
Women who did not give birth in the past 12 months Now married:
4.3% (20)Unmarried:
95.7% (446)
Marital status - Asian population 15 years and over
Males 31.9% Never married55.6% Now married0.0% Separated12.6% Widowed0.0% DivorcedFemales 18.9% Never married65.1% Now married3.0% Separated3.2% Widowed9.9% DivorcedWomen who gave birth in the past 12 months Now married:
100.0% (29)Unmarried:
0.0% (0)
Women who did not give birth in the past 12 months Now married:
55.9% (104)Unmarried:
44.1% (82)
Marital status - Other race population 15 years and over
Males 22.3% Never married77.7% Now married0.0% Separated0.0% Widowed0.0% DivorcedFemales 37.6% Never married44.1% Now married0.0% Separated0.0% Widowed18.3% DivorcedWomen who gave birth in the past 12 months Now married:
0.0% (0)Unmarried:
100.0% (15)
Women who did not give birth in the past 12 months Now married:
52.1% (116)Unmarried:
47.9% (107)
Marital status - Two or more races population 15 years and over
Males 32.2% Never married65.2% Now married0.0% Separated0.0% Widowed2.6% DivorcedFemales 50.1% Never married36.4% Now married1.9% Separated0.0% Widowed11.6% DivorcedWomen who did not give birth in the past 12 months Now married:
30.9% (117)Unmarried:
69.1% (261)
Marital status - White alone, not Hispanic / Latino population 15 years and over
Males 43.1% Never married44.8% Now married2.1% Separated2.7% Widowed7.3% DivorcedFemales 30.9% Never married41.5% Now married1.1% Separated8.6% Widowed17.8% DivorcedWomen who gave birth in the past 12 months Now married:
52.4% (84)Unmarried:
47.6% (76)
Women who did not give birth in the past 12 months Now married:
37.8% (1,512)Unmarried:
62.2% (2,486)
Marital status - Hispanic or Latino population 15 years and over
Males 30.0% Never married68.1% Now married0.0% Separated0.0% Widowed1.9% DivorcedFemales 13.0% Never married61.1% Now married0.0% Separated0.0% Widowed25.9% DivorcedWomen who gave birth in the past 12 months Now married:
69.4% (27)Unmarried:
30.6% (12)
Women who did not give birth in the past 12 months Now married:
75.3% (161)Unmarried:
24.7% (53)
Ancestries in Riverside
2,041 18.1% German1,271 11.3% American829 7.3% Irish769 6.8% European764 6.8% English652 5.8% Italian205 1.8% Scottish183 1.6% French178 1.6% Greek134 1.2% Polish71 0.6% Haitian70 0.6% Scotch-Irish58 0.5% Eastern European56 0.5% Dutch49 0.4% British39 0.3% African34 0.3% Iraqi30 0.3% Hungarian27 0.2% French Canadian27 0.2% Scandinavian19 0.2% Belgian18 0.2% Jamaican17 0.2% Celtic17 0.2% Norwegian15 0.1% Nigerian15 0.1% Welsh11 0.10% Arab11 0.10% Swedish10 0.09% Lebanese10 0.09% Canadian9 0.08% Lithuanian7 0.06% Danish
Children Nativity (place of birth) in Riverside
Children under 6 years - Living with two parents Both parents native 855 100.0% NativeBoth parents foreign-born 54 100.0% NativeOne native, one foreign-born parent 116 100.0% NativeChildren under 6 years - Living with one parent Native parent 882 100.0% NativeChildren 6 to 17 years - Living with two parents Both parents native 1,702 99.9% Native1 0.1% Foreign-bornBoth parents foreign-born 60 44.1% Native76 55.9% Foreign-bornOne native, one foreign-born parent 94 100.0% NativeChildren 6 to 17 years - Living with one parent Native parent 1,089 99.3% Native7 0.7% Foreign-bornForeign-born parent 35 49.6% Native36 50.4% Foreign-born
Grandparents responsible for own grandchildren in Riverside
Grandparents (30 to 59 years) White / Caucasian 72 53.4% Responsible for grandchildren63 46.6% Not responsible for grandchildrenTwo or more races 64 100.0% Not responsible for grandchildrenWhite alone, not Hispanic / Latino 72 53.1% Responsible for grandchildren63 46.9% Not responsible for grandchildrenGrandparents (60 years and over) White / Caucasian 75 46.9% Responsible for grandchildren84 53.1% Not responsible for grandchildrenTwo or more races 28 100.0% Not responsible for grandchildrenWhite alone, not Hispanic / Latino 75 52.5% Responsible for grandchildren67 47.5% Not responsible for grandchildren