Races in Roanoke Rapids, North Carolina (NC) Detailed Stats
Data:
Races - White alone (%)
Races - White alone (% change since 2000)
Races - Black alone (%)
Races - Black alone (% change since 2000)
Races - American Indian alone (%)
Races - American Indian alone (% change since 2000)
Races - Asian alone (%)
Races - Asian alone (% change since 2000)
Races - Hispanic (%)
Races - Hispanic (% change since 2000)
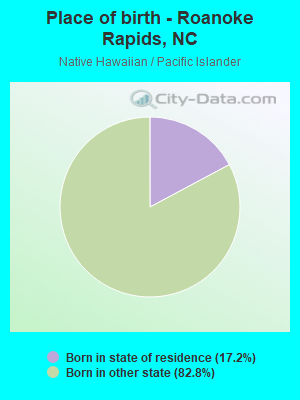
Races - Native Hawaiian and Other Pacific Islander alone (%)
Races - Native Hawaiian and Other Pacific Islander alone (% change since 2000)
Races - Two or more races(%)
Races - Two or more races(% change since 2000)
Races - Other race alone (%)
Races - Other race alone (% change since 2000)
Racial diversity
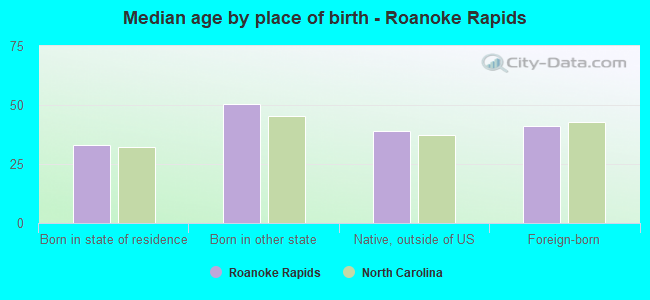
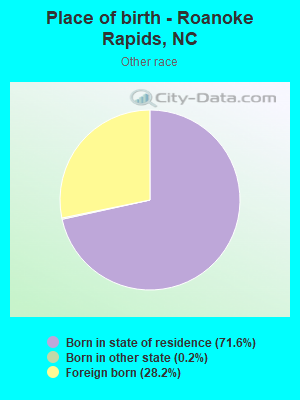
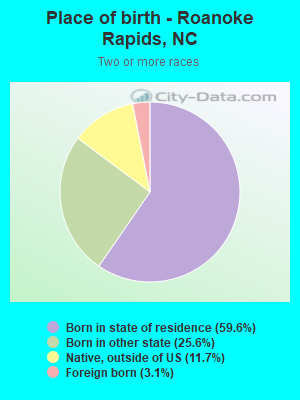
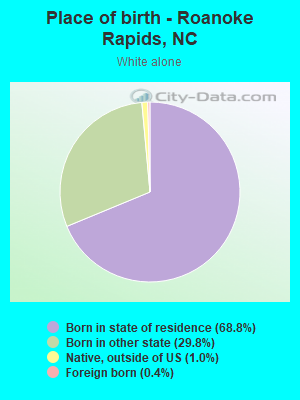
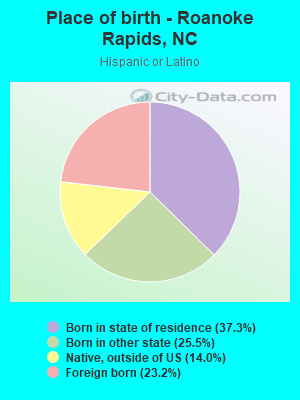
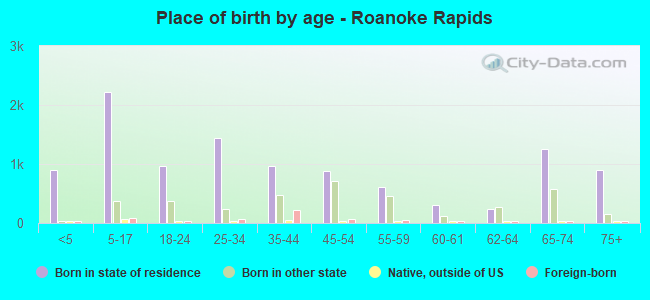
Place of birth - Born in state of residence (%)
Place of birth - Born in state of residence (%) - White
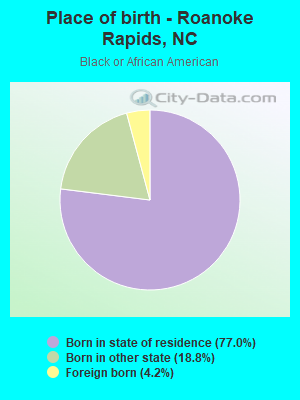
Place of birth - Born in state of residence (%) - Black or African American
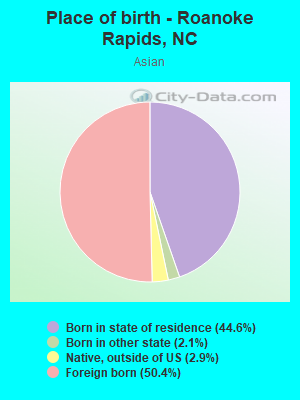
Place of birth - Born in state of residence (%) - Asian
Place of birth - Born in state of residence (%) - Hispanic or Latino
Place of birth - Born in state of residence (%) - American Indian and Alaska Native
Place of birth - Born in state of residence (%) - Multirace
Place of birth - Born in state of residence (%) - Other Race
Place of birth - Born in other state (%)
Place of birth - Born in other state (%) - White
Place of birth - Born in other state (%) - Black or African American
Place of birth - Born in other state (%) - Asian
Place of birth - Born in other state (%) - Hispanic or Latino
Place of birth - Born in other state (%) - American Indian and Alaska Native
Place of birth - Born in other state (%) - Multirace
Place of birth - Born in other state (%) - Other Race
Place of birth - Native, outside of US (%)
Place of birth - Native, outside of US (%) - White
Place of birth - Native, outside of US (%) - Black or African American
Place of birth - Native, outside of US (%) - Asian
Place of birth - Native, outside of US (%) - Hispanic or Latino
Place of birth - Native, outside of US (%) - American Indian and Alaska Native
Place of birth - Native, outside of US (%) - Multirace
Place of birth - Native, outside of US (%) - Other Race
Place of birth - Foreign born (%)
Place of birth - Foreign born (%) - White
Place of birth - Foreign born (%) - Black or African American
Place of birth - Foreign born (%) - Asian
Place of birth - Foreign born (%) - Hispanic or Latino
Place of birth - Foreign born (%) - American Indian and Alaska Native
Place of birth - Foreign born (%) - Multirace
Place of birth - Foreign born (%) - Other Race
Residents speaking English at home (%)
Residents speaking English at home - Born in the United States (%)
Residents speaking English at home - Native, born elsewhere (%)
Residents speaking English at home - Foreign born (%)
Residents speaking Spanish at home (%)
Residents speaking Spanish at home - Born in the United States (%)
Residents speaking Spanish at home - Native, born elsewhere (%)
Residents speaking Spanish at home - Foreign born (%)
Residents speaking other language at home (%)
Residents speaking other language at home - Born in the United States (%)
Residents speaking other language at home - Native, born elsewhere (%)
Residents speaking other language at home - Foreign born (%)
Marital status - Never married (%)
Marital status - Now married (%)
Marital status - Separated (%)
Marital status - Widowed (%)
Marital status - Divorced (%)
Ancestries Reported - Arab (%)
Ancestries Reported - Czech (%)
Ancestries Reported - Danish (%)
Ancestries Reported - Dutch (%)
Ancestries Reported - English (%)
Ancestries Reported - French (%)
Ancestries Reported - French Canadian (%)
Ancestries Reported - German (%)
Ancestries Reported - Greek (%)
Ancestries Reported - Hungarian (%)
Ancestries Reported - Irish (%)
Ancestries Reported - Italian (%)
Ancestries Reported - Lithuanian (%)
Ancestries Reported - Norwegian (%)
Ancestries Reported - Polish (%)
Ancestries Reported - Portuguese (%)
Ancestries Reported - Russian (%)
Ancestries Reported - Scotch-Irish (%)
Ancestries Reported - Scottish (%)
Ancestries Reported - Slovak (%)
Ancestries Reported - Subsaharan African (%)
Ancestries Reported - Swedish (%)
Ancestries Reported - Swiss (%)
Ancestries Reported - Ukrainian (%)
Ancestries Reported - United States (%)
Ancestries Reported - Welsh (%)
Ancestries Reported - West Indian (%)
Ancestries Reported - Other (%)
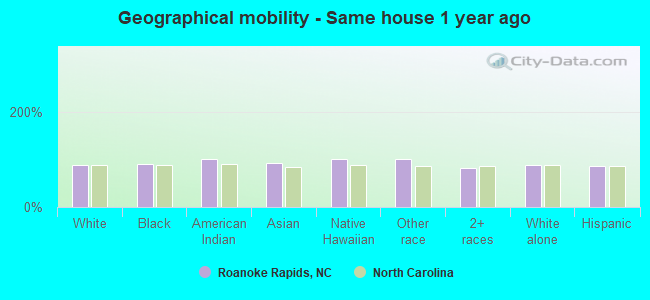
Geographical mobility - Same house 1 year ago (%)
Geographical mobility - Same house 1 year ago (%) - White
Geographical mobility - Same house 1 year ago (%) - Black or African American
Geographical mobility - Same house 1 year ago (%) - Asian
Geographical mobility - Same house 1 year ago (%) - Hispanic or Latino
Geographical mobility - Same house 1 year ago (%) - American Indian and Alaska Native
Geographical mobility - Same house 1 year ago (%) - Multirace
Geographical mobility - Same house 1 year ago (%) - Other Race
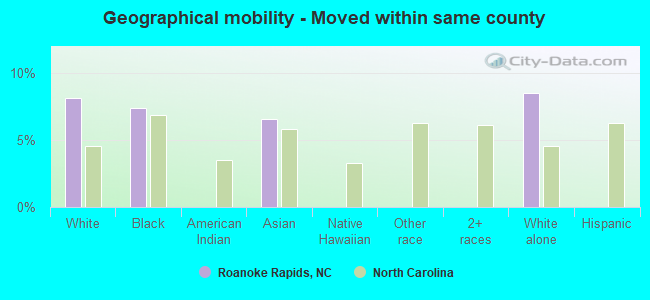
Geographical mobility - Moved within same county (%)
Geographical mobility - Moved within same county (%) - White
Geographical mobility - Moved within same county (%) - Black or African American
Geographical mobility - Moved within same county (%) - Asian
Geographical mobility - Moved within same county (%) - Hispanic or Latino
Geographical mobility - Moved within same county (%) - American Indian and Alaska Native
Geographical mobility - Moved within same county (%) - Multirace
Geographical mobility - Moved within same county (%) - Other Race
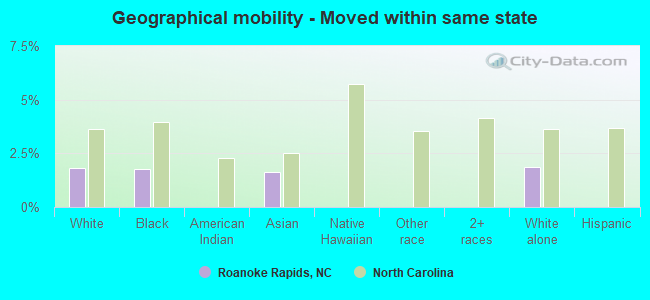
Geographical mobility - Moved from different county within same state (%)
Geographical mobility - Moved from different county within same state (%) - White
Geographical mobility - Moved from different county within same state (%) - Black or African American
Geographical mobility - Moved from different county within same state (%) - Asian
Geographical mobility - Moved from different county within same state (%) - Hispanic or Latino
Geographical mobility - Moved from different county within same state (%) - American Indian and Alaska Native
Geographical mobility - Moved from different county within same state (%) - Multirace
Geographical mobility - Moved from different county within same state (%) - Other Race
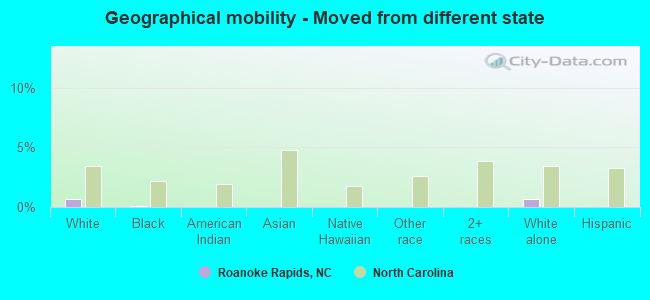
Geographical mobility - Moved from different state (%)
Geographical mobility - Moved from different state (%) - White
Geographical mobility - Moved from different state (%) - Black or African American
Geographical mobility - Moved from different state (%) - Asian
Geographical mobility - Moved from different state (%) - Hispanic or Latino
Geographical mobility - Moved from different state (%) - American Indian and Alaska Native
Geographical mobility - Moved from different state (%) - Multirace
Geographical mobility - Moved from different state (%) - Other Race
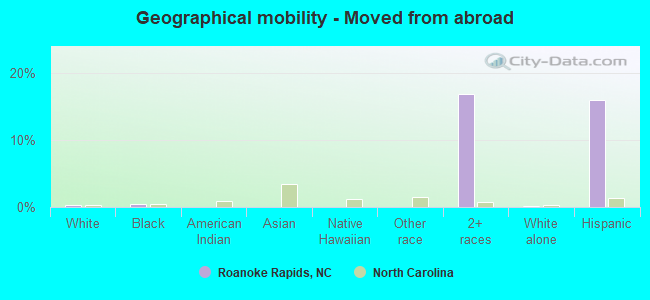
Geographical mobility - Moved from abroad (%)
Geographical mobility - Moved from abroad (%) - White
Geographical mobility - Moved from abroad (%) - Black or African American
Geographical mobility - Moved from abroad (%) - Asian
Geographical mobility - Moved from abroad (%) - Hispanic or Latino
Geographical mobility - Moved from abroad (%) - American Indian and Alaska Native
Geographical mobility - Moved from abroad (%) - Multirace
Geographical mobility - Moved from abroad (%) - Other Race
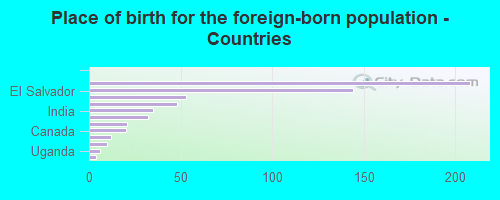
Place of birth for the foreign-born population - Ireland (%)
Place of birth for the foreign-born population - Denmark (%)
Place of birth for the foreign-born population - Norway (%)
Place of birth for the foreign-born population - Sweden (%)
Place of birth for the foreign-born population - United Kingdom (%)
Place of birth for the foreign-born population - England (%)
Place of birth for the foreign-born population - Scotland (%)
Place of birth for the foreign-born population - Other Northern Europe (%)
Place of birth for the foreign-born population - Austria (%)
Place of birth for the foreign-born population - Belgium (%)
Place of birth for the foreign-born population - France (%)
Place of birth for the foreign-born population - Germany (%)
Place of birth for the foreign-born population - Netherlands (%)
Place of birth for the foreign-born population - Switzerland (%)
Place of birth for the foreign-born population - Other Western Europe (%)
Place of birth for the foreign-born population - Greece (%)
Place of birth for the foreign-born population - Italy (%)
Place of birth for the foreign-born population - Portugal (%)
Place of birth for the foreign-born population - Spain (%)
Place of birth for the foreign-born population - Other Southern Europe (%)
Place of birth for the foreign-born population - Albania (%)
Place of birth for the foreign-born population - Belarus (%)
Place of birth for the foreign-born population - Bosnia and Herzegovina (%)
Place of birth for the foreign-born population - Bulgaria (%)
Place of birth for the foreign-born population - Croatia (%)
Place of birth for the foreign-born population - Czechoslovakia (%)
Place of birth for the foreign-born population - Hungary (%)
Place of birth for the foreign-born population - Latvia (%)
Place of birth for the foreign-born population - Lithuania (%)
Place of birth for the foreign-born population - North Macedonia (Macedonia) (%)
Place of birth for the foreign-born population - Moldova (%)
Place of birth for the foreign-born population - Poland (%)
Place of birth for the foreign-born population - Romania (%)
Place of birth for the foreign-born population - Russia (%)
Place of birth for the foreign-born population - Serbia (%)
Place of birth for the foreign-born population - Ukraine (%)
Place of birth for the foreign-born population - Other Eastern Europe (%)
Place of birth for the foreign-born population - China (%)
Place of birth for the foreign-born population - Hong Kong (%)
Place of birth for the foreign-born population - Taiwan (%)
Place of birth for the foreign-born population - Japan (%)
Place of birth for the foreign-born population - Korea (%)
Place of birth for the foreign-born population - Other Eastern Asia (%)
Place of birth for the foreign-born population - Afghanistan (%)
Place of birth for the foreign-born population - Bangladesh (%)
Place of birth for the foreign-born population - India (%)
Place of birth for the foreign-born population - Iran (%)
Place of birth for the foreign-born population - Kazakhstan (%)
Place of birth for the foreign-born population - Nepal (%)
Place of birth for the foreign-born population - Pakistan (%)
Place of birth for the foreign-born population - Sri Lanka (%)
Place of birth for the foreign-born population - Uzbekistan (%)
Place of birth for the foreign-born population - Other South Central Asia (%)
Place of birth for the foreign-born population - Burma (%)
Place of birth for the foreign-born population - Cambodia (%)
Place of birth for the foreign-born population - Indonesia (%)
Place of birth for the foreign-born population - Laos (%)
Place of birth for the foreign-born population - Malaysia (%)
Place of birth for the foreign-born population - Philippines (%)
Place of birth for the foreign-born population - Singapore (%)
Place of birth for the foreign-born population - Thailand (%)
Place of birth for the foreign-born population - Vietnam (%)
Place of birth for the foreign-born population - Other South Eastern Asia (%)
Place of birth for the foreign-born population - Armenia (%)
Place of birth for the foreign-born population - Iraq (%)
Place of birth for the foreign-born population - Israel (%)
Place of birth for the foreign-born population - Jordan (%)
Place of birth for the foreign-born population - Kuwait (%)
Place of birth for the foreign-born population - Lebanon (%)
Place of birth for the foreign-born population - Saudi Arabia (%)
Place of birth for the foreign-born population - Syria (%)
Place of birth for the foreign-born population - Turkey (%)
Place of birth for the foreign-born population - Yemen (%)
Place of birth for the foreign-born population - Other Western Asia (%)
Place of birth for the foreign-born population - Eritrea (%)
Place of birth for the foreign-born population - Ethiopia (%)
Place of birth for the foreign-born population - Kenya (%)
Place of birth for the foreign-born population - Somalia (%)
Place of birth for the foreign-born population - Uganda (%)
Place of birth for the foreign-born population - Zimbabwe (%)
Place of birth for the foreign-born population - Other Eastern Africa (%)
Place of birth for the foreign-born population - Cameroon (%)
Place of birth for the foreign-born population - Congo (%)
Place of birth for the foreign-born population - Democratic Republic of Congo (Zaire) (%)
Place of birth for the foreign-born population - Other Middle Africa (%)
Place of birth for the foreign-born population - Egypt (%)
Place of birth for the foreign-born population - Morocco (%)
Place of birth for the foreign-born population - Sudan (%)
Place of birth for the foreign-born population - Other Northern Africa (%)
Place of birth for the foreign-born population - South Africa (%)
Place of birth for the foreign-born population - Other Southern Africa (%)
Place of birth for the foreign-born population - Cabo Verde (%)
Place of birth for the foreign-born population - Ghana (%)
Place of birth for the foreign-born population - Liberia (%)
Place of birth for the foreign-born population - Nigeria (%)
Place of birth for the foreign-born population - Senegal (%)
Place of birth for the foreign-born population - Sierra Leone (%)
Place of birth for the foreign-born population - Other Western Africa (%)
Place of birth for the foreign-born population - Australia (%)
Place of birth for the foreign-born population - New Zealand (%)
Place of birth for the foreign-born population - Fiji (%)
Place of birth for the foreign-born population - Micronesia (%)
Place of birth for the foreign-born population - Bahamas (%)
Place of birth for the foreign-born population - Barbados (%)
Place of birth for the foreign-born population - Cuba (%)
Place of birth for the foreign-born population - Dominica (%)
Place of birth for the foreign-born population - Dominican Republic (%)
Place of birth for the foreign-born population - Grenada (%)
Place of birth for the foreign-born population - Haiti (%)
Place of birth for the foreign-born population - Jamaica (%)
Place of birth for the foreign-born population - St. Vincent and the Grenadines (%)
Place of birth for the foreign-born population - Trinidad and Tobago (%)
Place of birth for the foreign-born population - West Indies (%)
Place of birth for the foreign-born population - Other Caribbean (%)
Place of birth for the foreign-born population - Belize (%)
Place of birth for the foreign-born population - Costa Rica (%)
Place of birth for the foreign-born population - El Salvador (%)
Place of birth for the foreign-born population - Guatemala (%)
Place of birth for the foreign-born population - Honduras (%)
Place of birth for the foreign-born population - Mexico (%)
Place of birth for the foreign-born population - Nicaragua (%)
Place of birth for the foreign-born population - Panama (%)
Place of birth for the foreign-born population - Other Central America (%)
Place of birth for the foreign-born population - Argentina (%)
Place of birth for the foreign-born population - Bolivia (%)
Place of birth for the foreign-born population - Brazil (%)
Place of birth for the foreign-born population - Chile (%)
Place of birth for the foreign-born population - Colombia (%)
Place of birth for the foreign-born population - Ecuador (%)
Place of birth for the foreign-born population - Guyana (%)
Place of birth for the foreign-born population - Peru (%)
Place of birth for the foreign-born population - Uruguay (%)
Place of birth for the foreign-born population - Venezuela (%)
Place of birth for the foreign-born population - Other South America (%)
Place of birth for the foreign-born population - Canada (%)
Place of birth for the foreign-born population - Other Northern America (%)
Place of birth for the foreign-born population - Other (%)
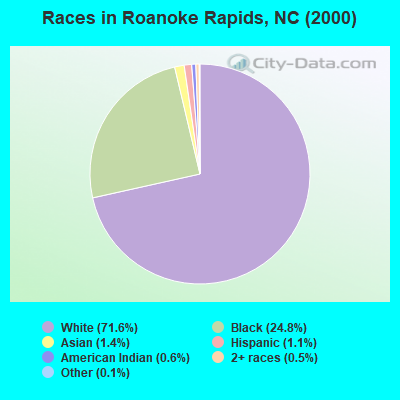
According to 2022 data, the most numerous races in Roanoke Rapids, NC are White alone (7,892 residents), Black alone (5,132 residents), and Hispanic (963 residents). 92.2% of Roanoke Rapids residents speak English at home. 3.9% of Roanoke Rapids, NC residents are foreign-born (1.4% born in Latin America, 1.3% born in Africa, 0.8% born in Asia), which is 107.0% less than the foreign-born rate of 8.0% across the entire state of North Carolina.
Race distribution in Roanoke Rapids
2000 2022
5,647,155 70.2% White alone 1,723,301 21.4% Black alone 378,963 4.7% Hispanic 112,416 1.4% Asian alone 95,333 1.2% American Indian alone 79,965 1.0% Two or more races 9,015 0.1% Other race alone 3,165 0.04% Native Hawaiian and Other
6,497,519 60.7% White alone 2,155,650 20.1% Black alone 1,114,799 10.4% Hispanic 438,061 4.1% Two or more races 341,052 3.2% Asian alone 91,758 0.9% American Indian alone 50,180 0.5% Other race alone 9,954 0.09% Native Hawaiian and Other
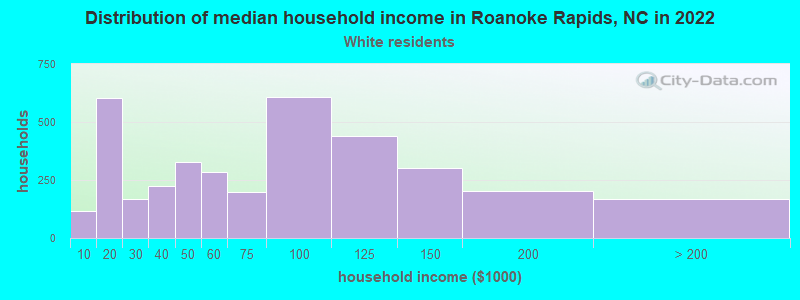
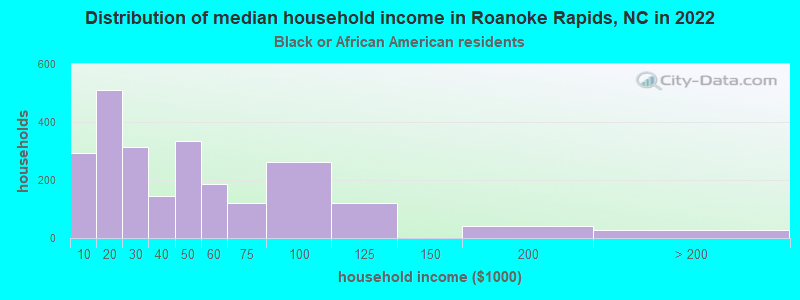
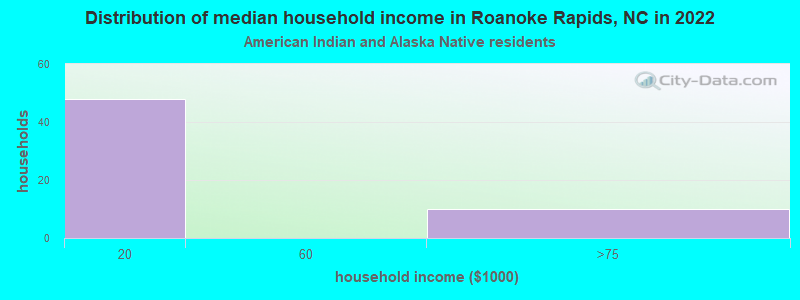
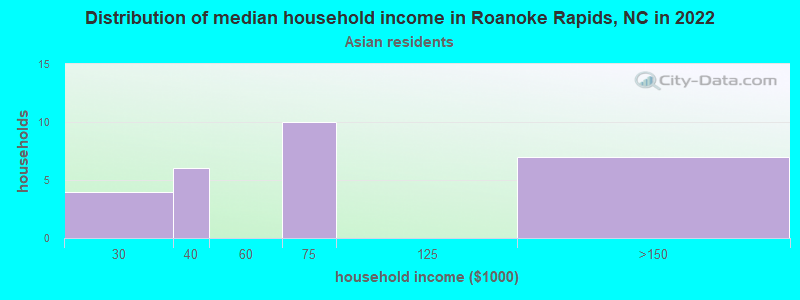
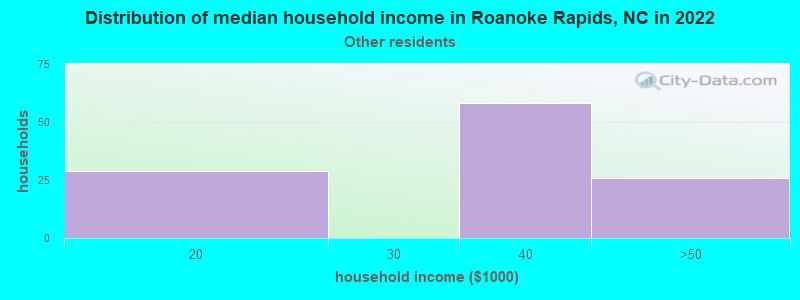
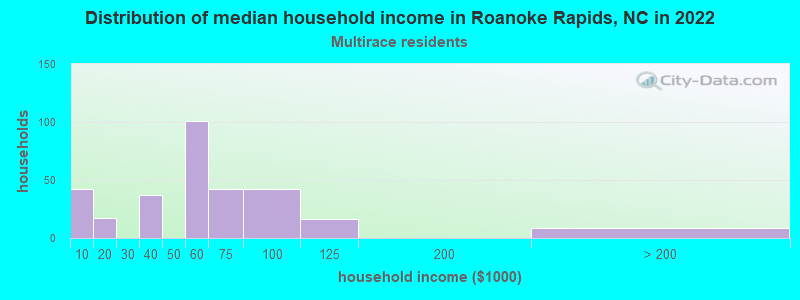
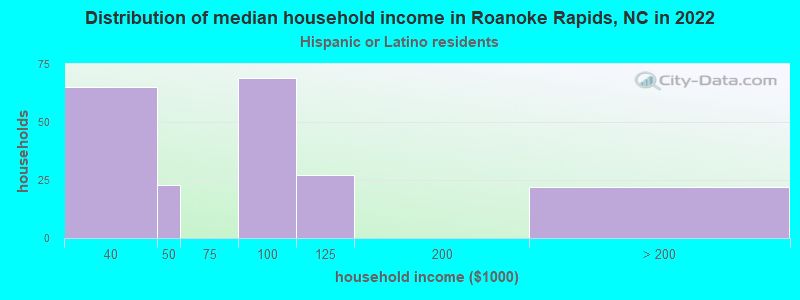
Income and house value in Roanoke Rapids Median household income in 2022 $62,360 White non-Hispanic householders$31,535 Black householders$74,228 Asian householders$37,142 Some other race householders$54,500 Two or more races householders$87,752 Hispanic or Latino race householdersMedian 2022 house value $156,525 White Non-Hispanic householders$134,549 Black or African American householders$36,280 American Indian or Alaska Native householders $673,785 Asian householders$176,220 Some other race householders$211,050 Two or more races householders$181,818 Hispanic or Latino householders
Median age by race in Roanoke Rapids
49.3 Median age for White residents49.3 49.3 35.8 Median age for Black or African American residents28.5 42.0 9.7 Median age for American Indian / Alaska Native residents-668,604,650.5 29.9 20.4 Median age for Asian residents16.4 49.0 -609,884,331.7 Median age for Native Hawaiian / Pacific Islander residents-611,708,482.1 -612,403,100.2 18.4 Median age for Other race residents15.1 27.1 19.0 Median age for Two or more races residents17.7 23.0 49.3 Median age for White alone residents49.4 49.3 21.3 Median age for Hispanic or Latino residents15.0 35.6
Owner/renter occupied households by race in Roanoke Rapids
House owners and renters - White residents 2,491 68.3% Owner occupied1,155 31.7% Renter occupiedHouse owners and renters - Black or African American residents 599 24.9% Owner occupied1,809 75.1% Renter occupiedHouse owners and renters - American Indian / Alaska Native residents 11 19.3% Owner occupied45 80.7% Renter occupiedHouse owners and renters - Asian residents 30 100.0% Owner occupiedHouse owners and renters - Other race residents 30 25.3% Owner occupied88 74.7% Renter occupiedHouse owners and renters - Two or more races residents 183 61.8% Owner occupied113 38.2% Renter occupiedHouse owners and renters - White alone residents 2,489 68.6% Owner occupied1,140 31.4% Renter occupiedHouse owners and renters - Hispanic or Latino residents 71 34.0% Owner occupied137 66.0% Renter occupied
Language usage in Roanoke Rapids
English speakers - Total 92.2% of residents of Roanoke Rapids speak English at home.
4.8% of residents speak Spanish at home 473 68.3% Speak English very well220 31.7% Speak English less than very well2.8% of residents speak other language at home 307 76.4% Speak English very well95 23.6% Speak English less than very well
English speakers - Born in the United States 96.1% of residents of Roanoke Rapids speak English at home.
3.6% of residents speak Spanish at home 78 58.2% Speak English very well56 41.8% Speak English less than very well0.5% of residents speak other language at home 18 100.0% Speak English very well
English speakers - Native, born elsewhere 32.2% of residents of Roanoke Rapids speak English at home.
52.9% of residents speak Spanish at home 120 100.0% Speak English very well10.6% of residents speak other language at home 19 79.2% Speak English very well5 20.8% Speak English less than very well
English speakers - Foreign-born 18.2% of residents of Roanoke Rapids speak English at home.
39.0% of residents speak Spanish at home 63 27.0% Speak English very well170 73.0% Speak English less than very well42.8% of residents speak other language at home 170 66.4% Speak English very well86 33.6% Speak English less than very well
White (Caucasian) - Speak only English Native:
100.0% (7,476)Foreign-born:
22.7% (19)
White (Caucasian) - Speak another language Native:
0.7% (52)Foreign-born:
70.2% (60)
Black or African American - Speak only English Native:
98.6% (4,593)Foreign-born:
29.8% (64)
Black or African American - Speak another language Native:
1.4% (66)Foreign-born:
70.0% (152)
Asian - Speak only English Native:
17.3% (16)Foreign-born:
24.1% (26)
Asian - Speak another language Native:
83.0% (78)Foreign-born:
75.7% (81)
Other race - Speak another language Native:
78.4% (208)Foreign-born:
100.0% (149)
Two or more races - Speak another language Native:
23.4% (309)Foreign-born:
100.0% (46)
White alone - Speak only English Native:
99.3% (7,415)Foreign-born:
65.6% (20)
White alone - Speak another language Native:
0.6% (46)Foreign-born:
34.5% (11)
Hispanic or Latino - Speak another language Native:
66.9% (434)Foreign-born:
99.8% (225)
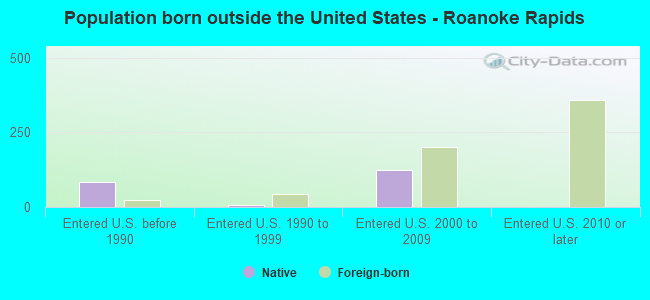
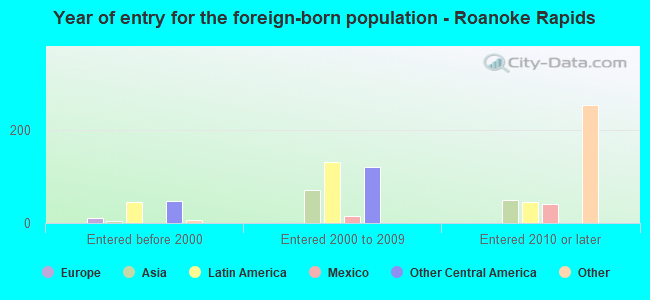
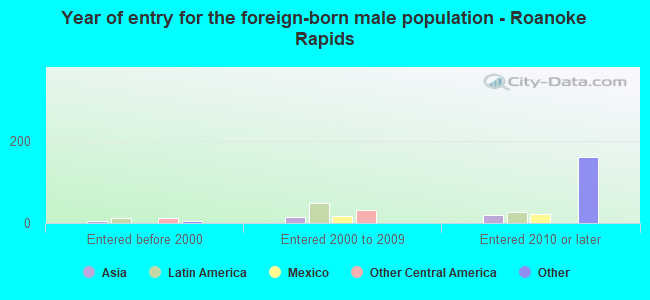
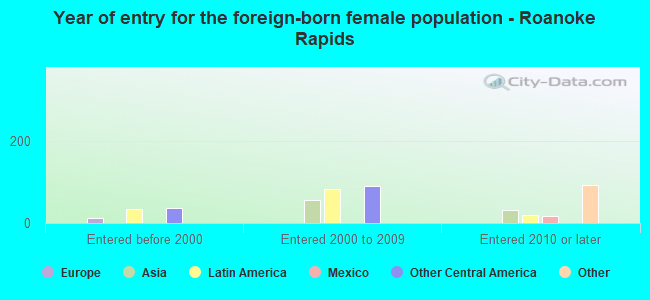
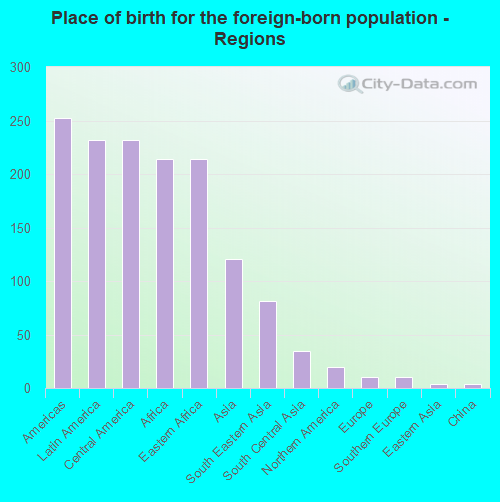
Foreign-born residents in Roanoke Rapids 598 residents are foreign born (1.4% Latin America , 1.3% Africa , 0.8% Asia ).
This city:
3.9%North Carolina:
8.3%
Marital status for residents in Roanoke Rapids Marital status - White (Caucasian) population 15 years and over
Males 25.9% Never married58.1% Now married2.2% Separated3.1% Widowed10.7% DivorcedFemales 20.5% Never married49.1% Now married1.5% Separated16.1% Widowed12.8% DivorcedWomen who gave birth in the past 12 months Now married:
76.9% (39)Unmarried:
23.1% (12)
Women who did not give birth in the past 12 months Now married:
48.7% (758)Unmarried:
51.3% (800)
Marital status - Black or African American population 15 years and over
Males 49.2% Never married37.9% Now married0.5% Separated4.5% Widowed7.9% DivorcedFemales 51.9% Never married17.0% Now married9.5% Separated8.4% Widowed13.2% DivorcedWomen who did not give birth in the past 12 months Now married:
18.3% (225)Unmarried:
81.7% (1,004)
Marital status - Asian population 15 years and over
Males 58.7% Never married41.3% Now married0.0% Separated0.0% Widowed0.0% DivorcedFemales 6.5% Never married93.5% Now married0.0% Separated0.0% Widowed0.0% DivorcedWomen who did not give birth in the past 12 months Now married:
87.9% (30)Unmarried:
12.1% (4)
Marital status - Native Hawaiian / Pacific Islander population 15 years and over
Males 0.0% Never married0.0% Now married0.0% Separated0.0% Widowed100.0% DivorcedFemales 0.0% Never married100.0% Now married0.0% Separated0.0% Widowed0.0% DivorcedWomen who did not give birth in the past 12 months Now married:
100.0% (49)Unmarried:
0.0% (0)
Marital status - Other race population 15 years and over
Males 100.0% Never married0.0% Now married0.0% Separated0.0% Widowed0.0% DivorcedFemales 75.0% Never married0.0% Now married0.0% Separated23.9% Widowed1.1% DivorcedWomen who gave birth in the past 12 months Now married:
0.0% (0)Unmarried:
100.0% (60)
Women who did not give birth in the past 12 months Now married:
0.0% (0)Unmarried:
100.0% (59)
Marital status - Two or more races population 15 years and over
Males 78.4% Never married18.0% Now married0.0% Separated0.0% Widowed3.6% DivorcedFemales 29.3% Never married33.7% Now married2.9% Separated0.0% Widowed34.1% DivorcedWomen who did not give birth in the past 12 months Now married:
14.2% (26)Unmarried:
85.8% (157)
Marital status - White alone, not Hispanic / Latino population 15 years and over
Males 24.5% Never married59.1% Now married2.3% Separated3.2% Widowed11.0% DivorcedFemales 19.4% Never married49.5% Now married1.5% Separated16.4% Widowed13.1% DivorcedWomen who gave birth in the past 12 months Now married:
76.9% (40)Unmarried:
23.1% (12)
Women who did not give birth in the past 12 months Now married:
50.4% (784)Unmarried:
49.6% (771)
Marital status - Hispanic or Latino population 15 years and over
Males 74.8% Never married25.2% Now married0.0% Separated0.0% Widowed0.0% DivorcedFemales 61.0% Never married30.9% Now married0.0% Separated8.1% Widowed0.0% DivorcedWomen who gave birth in the past 12 months Now married:
0.0% (0)Unmarried:
100.0% (48)
Women who did not give birth in the past 12 months Now married:
29.7% (62)Unmarried:
70.3% (146)
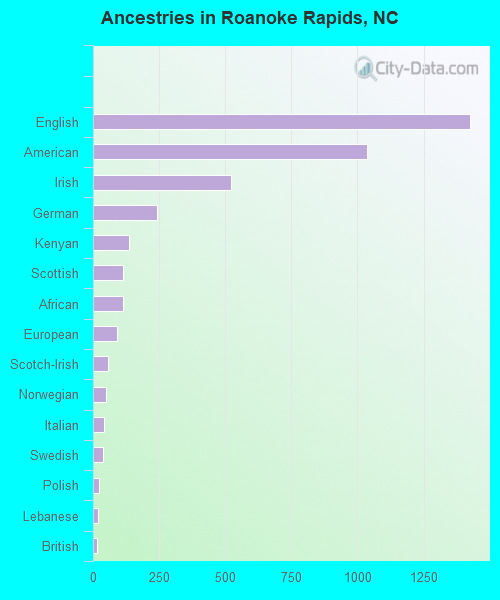
Ancestries in Roanoke Rapids
1,426 14.3% English1,035 10.4% American521 5.2% Irish241 2.4% German138 1.4% Kenyan113 1.1% Scottish113 1.1% African90 0.9% European56 0.6% Scotch-Irish48 0.5% Norwegian43 0.4% Italian37 0.4% Swedish22 0.2% Polish19 0.2% Lebanese17 0.2% British12 0.1% Northern European11 0.1% Hungarian9 0.09% French6 0.06% Canadian6 0.06% Dutch5 0.05% Welsh
Children Nativity (place of birth) in Roanoke Rapids
Children under 6 years - Living with two parents Both parents native 298 100.0% Native0 0.0% Foreign-bornBoth parents foreign-born 48 62.2% Native29 37.8% Foreign-bornChildren under 6 years - Living with one parent Native parent 577 100.0% NativeForeign-born parent 89 100.0% NativeChildren 6 to 17 years - Living with two parents Both parents native 945 100.0% NativeBoth parents foreign-born 81 58.4% Native58 41.6% Foreign-bornChildren 6 to 17 years - Living with one parent Native parent 1,147 100.0% NativeForeign-born parent 157 51.0% Native151 49.0% Foreign-born
Grandparents responsible for own grandchildren in Roanoke Rapids
Grandparents (30 to 59 years) White / Caucasian 51 100.0% Not responsible for grandchildrenBlack or African American 53 100.0% Responsible for grandchildrenWhite alone, not Hispanic / Latino 53 100.0% Not responsible for grandchildrenGrandparents (60 years and over) White / Caucasian 15 74.2% Responsible for grandchildren5 25.8% Not responsible for grandchildrenBlack or African American 60 43.5% Responsible for grandchildren78 56.5% Not responsible for grandchildrenWhite alone, not Hispanic / Latino 16 74.3% Responsible for grandchildren5 25.7% Not responsible for grandchildren