Races in Roanoke, Texas (TX) Detailed Stats
Data:
Races - White alone (%)
Races - White alone (% change since 2000)
Races - Black alone (%)
Races - Black alone (% change since 2000)
Races - American Indian alone (%)
Races - American Indian alone (% change since 2000)
Races - Asian alone (%)
Races - Asian alone (% change since 2000)
Races - Hispanic (%)
Races - Hispanic (% change since 2000)
Races - Native Hawaiian and Other Pacific Islander alone (%)
Races - Native Hawaiian and Other Pacific Islander alone (% change since 2000)
Races - Two or more races(%)
Races - Two or more races(% change since 2000)
Races - Other race alone (%)
Races - Other race alone (% change since 2000)
Racial diversity
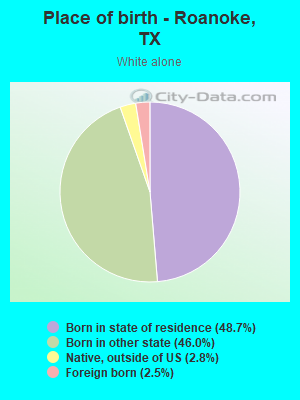
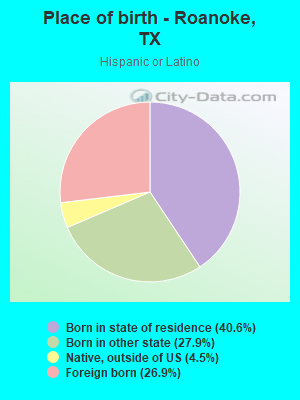
Place of birth - Born in state of residence (%)
Place of birth - Born in state of residence (%) - White
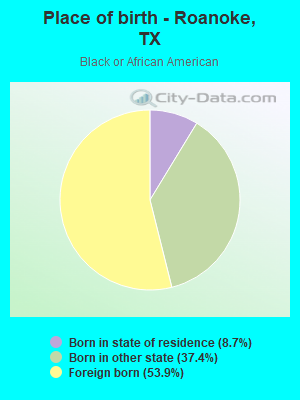
Place of birth - Born in state of residence (%) - Black or African American
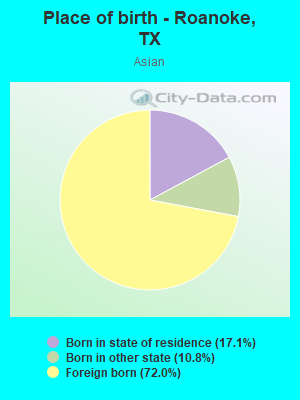
Place of birth - Born in state of residence (%) - Asian
Place of birth - Born in state of residence (%) - Hispanic or Latino
Place of birth - Born in state of residence (%) - American Indian and Alaska Native
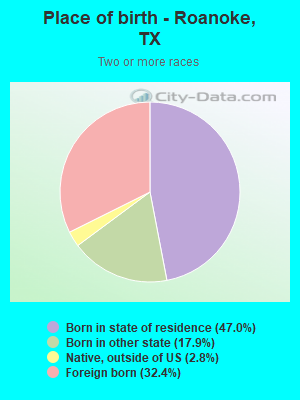
Place of birth - Born in state of residence (%) - Multirace
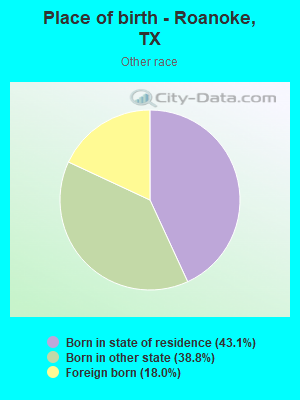
Place of birth - Born in state of residence (%) - Other Race
Place of birth - Born in other state (%)
Place of birth - Born in other state (%) - White
Place of birth - Born in other state (%) - Black or African American
Place of birth - Born in other state (%) - Asian
Place of birth - Born in other state (%) - Hispanic or Latino
Place of birth - Born in other state (%) - American Indian and Alaska Native
Place of birth - Born in other state (%) - Multirace
Place of birth - Born in other state (%) - Other Race
Place of birth - Native, outside of US (%)
Place of birth - Native, outside of US (%) - White
Place of birth - Native, outside of US (%) - Black or African American
Place of birth - Native, outside of US (%) - Asian
Place of birth - Native, outside of US (%) - Hispanic or Latino
Place of birth - Native, outside of US (%) - American Indian and Alaska Native
Place of birth - Native, outside of US (%) - Multirace
Place of birth - Native, outside of US (%) - Other Race
Place of birth - Foreign born (%)
Place of birth - Foreign born (%) - White
Place of birth - Foreign born (%) - Black or African American
Place of birth - Foreign born (%) - Asian
Place of birth - Foreign born (%) - Hispanic or Latino
Place of birth - Foreign born (%) - American Indian and Alaska Native
Place of birth - Foreign born (%) - Multirace
Place of birth - Foreign born (%) - Other Race
Residents speaking English at home (%)
Residents speaking English at home - Born in the United States (%)
Residents speaking English at home - Native, born elsewhere (%)
Residents speaking English at home - Foreign born (%)
Residents speaking Spanish at home (%)
Residents speaking Spanish at home - Born in the United States (%)
Residents speaking Spanish at home - Native, born elsewhere (%)
Residents speaking Spanish at home - Foreign born (%)
Residents speaking other language at home (%)
Residents speaking other language at home - Born in the United States (%)
Residents speaking other language at home - Native, born elsewhere (%)
Residents speaking other language at home - Foreign born (%)
Marital status - Never married (%)
Marital status - Now married (%)
Marital status - Separated (%)
Marital status - Widowed (%)
Marital status - Divorced (%)
Ancestries Reported - Arab (%)
Ancestries Reported - Czech (%)
Ancestries Reported - Danish (%)
Ancestries Reported - Dutch (%)
Ancestries Reported - English (%)
Ancestries Reported - French (%)
Ancestries Reported - French Canadian (%)
Ancestries Reported - German (%)
Ancestries Reported - Greek (%)
Ancestries Reported - Hungarian (%)
Ancestries Reported - Irish (%)
Ancestries Reported - Italian (%)
Ancestries Reported - Lithuanian (%)
Ancestries Reported - Norwegian (%)
Ancestries Reported - Polish (%)
Ancestries Reported - Portuguese (%)
Ancestries Reported - Russian (%)
Ancestries Reported - Scotch-Irish (%)
Ancestries Reported - Scottish (%)
Ancestries Reported - Slovak (%)
Ancestries Reported - Subsaharan African (%)
Ancestries Reported - Swedish (%)
Ancestries Reported - Swiss (%)
Ancestries Reported - Ukrainian (%)
Ancestries Reported - United States (%)
Ancestries Reported - Welsh (%)
Ancestries Reported - West Indian (%)
Ancestries Reported - Other (%)
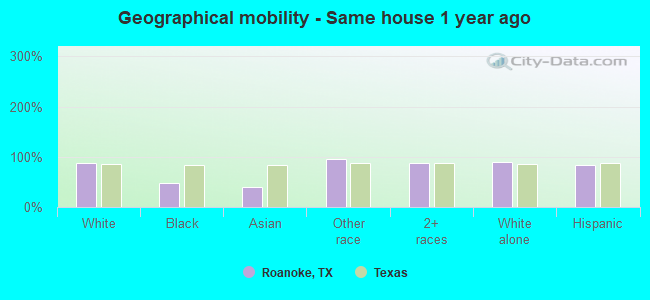
Geographical mobility - Same house 1 year ago (%)
Geographical mobility - Same house 1 year ago (%) - White
Geographical mobility - Same house 1 year ago (%) - Black or African American
Geographical mobility - Same house 1 year ago (%) - Asian
Geographical mobility - Same house 1 year ago (%) - Hispanic or Latino
Geographical mobility - Same house 1 year ago (%) - American Indian and Alaska Native
Geographical mobility - Same house 1 year ago (%) - Multirace
Geographical mobility - Same house 1 year ago (%) - Other Race
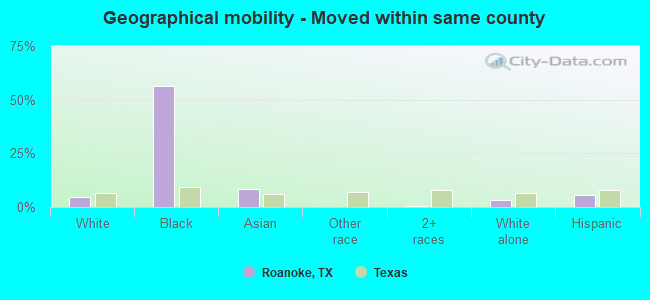
Geographical mobility - Moved within same county (%)
Geographical mobility - Moved within same county (%) - White
Geographical mobility - Moved within same county (%) - Black or African American
Geographical mobility - Moved within same county (%) - Asian
Geographical mobility - Moved within same county (%) - Hispanic or Latino
Geographical mobility - Moved within same county (%) - American Indian and Alaska Native
Geographical mobility - Moved within same county (%) - Multirace
Geographical mobility - Moved within same county (%) - Other Race
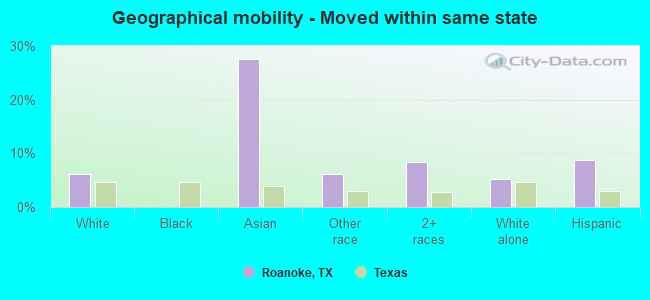
Geographical mobility - Moved from different county within same state (%)
Geographical mobility - Moved from different county within same state (%) - White
Geographical mobility - Moved from different county within same state (%) - Black or African American
Geographical mobility - Moved from different county within same state (%) - Asian
Geographical mobility - Moved from different county within same state (%) - Hispanic or Latino
Geographical mobility - Moved from different county within same state (%) - American Indian and Alaska Native
Geographical mobility - Moved from different county within same state (%) - Multirace
Geographical mobility - Moved from different county within same state (%) - Other Race
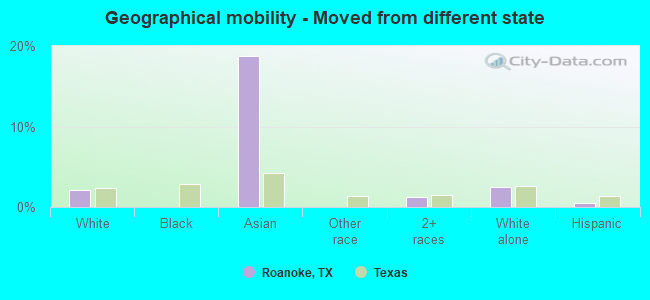
Geographical mobility - Moved from different state (%)
Geographical mobility - Moved from different state (%) - White
Geographical mobility - Moved from different state (%) - Black or African American
Geographical mobility - Moved from different state (%) - Asian
Geographical mobility - Moved from different state (%) - Hispanic or Latino
Geographical mobility - Moved from different state (%) - American Indian and Alaska Native
Geographical mobility - Moved from different state (%) - Multirace
Geographical mobility - Moved from different state (%) - Other Race
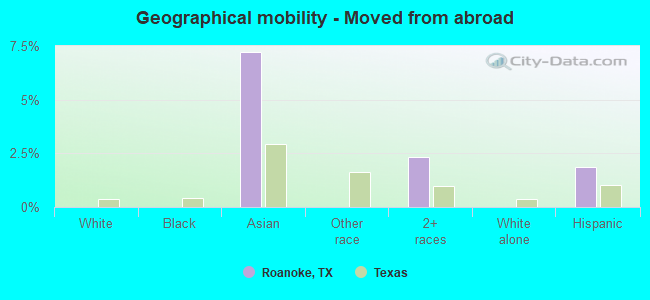
Geographical mobility - Moved from abroad (%)
Geographical mobility - Moved from abroad (%) - White
Geographical mobility - Moved from abroad (%) - Black or African American
Geographical mobility - Moved from abroad (%) - Asian
Geographical mobility - Moved from abroad (%) - Hispanic or Latino
Geographical mobility - Moved from abroad (%) - American Indian and Alaska Native
Geographical mobility - Moved from abroad (%) - Multirace
Geographical mobility - Moved from abroad (%) - Other Race
Place of birth for the foreign-born population - Ireland (%)
Place of birth for the foreign-born population - Denmark (%)
Place of birth for the foreign-born population - Norway (%)
Place of birth for the foreign-born population - Sweden (%)
Place of birth for the foreign-born population - United Kingdom (%)
Place of birth for the foreign-born population - England (%)
Place of birth for the foreign-born population - Scotland (%)
Place of birth for the foreign-born population - Other Northern Europe (%)
Place of birth for the foreign-born population - Austria (%)
Place of birth for the foreign-born population - Belgium (%)
Place of birth for the foreign-born population - France (%)
Place of birth for the foreign-born population - Germany (%)
Place of birth for the foreign-born population - Netherlands (%)
Place of birth for the foreign-born population - Switzerland (%)
Place of birth for the foreign-born population - Other Western Europe (%)
Place of birth for the foreign-born population - Greece (%)
Place of birth for the foreign-born population - Italy (%)
Place of birth for the foreign-born population - Portugal (%)
Place of birth for the foreign-born population - Spain (%)
Place of birth for the foreign-born population - Other Southern Europe (%)
Place of birth for the foreign-born population - Albania (%)
Place of birth for the foreign-born population - Belarus (%)
Place of birth for the foreign-born population - Bosnia and Herzegovina (%)
Place of birth for the foreign-born population - Bulgaria (%)
Place of birth for the foreign-born population - Croatia (%)
Place of birth for the foreign-born population - Czechoslovakia (%)
Place of birth for the foreign-born population - Hungary (%)
Place of birth for the foreign-born population - Latvia (%)
Place of birth for the foreign-born population - Lithuania (%)
Place of birth for the foreign-born population - North Macedonia (Macedonia) (%)
Place of birth for the foreign-born population - Moldova (%)
Place of birth for the foreign-born population - Poland (%)
Place of birth for the foreign-born population - Romania (%)
Place of birth for the foreign-born population - Russia (%)
Place of birth for the foreign-born population - Serbia (%)
Place of birth for the foreign-born population - Ukraine (%)
Place of birth for the foreign-born population - Other Eastern Europe (%)
Place of birth for the foreign-born population - China (%)
Place of birth for the foreign-born population - Hong Kong (%)
Place of birth for the foreign-born population - Taiwan (%)
Place of birth for the foreign-born population - Japan (%)
Place of birth for the foreign-born population - Korea (%)
Place of birth for the foreign-born population - Other Eastern Asia (%)
Place of birth for the foreign-born population - Afghanistan (%)
Place of birth for the foreign-born population - Bangladesh (%)
Place of birth for the foreign-born population - India (%)
Place of birth for the foreign-born population - Iran (%)
Place of birth for the foreign-born population - Kazakhstan (%)
Place of birth for the foreign-born population - Nepal (%)
Place of birth for the foreign-born population - Pakistan (%)
Place of birth for the foreign-born population - Sri Lanka (%)
Place of birth for the foreign-born population - Uzbekistan (%)
Place of birth for the foreign-born population - Other South Central Asia (%)
Place of birth for the foreign-born population - Burma (%)
Place of birth for the foreign-born population - Cambodia (%)
Place of birth for the foreign-born population - Indonesia (%)
Place of birth for the foreign-born population - Laos (%)
Place of birth for the foreign-born population - Malaysia (%)
Place of birth for the foreign-born population - Philippines (%)
Place of birth for the foreign-born population - Singapore (%)
Place of birth for the foreign-born population - Thailand (%)
Place of birth for the foreign-born population - Vietnam (%)
Place of birth for the foreign-born population - Other South Eastern Asia (%)
Place of birth for the foreign-born population - Armenia (%)
Place of birth for the foreign-born population - Iraq (%)
Place of birth for the foreign-born population - Israel (%)
Place of birth for the foreign-born population - Jordan (%)
Place of birth for the foreign-born population - Kuwait (%)
Place of birth for the foreign-born population - Lebanon (%)
Place of birth for the foreign-born population - Saudi Arabia (%)
Place of birth for the foreign-born population - Syria (%)
Place of birth for the foreign-born population - Turkey (%)
Place of birth for the foreign-born population - Yemen (%)
Place of birth for the foreign-born population - Other Western Asia (%)
Place of birth for the foreign-born population - Eritrea (%)
Place of birth for the foreign-born population - Ethiopia (%)
Place of birth for the foreign-born population - Kenya (%)
Place of birth for the foreign-born population - Somalia (%)
Place of birth for the foreign-born population - Uganda (%)
Place of birth for the foreign-born population - Zimbabwe (%)
Place of birth for the foreign-born population - Other Eastern Africa (%)
Place of birth for the foreign-born population - Cameroon (%)
Place of birth for the foreign-born population - Congo (%)
Place of birth for the foreign-born population - Democratic Republic of Congo (Zaire) (%)
Place of birth for the foreign-born population - Other Middle Africa (%)
Place of birth for the foreign-born population - Egypt (%)
Place of birth for the foreign-born population - Morocco (%)
Place of birth for the foreign-born population - Sudan (%)
Place of birth for the foreign-born population - Other Northern Africa (%)
Place of birth for the foreign-born population - South Africa (%)
Place of birth for the foreign-born population - Other Southern Africa (%)
Place of birth for the foreign-born population - Cabo Verde (%)
Place of birth for the foreign-born population - Ghana (%)
Place of birth for the foreign-born population - Liberia (%)
Place of birth for the foreign-born population - Nigeria (%)
Place of birth for the foreign-born population - Senegal (%)
Place of birth for the foreign-born population - Sierra Leone (%)
Place of birth for the foreign-born population - Other Western Africa (%)
Place of birth for the foreign-born population - Australia (%)
Place of birth for the foreign-born population - New Zealand (%)
Place of birth for the foreign-born population - Fiji (%)
Place of birth for the foreign-born population - Micronesia (%)
Place of birth for the foreign-born population - Bahamas (%)
Place of birth for the foreign-born population - Barbados (%)
Place of birth for the foreign-born population - Cuba (%)
Place of birth for the foreign-born population - Dominica (%)
Place of birth for the foreign-born population - Dominican Republic (%)
Place of birth for the foreign-born population - Grenada (%)
Place of birth for the foreign-born population - Haiti (%)
Place of birth for the foreign-born population - Jamaica (%)
Place of birth for the foreign-born population - St. Vincent and the Grenadines (%)
Place of birth for the foreign-born population - Trinidad and Tobago (%)
Place of birth for the foreign-born population - West Indies (%)
Place of birth for the foreign-born population - Other Caribbean (%)
Place of birth for the foreign-born population - Belize (%)
Place of birth for the foreign-born population - Costa Rica (%)
Place of birth for the foreign-born population - El Salvador (%)
Place of birth for the foreign-born population - Guatemala (%)
Place of birth for the foreign-born population - Honduras (%)
Place of birth for the foreign-born population - Mexico (%)
Place of birth for the foreign-born population - Nicaragua (%)
Place of birth for the foreign-born population - Panama (%)
Place of birth for the foreign-born population - Other Central America (%)
Place of birth for the foreign-born population - Argentina (%)
Place of birth for the foreign-born population - Bolivia (%)
Place of birth for the foreign-born population - Brazil (%)
Place of birth for the foreign-born population - Chile (%)
Place of birth for the foreign-born population - Colombia (%)
Place of birth for the foreign-born population - Ecuador (%)
Place of birth for the foreign-born population - Guyana (%)
Place of birth for the foreign-born population - Peru (%)
Place of birth for the foreign-born population - Uruguay (%)
Place of birth for the foreign-born population - Venezuela (%)
Place of birth for the foreign-born population - Other South America (%)
Place of birth for the foreign-born population - Canada (%)
Place of birth for the foreign-born population - Other Northern America (%)
Place of birth for the foreign-born population - Other (%)
Latest news about races in Roanoke, TX collected exclusively by city-data.com from local newspapers, TV, and radio stations
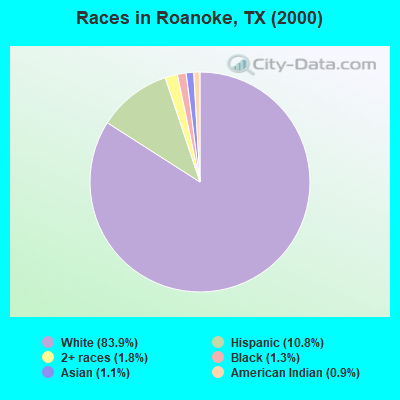
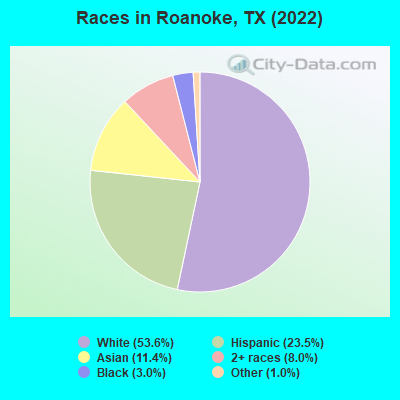
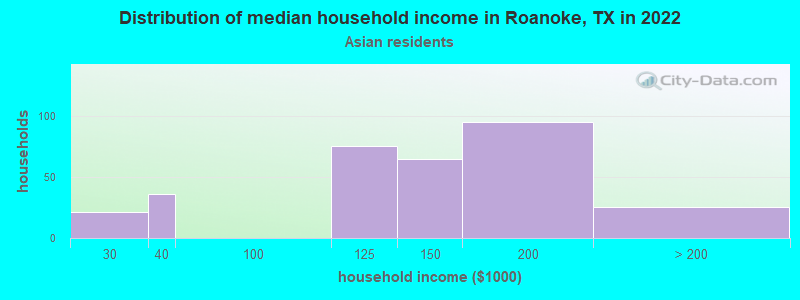
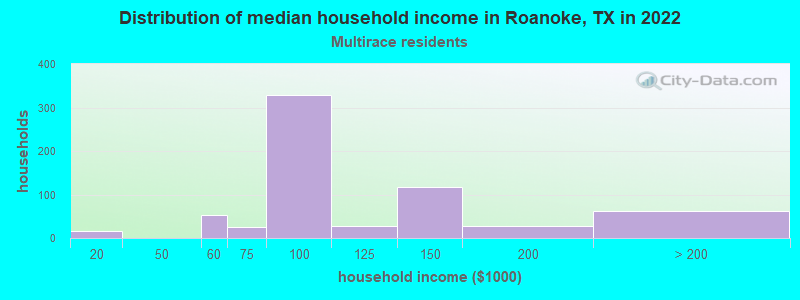
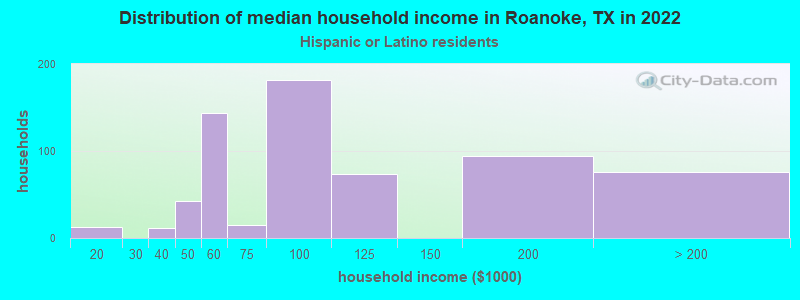
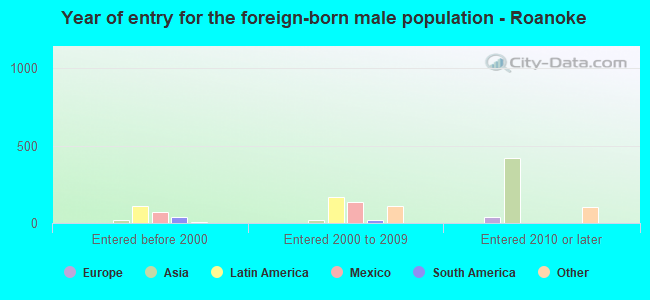
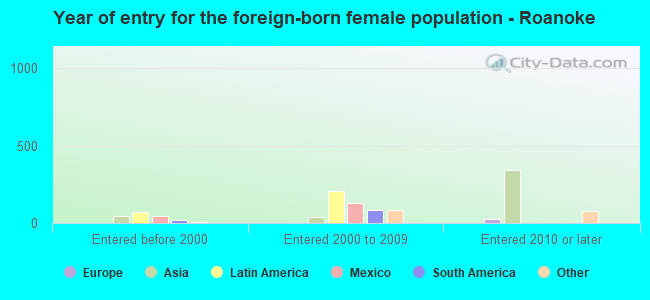
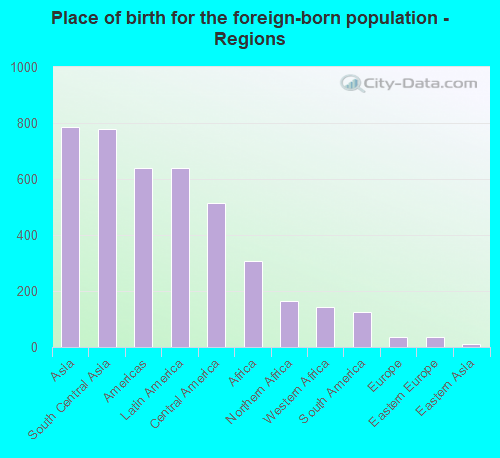
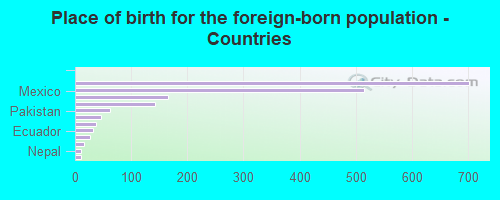
According to 2022 data, the most numerous races in Roanoke, TX are Hispanic (2,406 residents), White alone (5,479 residents), and Black alone (303 residents). 73.7% of Roanoke residents speak English at home. 17.4% of Roanoke, TX residents are foreign-born (7.9% born in Asia, 6.4% born in Latin America, 3.1% born in Africa), which is 2.0% greater than the foreign-born rate of 17.0% across the entire state of Texas.
Race distribution in Roanoke
2000 2022
10,933,313 52.4% White alone 6,669,666 32.0% Hispanic 2,364,255 11.3% Black alone 554,445 2.7% Asian alone 230,567 1.1% Two or more races 68,859 0.3% American Indian alone 19,958 0.10% Other race alone 10,757 0.05% Native Hawaiian and Other
12,070,642 40.2% Hispanic 11,683,430 38.9% White alone 3,508,706 11.7% Black alone 1,608,173 5.4% Asian alone 956,560 3.2% Two or more races 125,763 0.4% Other race alone 47,023 0.2% American Indian alone 29,275 0.10% Native Hawaiian and Other
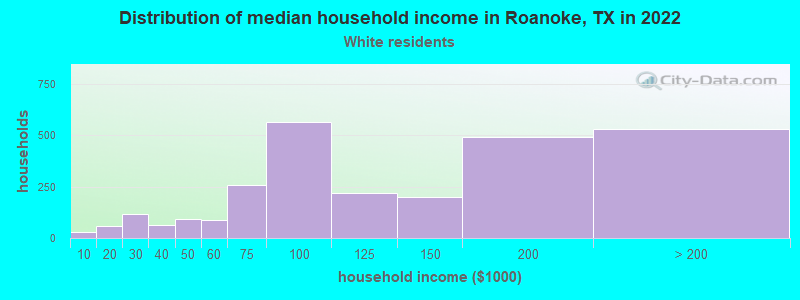
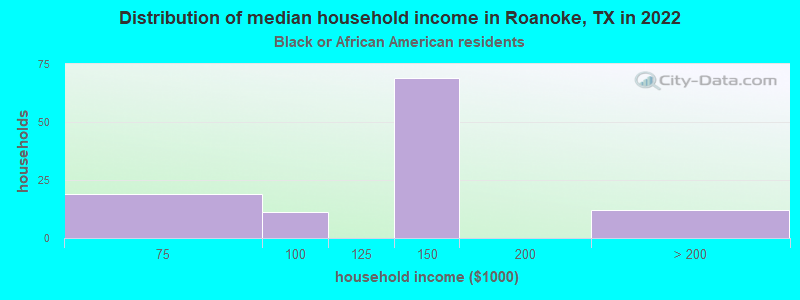
Income and house value in Roanoke Median household income in 2022 $104,224 White non-Hispanic householders$119,553 Black householders$118,768 Asian householders$79,495 Two or more races householders$76,100 Hispanic or Latino race householdersMedian 2022 house value $496,046 White Non-Hispanic householders$683,431 Black or African American householdersover $1,000,000 American Indian or Alaska Native householders $683,431 Asian householders$605,893 Some other race householders$541,277 Two or more races householders$469,206 Hispanic or Latino householders
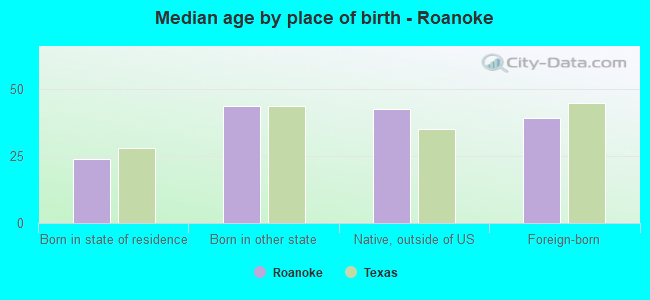
Median age by race in Roanoke
41.4 Median age for White residents41.9 40.5 48.9 Median age for Black or African American residents43.0 49.6 -689,873,417.0 Median age for American Indian / Alaska Native residents-700,803,212.2 -734,693,876.8 34.0 Median age for Asian residents34.8 33.3 -305,343,511.1 Median age for Native Hawaiian / Pacific Islander residents-601,801,801.2 -656,771,799.0 18.5 Median age for Other race residents15.5 28.4 40.4 Median age for Two or more races residents47.2 35.0 44.1 Median age for White alone residents43.5 44.1 29.7 Median age for Hispanic or Latino residents31.6 28.7
Owner/renter occupied households by race in Roanoke
House owners and renters - White residents 1,622 59.1% Owner occupied1,121 40.9% Renter occupiedHouse owners and renters - Black or African American residents 51 42.2% Owner occupied70 57.8% Renter occupiedHouse owners and renters - Asian residents 111 32.6% Owner occupied230 67.4% Renter occupiedHouse owners and renters - Other race residents 33 100.0% Owner occupiedHouse owners and renters - Two or more races residents 507 76.7% Owner occupied154 23.3% Renter occupiedHouse owners and renters - White alone residents 1,528 60.1% Owner occupied1,016 39.9% Renter occupiedHouse owners and renters - Hispanic or Latino residents 410 64.0% Owner occupied230 36.0% Renter occupied
Language usage in Roanoke
English speakers - Total 73.7% of residents of Roanoke speak English at home.
14.7% of residents speak Spanish at home 979 70.6% Speak English very well407 29.4% Speak English less than very well11.6% of residents speak other language at home 881 80.3% Speak English very well216 19.7% Speak English less than very well
English speakers - Born in the United States 90.4% of residents of Roanoke speak English at home.
8.0% of residents speak Spanish at home 287 100.0% Speak English very well2.0% of residents speak other language at home 71 100.0% Speak English very well
English speakers - Native, born elsewhere 70.9% of residents of Roanoke speak English at home.
30.5% of residents speak Spanish at home 86 98.9% Speak English very well1 1.1% Speak English less than very well
English speakers - Foreign-born 5.8% of residents of Roanoke speak English at home.
38.2% of residents speak Spanish at home 302 46.6% Speak English very well346 53.4% Speak English less than very well57.3% of residents speak other language at home 758 78.0% Speak English very well214 22.0% Speak English less than very well
White (Caucasian) - Speak another language Native:
4.8% (267)Foreign-born:
88.2% (153)
Asian - Speak only English Native:
40.3% (72)Foreign-born:
13.1% (84)
Asian - Speak another language Native:
58.3% (104)Foreign-born:
86.7% (555)
Other race - Speak another language Native:
40.3% (134)Foreign-born:
100.0% (76)
Two or more races - Speak only English Native:
82.2% (1,241)Foreign-born:
3.4% (27)
Two or more races - Speak another language Native:
18.5% (280)Foreign-born:
98.9% (794)
White alone - Speak another language Native:
2.4% (121)Foreign-born:
97.6% (136)
Hispanic or Latino - Speak only English Native:
60.7% (981)Foreign-born:
2.8% (18)
Hispanic or Latino - Speak another language Native:
39.8% (643)Foreign-born:
98.6% (652)
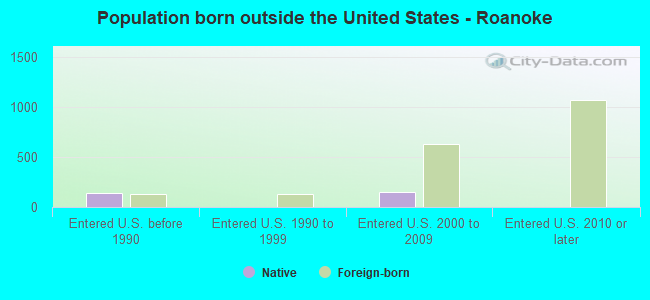
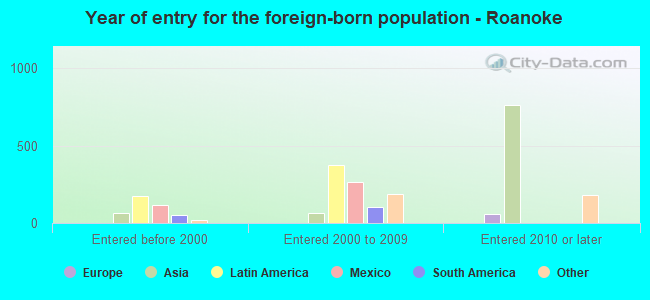
Foreign-born residents in Roanoke 1,773 residents are foreign born (7.9% Asia , 6.4% Latin America , 3.1% Africa ).
This city:
17.4%Texas:
17.1%
Marital status for residents in Roanoke Marital status - White (Caucasian) population 15 years and over
Males 30.6% Never married59.5% Now married0.0% Separated2.3% Widowed7.6% DivorcedFemales 21.9% Never married60.8% Now married0.9% Separated0.0% Widowed16.3% DivorcedWomen who gave birth in the past 12 months Now married:
100.0% (15)Unmarried:
0.0% (0)
Women who did not give birth in the past 12 months Now married:
63.5% (903)Unmarried:
36.5% (519)
Marital status - Black or African American population 15 years and over
Males 7.0% Never married93.0% Now married0.0% Separated0.0% Widowed0.0% DivorcedFemales 38.9% Never married21.7% Now married0.0% Separated0.0% Widowed39.5% DivorcedWomen who did not give birth in the past 12 months Now married:
11.2% (10)Unmarried:
88.8% (78)
Marital status - Asian population 15 years and over
Males 13.4% Never married86.6% Now married0.0% Separated0.0% Widowed0.0% DivorcedFemales 0.0% Never married100.0% Now married0.0% Separated0.0% Widowed0.0% DivorcedWomen who gave birth in the past 12 months Now married:
100.0% (58)Unmarried:
0.0% (0)
Women who did not give birth in the past 12 months Now married:
100.0% (271)Unmarried:
0.0% (0)
Marital status - Other race population 15 years and over
Males 77.6% Never married22.4% Now married0.0% Separated0.0% Widowed0.0% DivorcedFemales 32.9% Never married67.1% Now married0.0% Separated0.0% Widowed0.0% DivorcedWomen who did not give birth in the past 12 months Now married:
67.1% (79)Unmarried:
32.9% (39)
Marital status - Two or more races population 15 years and over
Males 29.0% Never married71.0% Now married0.0% Separated0.0% Widowed0.0% DivorcedFemales 16.2% Never married79.2% Now married2.0% Separated0.0% Widowed2.7% DivorcedWomen who gave birth in the past 12 months Now married:
100.0% (9)Unmarried:
0.0% (0)
Women who did not give birth in the past 12 months Now married:
81.3% (607)Unmarried:
18.7% (140)
Marital status - White alone, not Hispanic / Latino population 15 years and over
Males 32.9% Never married55.9% Now married0.0% Separated2.6% Widowed8.6% DivorcedFemales 19.4% Never married61.6% Now married1.1% Separated0.0% Widowed18.0% DivorcedWomen who gave birth in the past 12 months Now married:
100.0% (17)Unmarried:
0.0% (0)
Women who did not give birth in the past 12 months Now married:
65.3% (857)Unmarried:
34.7% (456)
Marital status - Hispanic or Latino population 15 years and over
Males 26.3% Never married73.7% Now married0.0% Separated0.0% Widowed0.0% DivorcedFemales 29.6% Never married66.9% Now married0.0% Separated0.0% Widowed3.5% DivorcedWomen who did not give birth in the past 12 months Now married:
66.5% (442)Unmarried:
33.5% (223)
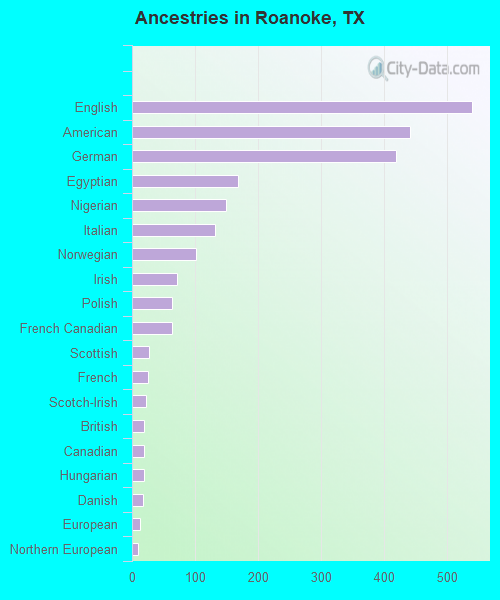
Ancestries in Roanoke
540 12.1% English442 9.9% American419 9.4% German168 3.8% Egyptian150 3.4% Nigerian132 3.0% Italian102 2.3% Norwegian72 1.6% Irish64 1.4% Polish63 1.4% French Canadian27 0.6% Scottish25 0.6% French23 0.5% Scotch-Irish19 0.4% British19 0.4% Canadian19 0.4% Hungarian18 0.4% Danish13 0.3% European10 0.2% Northern European
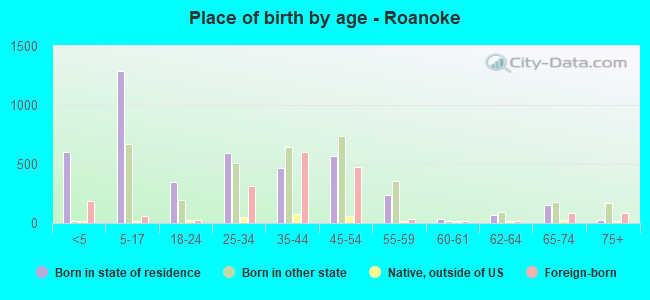
Children Nativity (place of birth) in Roanoke
Children under 6 years - Living with two parents Both parents native 531 96.8% Native18 3.2% Foreign-bornBoth parents foreign-born 108 50.7% Native105 49.3% Foreign-bornOne native, one foreign-born parent 69 100.0% NativeChildren under 6 years - Living with one parent Native parent 86 100.0% NativeChildren 6 to 17 years - Living with two parents Both parents native 935 99.8% Native2 0.2% Foreign-bornBoth parents foreign-born 284 91.3% Native27 8.7% Foreign-bornOne native, one foreign-born parent 282 100.0% NativeChildren 6 to 17 years - Living with one parent Native parent 139 75.9% Native44 24.1% Foreign-bornForeign-born parent 31 100.0% Native
Grandparents responsible for own grandchildren in Roanoke
Grandparents (30 to 59 years) White / Caucasian 17 100.0% Not responsible for grandchildrenWhite alone, not Hispanic / Latino 21 100.0% Not responsible for grandchildren
Grandparents (60 years and over) White / Caucasian 53 100.0% Not responsible for grandchildrenWhite alone, not Hispanic / Latino 62 100.0% Not responsible for grandchildren