Races in Robertsville, New Jersey (NJ) Detailed Stats
Data:
Races - White alone (%)
Races - White alone (% change since 2000)
Races - Black alone (%)
Races - Black alone (% change since 2000)
Races - American Indian alone (%)
Races - American Indian alone (% change since 2000)
Races - Asian alone (%)
Races - Asian alone (% change since 2000)
Races - Hispanic (%)
Races - Hispanic (% change since 2000)
Races - Native Hawaiian and Other Pacific Islander alone (%)
Races - Native Hawaiian and Other Pacific Islander alone (% change since 2000)
Races - Two or more races(%)
Races - Two or more races(% change since 2000)
Races - Other race alone (%)
Races - Other race alone (% change since 2000)
Racial diversity
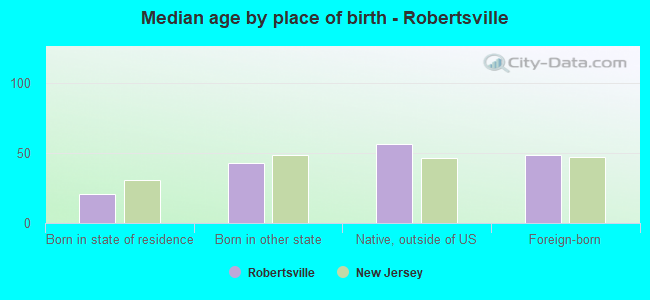
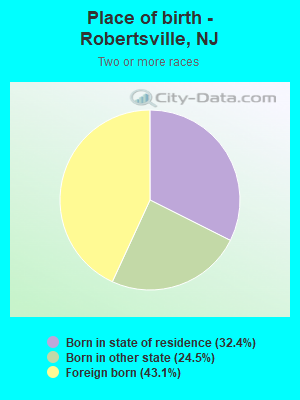
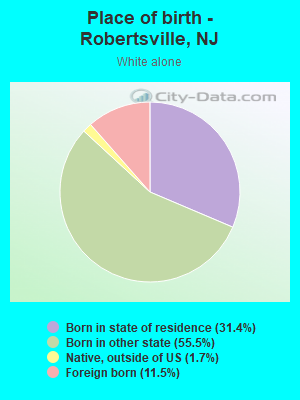
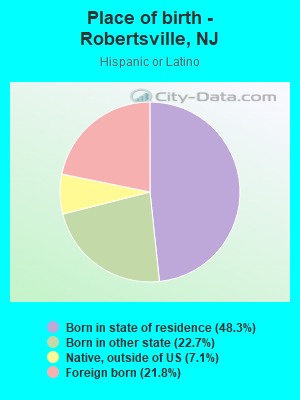
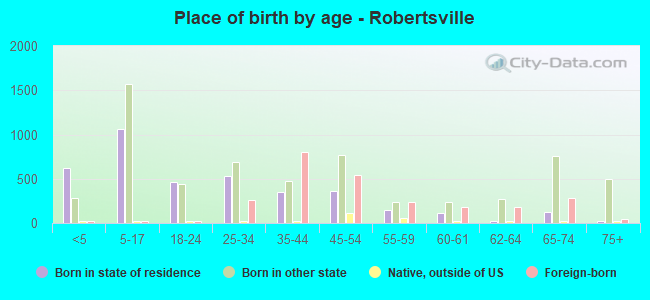
Place of birth - Born in state of residence (%)
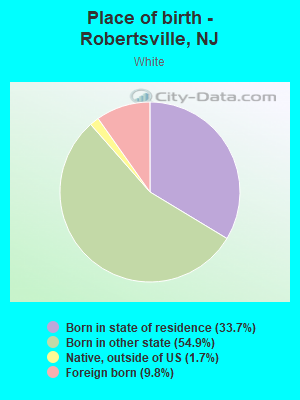
Place of birth - Born in state of residence (%) - White
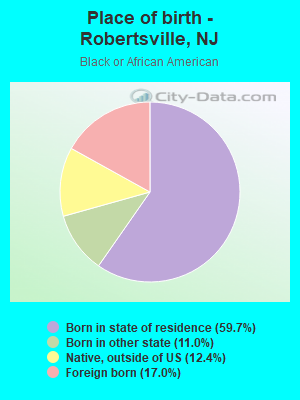
Place of birth - Born in state of residence (%) - Black or African American
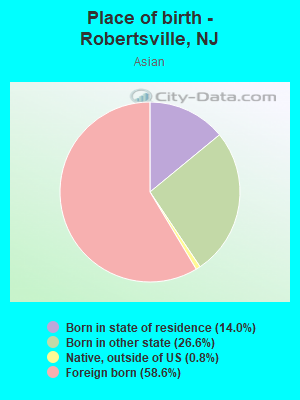
Place of birth - Born in state of residence (%) - Asian
Place of birth - Born in state of residence (%) - Hispanic or Latino
Place of birth - Born in state of residence (%) - American Indian and Alaska Native
Place of birth - Born in state of residence (%) - Multirace
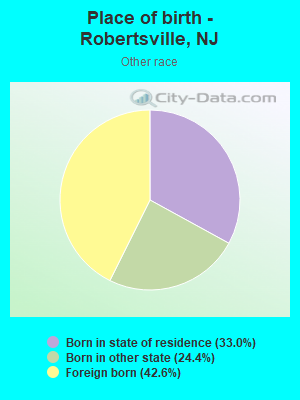
Place of birth - Born in state of residence (%) - Other Race
Place of birth - Born in other state (%)
Place of birth - Born in other state (%) - White
Place of birth - Born in other state (%) - Black or African American
Place of birth - Born in other state (%) - Asian
Place of birth - Born in other state (%) - Hispanic or Latino
Place of birth - Born in other state (%) - American Indian and Alaska Native
Place of birth - Born in other state (%) - Multirace
Place of birth - Born in other state (%) - Other Race
Place of birth - Native, outside of US (%)
Place of birth - Native, outside of US (%) - White
Place of birth - Native, outside of US (%) - Black or African American
Place of birth - Native, outside of US (%) - Asian
Place of birth - Native, outside of US (%) - Hispanic or Latino
Place of birth - Native, outside of US (%) - American Indian and Alaska Native
Place of birth - Native, outside of US (%) - Multirace
Place of birth - Native, outside of US (%) - Other Race
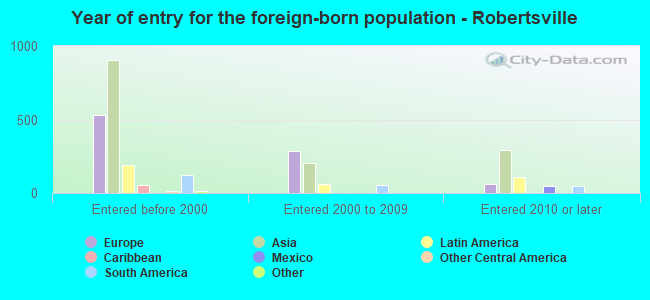
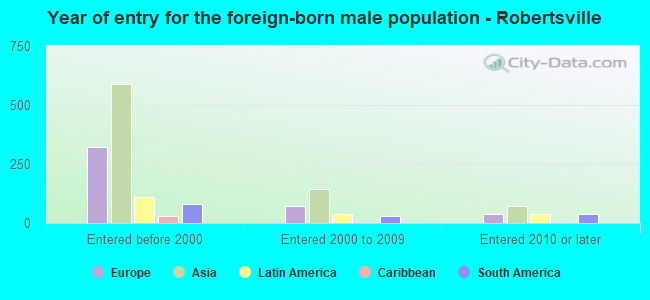
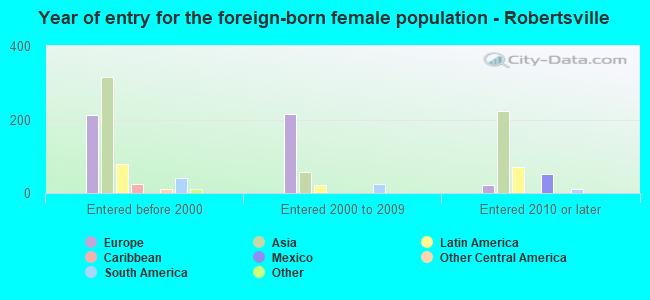
Place of birth - Foreign born (%)
Place of birth - Foreign born (%) - White
Place of birth - Foreign born (%) - Black or African American
Place of birth - Foreign born (%) - Asian
Place of birth - Foreign born (%) - Hispanic or Latino
Place of birth - Foreign born (%) - American Indian and Alaska Native
Place of birth - Foreign born (%) - Multirace
Place of birth - Foreign born (%) - Other Race
Residents speaking English at home (%)
Residents speaking English at home - Born in the United States (%)
Residents speaking English at home - Native, born elsewhere (%)
Residents speaking English at home - Foreign born (%)
Residents speaking Spanish at home (%)
Residents speaking Spanish at home - Born in the United States (%)
Residents speaking Spanish at home - Native, born elsewhere (%)
Residents speaking Spanish at home - Foreign born (%)
Residents speaking other language at home (%)
Residents speaking other language at home - Born in the United States (%)
Residents speaking other language at home - Native, born elsewhere (%)
Residents speaking other language at home - Foreign born (%)
Marital status - Never married (%)
Marital status - Now married (%)
Marital status - Separated (%)
Marital status - Widowed (%)
Marital status - Divorced (%)
Ancestries Reported - Arab (%)
Ancestries Reported - Czech (%)
Ancestries Reported - Danish (%)
Ancestries Reported - Dutch (%)
Ancestries Reported - English (%)
Ancestries Reported - French (%)
Ancestries Reported - French Canadian (%)
Ancestries Reported - German (%)
Ancestries Reported - Greek (%)
Ancestries Reported - Hungarian (%)
Ancestries Reported - Irish (%)
Ancestries Reported - Italian (%)
Ancestries Reported - Lithuanian (%)
Ancestries Reported - Norwegian (%)
Ancestries Reported - Polish (%)
Ancestries Reported - Portuguese (%)
Ancestries Reported - Russian (%)
Ancestries Reported - Scotch-Irish (%)
Ancestries Reported - Scottish (%)
Ancestries Reported - Slovak (%)
Ancestries Reported - Subsaharan African (%)
Ancestries Reported - Swedish (%)
Ancestries Reported - Swiss (%)
Ancestries Reported - Ukrainian (%)
Ancestries Reported - United States (%)
Ancestries Reported - Welsh (%)
Ancestries Reported - West Indian (%)
Ancestries Reported - Other (%)
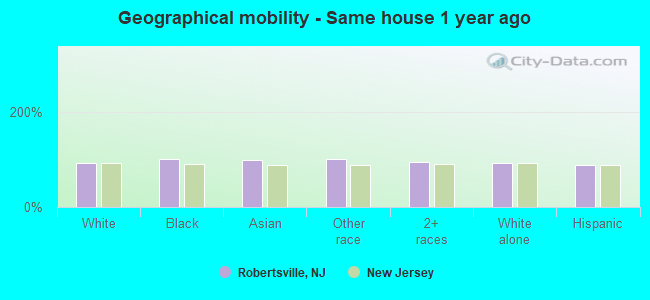
Geographical mobility - Same house 1 year ago (%)
Geographical mobility - Same house 1 year ago (%) - White
Geographical mobility - Same house 1 year ago (%) - Black or African American
Geographical mobility - Same house 1 year ago (%) - Asian
Geographical mobility - Same house 1 year ago (%) - Hispanic or Latino
Geographical mobility - Same house 1 year ago (%) - American Indian and Alaska Native
Geographical mobility - Same house 1 year ago (%) - Multirace
Geographical mobility - Same house 1 year ago (%) - Other Race
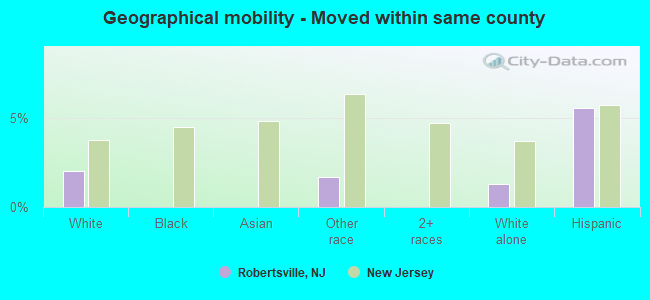
Geographical mobility - Moved within same county (%)
Geographical mobility - Moved within same county (%) - White
Geographical mobility - Moved within same county (%) - Black or African American
Geographical mobility - Moved within same county (%) - Asian
Geographical mobility - Moved within same county (%) - Hispanic or Latino
Geographical mobility - Moved within same county (%) - American Indian and Alaska Native
Geographical mobility - Moved within same county (%) - Multirace
Geographical mobility - Moved within same county (%) - Other Race
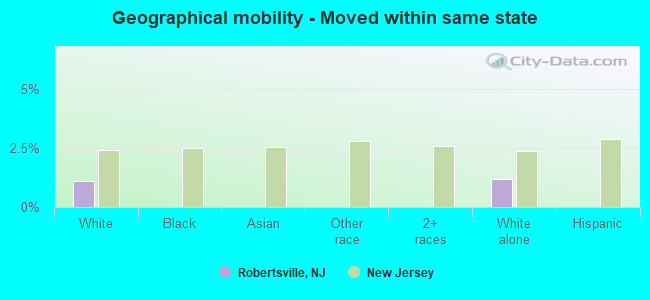
Geographical mobility - Moved from different county within same state (%)
Geographical mobility - Moved from different county within same state (%) - White
Geographical mobility - Moved from different county within same state (%) - Black or African American
Geographical mobility - Moved from different county within same state (%) - Asian
Geographical mobility - Moved from different county within same state (%) - Hispanic or Latino
Geographical mobility - Moved from different county within same state (%) - American Indian and Alaska Native
Geographical mobility - Moved from different county within same state (%) - Multirace
Geographical mobility - Moved from different county within same state (%) - Other Race
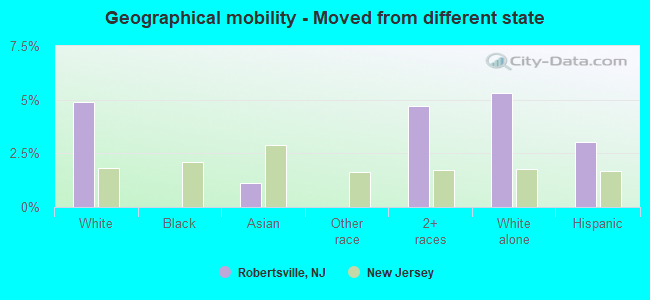
Geographical mobility - Moved from different state (%)
Geographical mobility - Moved from different state (%) - White
Geographical mobility - Moved from different state (%) - Black or African American
Geographical mobility - Moved from different state (%) - Asian
Geographical mobility - Moved from different state (%) - Hispanic or Latino
Geographical mobility - Moved from different state (%) - American Indian and Alaska Native
Geographical mobility - Moved from different state (%) - Multirace
Geographical mobility - Moved from different state (%) - Other Race
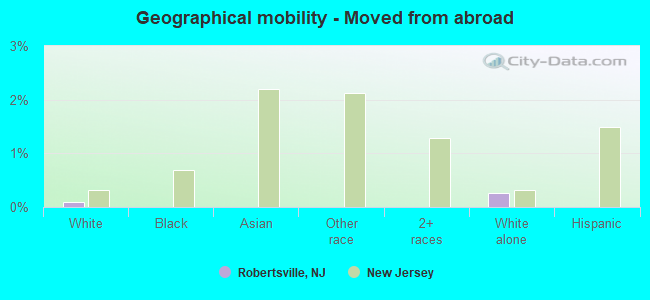
Geographical mobility - Moved from abroad (%)
Geographical mobility - Moved from abroad (%) - White
Geographical mobility - Moved from abroad (%) - Black or African American
Geographical mobility - Moved from abroad (%) - Asian
Geographical mobility - Moved from abroad (%) - Hispanic or Latino
Geographical mobility - Moved from abroad (%) - American Indian and Alaska Native
Geographical mobility - Moved from abroad (%) - Multirace
Geographical mobility - Moved from abroad (%) - Other Race
Place of birth for the foreign-born population - Ireland (%)
Place of birth for the foreign-born population - Denmark (%)
Place of birth for the foreign-born population - Norway (%)
Place of birth for the foreign-born population - Sweden (%)
Place of birth for the foreign-born population - United Kingdom (%)
Place of birth for the foreign-born population - England (%)
Place of birth for the foreign-born population - Scotland (%)
Place of birth for the foreign-born population - Other Northern Europe (%)
Place of birth for the foreign-born population - Austria (%)
Place of birth for the foreign-born population - Belgium (%)
Place of birth for the foreign-born population - France (%)
Place of birth for the foreign-born population - Germany (%)
Place of birth for the foreign-born population - Netherlands (%)
Place of birth for the foreign-born population - Switzerland (%)
Place of birth for the foreign-born population - Other Western Europe (%)
Place of birth for the foreign-born population - Greece (%)
Place of birth for the foreign-born population - Italy (%)
Place of birth for the foreign-born population - Portugal (%)
Place of birth for the foreign-born population - Spain (%)
Place of birth for the foreign-born population - Other Southern Europe (%)
Place of birth for the foreign-born population - Albania (%)
Place of birth for the foreign-born population - Belarus (%)
Place of birth for the foreign-born population - Bosnia and Herzegovina (%)
Place of birth for the foreign-born population - Bulgaria (%)
Place of birth for the foreign-born population - Croatia (%)
Place of birth for the foreign-born population - Czechoslovakia (%)
Place of birth for the foreign-born population - Hungary (%)
Place of birth for the foreign-born population - Latvia (%)
Place of birth for the foreign-born population - Lithuania (%)
Place of birth for the foreign-born population - North Macedonia (Macedonia) (%)
Place of birth for the foreign-born population - Moldova (%)
Place of birth for the foreign-born population - Poland (%)
Place of birth for the foreign-born population - Romania (%)
Place of birth for the foreign-born population - Russia (%)
Place of birth for the foreign-born population - Serbia (%)
Place of birth for the foreign-born population - Ukraine (%)
Place of birth for the foreign-born population - Other Eastern Europe (%)
Place of birth for the foreign-born population - China (%)
Place of birth for the foreign-born population - Hong Kong (%)
Place of birth for the foreign-born population - Taiwan (%)
Place of birth for the foreign-born population - Japan (%)
Place of birth for the foreign-born population - Korea (%)
Place of birth for the foreign-born population - Other Eastern Asia (%)
Place of birth for the foreign-born population - Afghanistan (%)
Place of birth for the foreign-born population - Bangladesh (%)
Place of birth for the foreign-born population - India (%)
Place of birth for the foreign-born population - Iran (%)
Place of birth for the foreign-born population - Kazakhstan (%)
Place of birth for the foreign-born population - Nepal (%)
Place of birth for the foreign-born population - Pakistan (%)
Place of birth for the foreign-born population - Sri Lanka (%)
Place of birth for the foreign-born population - Uzbekistan (%)
Place of birth for the foreign-born population - Other South Central Asia (%)
Place of birth for the foreign-born population - Burma (%)
Place of birth for the foreign-born population - Cambodia (%)
Place of birth for the foreign-born population - Indonesia (%)
Place of birth for the foreign-born population - Laos (%)
Place of birth for the foreign-born population - Malaysia (%)
Place of birth for the foreign-born population - Philippines (%)
Place of birth for the foreign-born population - Singapore (%)
Place of birth for the foreign-born population - Thailand (%)
Place of birth for the foreign-born population - Vietnam (%)
Place of birth for the foreign-born population - Other South Eastern Asia (%)
Place of birth for the foreign-born population - Armenia (%)
Place of birth for the foreign-born population - Iraq (%)
Place of birth for the foreign-born population - Israel (%)
Place of birth for the foreign-born population - Jordan (%)
Place of birth for the foreign-born population - Kuwait (%)
Place of birth for the foreign-born population - Lebanon (%)
Place of birth for the foreign-born population - Saudi Arabia (%)
Place of birth for the foreign-born population - Syria (%)
Place of birth for the foreign-born population - Turkey (%)
Place of birth for the foreign-born population - Yemen (%)
Place of birth for the foreign-born population - Other Western Asia (%)
Place of birth for the foreign-born population - Eritrea (%)
Place of birth for the foreign-born population - Ethiopia (%)
Place of birth for the foreign-born population - Kenya (%)
Place of birth for the foreign-born population - Somalia (%)
Place of birth for the foreign-born population - Uganda (%)
Place of birth for the foreign-born population - Zimbabwe (%)
Place of birth for the foreign-born population - Other Eastern Africa (%)
Place of birth for the foreign-born population - Cameroon (%)
Place of birth for the foreign-born population - Congo (%)
Place of birth for the foreign-born population - Democratic Republic of Congo (Zaire) (%)
Place of birth for the foreign-born population - Other Middle Africa (%)
Place of birth for the foreign-born population - Egypt (%)
Place of birth for the foreign-born population - Morocco (%)
Place of birth for the foreign-born population - Sudan (%)
Place of birth for the foreign-born population - Other Northern Africa (%)
Place of birth for the foreign-born population - South Africa (%)
Place of birth for the foreign-born population - Other Southern Africa (%)
Place of birth for the foreign-born population - Cabo Verde (%)
Place of birth for the foreign-born population - Ghana (%)
Place of birth for the foreign-born population - Liberia (%)
Place of birth for the foreign-born population - Nigeria (%)
Place of birth for the foreign-born population - Senegal (%)
Place of birth for the foreign-born population - Sierra Leone (%)
Place of birth for the foreign-born population - Other Western Africa (%)
Place of birth for the foreign-born population - Australia (%)
Place of birth for the foreign-born population - New Zealand (%)
Place of birth for the foreign-born population - Fiji (%)
Place of birth for the foreign-born population - Micronesia (%)
Place of birth for the foreign-born population - Bahamas (%)
Place of birth for the foreign-born population - Barbados (%)
Place of birth for the foreign-born population - Cuba (%)
Place of birth for the foreign-born population - Dominica (%)
Place of birth for the foreign-born population - Dominican Republic (%)
Place of birth for the foreign-born population - Grenada (%)
Place of birth for the foreign-born population - Haiti (%)
Place of birth for the foreign-born population - Jamaica (%)
Place of birth for the foreign-born population - St. Vincent and the Grenadines (%)
Place of birth for the foreign-born population - Trinidad and Tobago (%)
Place of birth for the foreign-born population - West Indies (%)
Place of birth for the foreign-born population - Other Caribbean (%)
Place of birth for the foreign-born population - Belize (%)
Place of birth for the foreign-born population - Costa Rica (%)
Place of birth for the foreign-born population - El Salvador (%)
Place of birth for the foreign-born population - Guatemala (%)
Place of birth for the foreign-born population - Honduras (%)
Place of birth for the foreign-born population - Mexico (%)
Place of birth for the foreign-born population - Nicaragua (%)
Place of birth for the foreign-born population - Panama (%)
Place of birth for the foreign-born population - Other Central America (%)
Place of birth for the foreign-born population - Argentina (%)
Place of birth for the foreign-born population - Bolivia (%)
Place of birth for the foreign-born population - Brazil (%)
Place of birth for the foreign-born population - Chile (%)
Place of birth for the foreign-born population - Colombia (%)
Place of birth for the foreign-born population - Ecuador (%)
Place of birth for the foreign-born population - Guyana (%)
Place of birth for the foreign-born population - Peru (%)
Place of birth for the foreign-born population - Uruguay (%)
Place of birth for the foreign-born population - Venezuela (%)
Place of birth for the foreign-born population - Other South America (%)
Place of birth for the foreign-born population - Canada (%)
Place of birth for the foreign-born population - Other Northern America (%)
Place of birth for the foreign-born population - Other (%)
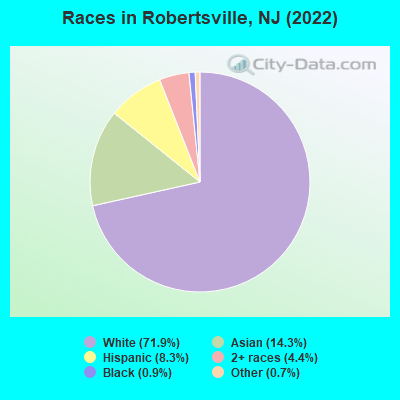
According to 2022 data, the most numerous races in Robertsville, NJ are White alone (9,105 residents), Hispanic (1,051 residents), and Black alone (112 residents). 70.0% of Robertsville residents speak English at home.
Race distribution in Robertsville 9,105 71.9% White alone 1,806 14.3% Asian alone 1,051 8.3% Hispanic 563 4.4% Two or more races 112 0.9% Black alone 90 0.7% Other race alone
2000 2022
5,557,209 66.0% White alone 1,117,191 13.3% Hispanic 1,096,171 13.0% Black alone 477,012 5.7% Asian alone 133,689 1.6% Two or more races 19,565 0.2% Other race alone 11,338 0.1% American Indian alone 2,175 0.03% Native Hawaiian and Other
4,766,476 51.5% White alone 2,028,470 21.9% Hispanic 1,111,632 12.0% Black alone 923,546 10.0% Asian alone 332,237 3.6% Two or more races 89,847 1.0% Other race alone 8,557 0.09% American Indian alone 934 0.01% Native Hawaiian and Other
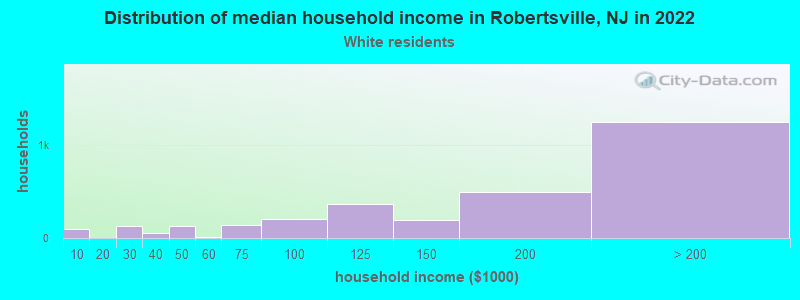
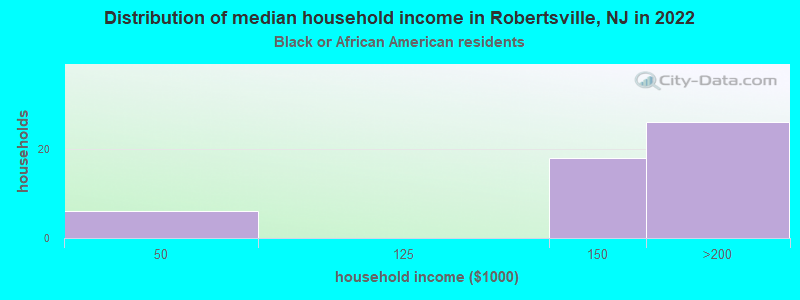
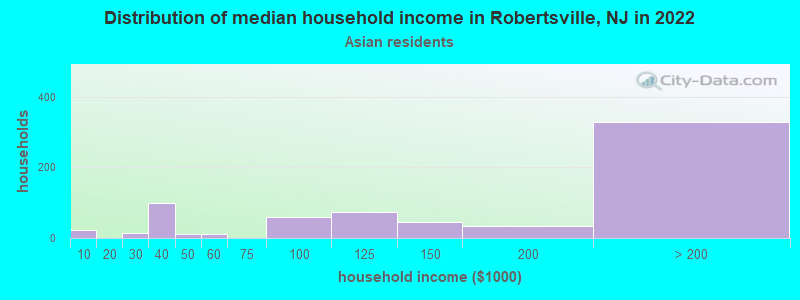
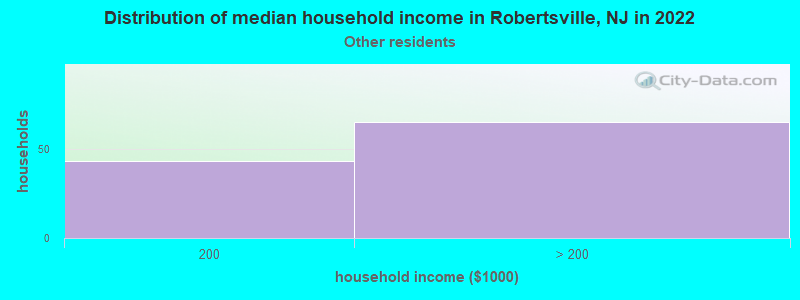
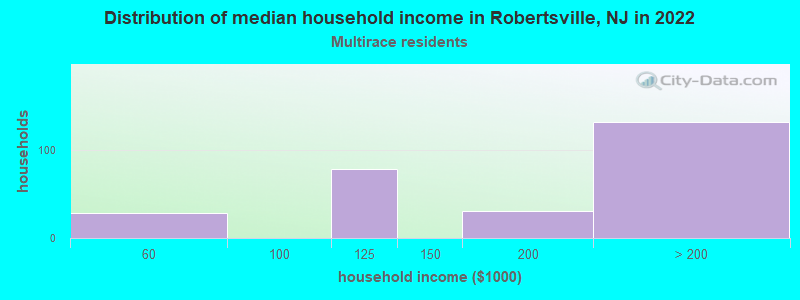
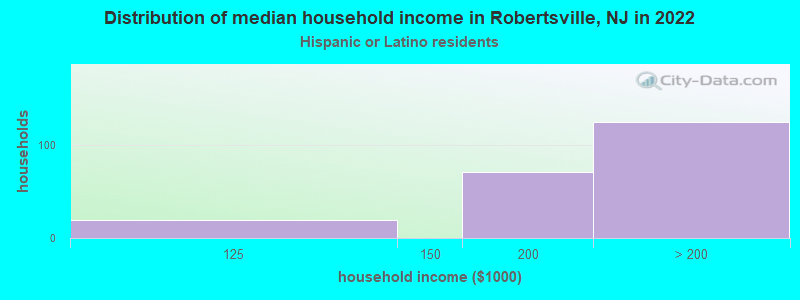
Income and house value in Robertsville Median household income in 2022 $167,691 White non-Hispanic householders$98,873 Black householders$188,673 Asian householdersover $200,000 Some other race householdersover $200,000 Two or more races householdersover $200,000 Hispanic or Latino race householders
Median age by race in Robertsville
40.4 Median age for White residents42.4 38.3 31.3 Median age for Black or African American residents29.3 22.5 -501,872,658.7 Median age for American Indian / Alaska Native residents-594,464,500.0 -447,596,532.3 43.8 Median age for Asian residents42.8 44.0 -804,177,544.9 Median age for Native Hawaiian / Pacific Islander residents-860,335,194.7 -713,070,378.3 57.7 Median age for Other race residents54.9 63.7 35.0 Median age for Two or more races residents36.7 27.0 40.3 Median age for White alone residents42.1 39.5 34.3 Median age for Hispanic or Latino residents33.8 34.3
Owner/renter occupied households by race in Robertsville
House owners and renters - White residents 2,920 92.3% Owner occupied242 7.7% Renter occupiedHouse owners and renters - Black or African American residents 42 100.0% Owner occupiedHouse owners and renters - Asian residents 652 91.5% Owner occupied60 8.5% Renter occupiedHouse owners and renters - Other race residents 57 56.4% Owner occupied44 43.6% Renter occupiedHouse owners and renters - Two or more races residents 277 100.0% Owner occupiedHouse owners and renters - White alone residents 2,875 92.6% Owner occupied229 7.4% Renter occupiedHouse owners and renters - Hispanic or Latino residents 146 71.5% Owner occupied58 28.5% Renter occupied
Language usage in Robertsville
English speakers - Total 70.0% of residents of Robertsville speak English at home.
3.5% of residents speak Spanish at home 241 57.5% Speak English very well178 42.5% Speak English less than very well28.7% of residents speak other language at home 2,647 78.2% Speak English very well739 21.8% Speak English less than very well
English speakers - Born in the United States 85.8% of residents of Robertsville speak English at home.
1.8% of residents speak Spanish at home 64 61.0% Speak English very well41 39.0% Speak English less than very well14.5% of residents speak other language at home 734 87.6% Speak English very well104 12.4% Speak English less than very well
English speakers - Native, born elsewhere 26.0% of residents of Robertsville speak English at home.
20.0% of residents speak Spanish at home 50 100.0% Speak English very well59.6% of residents speak other language at home 149 100.0% Speak English very well
English speakers - Foreign-born 9.6% of residents of Robertsville speak English at home.
9.2% of residents speak Spanish at home 78 33.6% Speak English very well154 66.4% Speak English less than very well86.2% of residents speak other language at home 1,562 71.8% Speak English very well613 28.2% Speak English less than very well
White (Caucasian) - Speak only English Native:
91.5% (7,036)Foreign-born:
9.7% (89)
White (Caucasian) - Speak another language Native:
7.6% (584)Foreign-born:
91.1% (836)
Black or African American - Speak only English Native:
59.7% (56)Foreign-born:
54.0% (11)
Black or African American - Speak another language Native:
49.8% (47)Foreign-born:
46.0% (9)
Asian - Speak only English Native:
35.3% (247)Foreign-born:
4.6% (49)
Asian - Speak another language Native:
69.7% (487)Foreign-born:
98.5% (1,053)
Two or more races - Speak only English Native:
90.3% (377)Foreign-born:
20.3% (65)
Two or more races - Speak another language Native:
11.5% (48)Foreign-born:
66.3% (212)
White alone - Speak only English Native:
91.6% (6,728)Foreign-born:
8.8% (93)
White alone - Speak another language Native:
8.0% (586)Foreign-born:
96.8% (1,019)
Hispanic or Latino - Speak another language Native:
18.7% (145)Foreign-born:
96.5% (221)
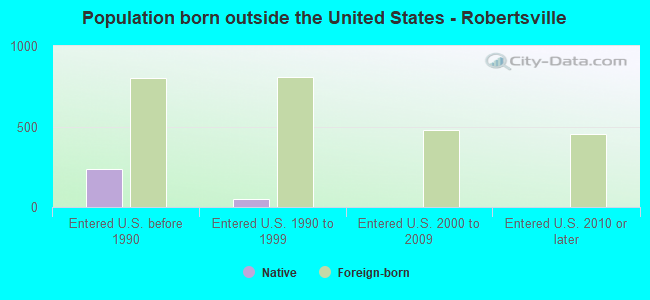
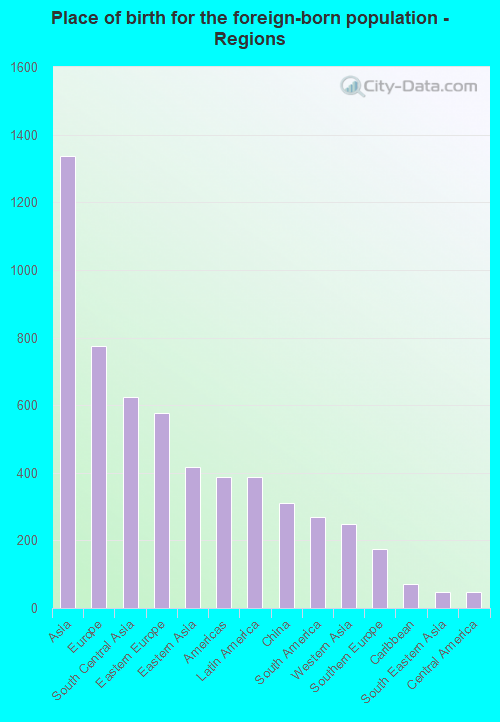
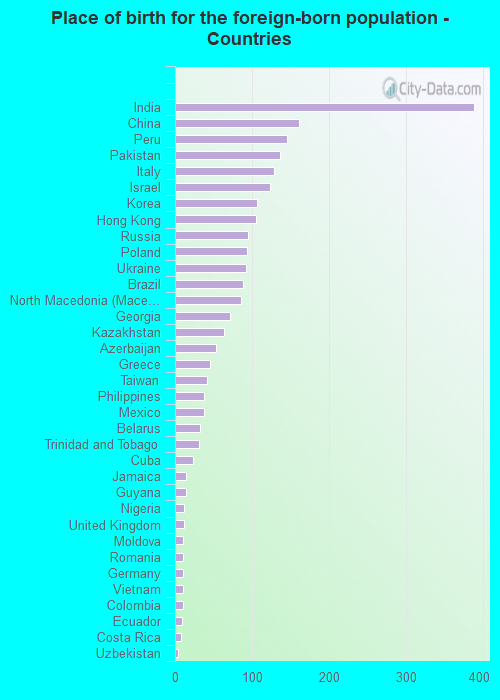
Foreign-born residents in Robertsville
Marital status for residents in Robertsville Marital status - White (Caucasian) population 15 years and over
Males 23.2% Never married72.2% Now married0.2% Separated1.4% Widowed3.0% DivorcedFemales 27.9% Never married60.2% Now married0.0% Separated4.8% Widowed7.0% DivorcedWomen who gave birth in the past 12 months Now married:
100.0% (147)Unmarried:
0.0% (0)
Women who did not give birth in the past 12 months Now married:
47.8% (1,032)Unmarried:
52.2% (1,127)
Marital status - Black or African American population 15 years and over
Males 47.7% Never married52.3% Now married0.0% Separated0.0% Widowed0.0% DivorcedFemales 39.2% Never married15.7% Now married0.0% Separated23.5% Widowed21.6% DivorcedWomen who did not give birth in the past 12 months Now married:
0.0% (0)Unmarried:
100.0% (17)
Marital status - Asian population 15 years and over
Males 36.1% Never married62.6% Now married0.0% Separated0.0% Widowed1.3% DivorcedFemales 21.9% Never married74.8% Now married0.0% Separated0.0% Widowed3.3% DivorcedWomen who did not give birth in the past 12 months Now married:
54.1% (220)Unmarried:
45.9% (187)
Marital status - Other race population 15 years and over
Males 48.2% Never married51.8% Now married0.0% Separated0.0% Widowed0.0% DivorcedFemales 31.9% Never married68.1% Now married0.0% Separated0.0% Widowed0.0% DivorcedWomen who did not give birth in the past 12 months Now married:
41.9% (49)Unmarried:
58.1% (67)
Marital status - Two or more races population 15 years and over
Males 10.5% Never married80.0% Now married9.5% Separated0.0% Widowed0.0% DivorcedFemales 37.9% Never married62.1% Now married0.0% Separated0.0% Widowed0.0% DivorcedWomen who did not give birth in the past 12 months Now married:
59.0% (210)Unmarried:
41.0% (146)
Marital status - White alone, not Hispanic / Latino population 15 years and over
Males 23.7% Never married71.6% Now married0.2% Separated1.4% Widowed3.1% DivorcedFemales 27.4% Never married60.2% Now married0.0% Separated4.9% Widowed7.5% DivorcedWomen who gave birth in the past 12 months Now married:
100.0% (153)Unmarried:
0.0% (0)
Women who did not give birth in the past 12 months Now married:
47.7% (986)Unmarried:
52.3% (1,080)
Marital status - Hispanic or Latino population 15 years and over
Males 31.8% Never married68.2% Now married0.0% Separated0.0% Widowed0.0% DivorcedFemales 38.0% Never married59.8% Now married0.0% Separated2.2% Widowed0.0% DivorcedWomen who did not give birth in the past 12 months Now married:
44.8% (146)Unmarried:
55.2% (180)
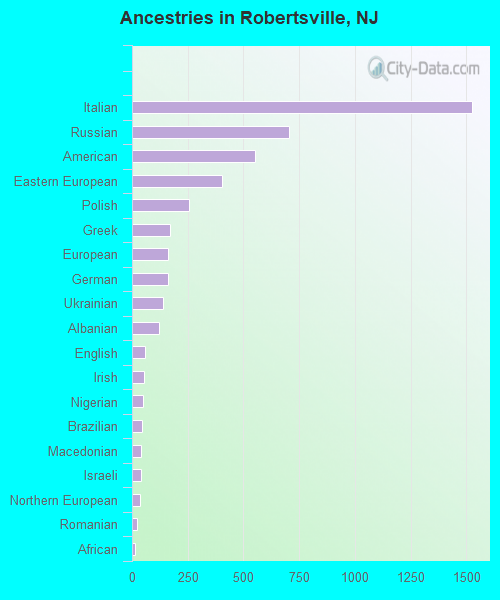
Ancestries in Robertsville
1,525 22.0% Italian706 10.2% Russian550 7.9% American402 5.8% Eastern European257 3.7% Polish169 2.4% Greek161 2.3% European161 2.3% German140 2.0% Ukrainian121 1.7% Albanian60 0.9% English53 0.8% Irish50 0.7% Nigerian43 0.6% Brazilian40 0.6% Macedonian39 0.6% Israeli34 0.5% Northern European23 0.3% Romanian14 0.2% African10 0.1% Jamaican8 0.1% Hungarian5 0.07% Scottish
Children Nativity (place of birth) in Robertsville
Children under 6 years - Living with two parents Both parents native 605 100.0% NativeBoth parents foreign-born 179 100.0% NativeOne native, one foreign-born parent 107 100.0% NativeChildren under 6 years - Living with one parent Native parent 2 100.0% NativeForeign-born parent 64 100.0% NativeChildren 6 to 17 years - Living with two parents Both parents native 913 100.0% NativeBoth parents foreign-born 772 96.8% Native26 3.2% Foreign-bornOne native, one foreign-born parent 121 100.0% NativeChildren 6 to 17 years - Living with one parent Native parent 173 100.0% NativeForeign-born parent 99 48.9% Native103 51.1% Foreign-born