Races in Rockhill Furnace, Pennsylvania (PA) Detailed Stats
Ancestries, Foreign-born residents, place of birth

Discuss Rockhill Furnace, Pennsylvania races on our local forum with over 2,400,000 registered users
1.0% of Rockhill Furnace, PA residents are foreign-born , which is 624.5% less than the foreign-born rate of 7.0% across the entire state of Pennsylvania.
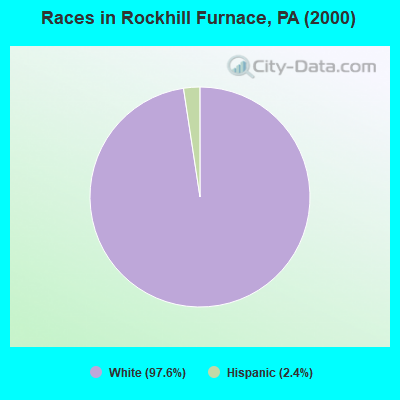
Race distribution in Rockhill Furnace

- 40497.6%White alone
- 102.4%Hispanic
2000
2022
-
- 10,322,45584.1%White alone
- 1,202,4379.8%Black alone
- 394,0883.2%Hispanic
- 218,2961.8%Asian alone
- 113,0970.9%Two or more races
- 13,0860.1%Other race alone
- 14,9040.1%American Indian alone
- 2,6910.02%Native Hawaiian and Other
Pacific Islander alone

-
- 9,487,22873.1%White alone
- 1,311,58110.1%Black alone
- 1,115,9978.6%Hispanic
- 493,9423.8%Two or more races
- 487,1243.8%Asian alone
- 63,5820.5%Other race alone
- 10,1300.08%American Indian alone
- 2,4240.02%Native Hawaiian and Other
Pacific Islander alone

Income and house value in Rockhill Furnace
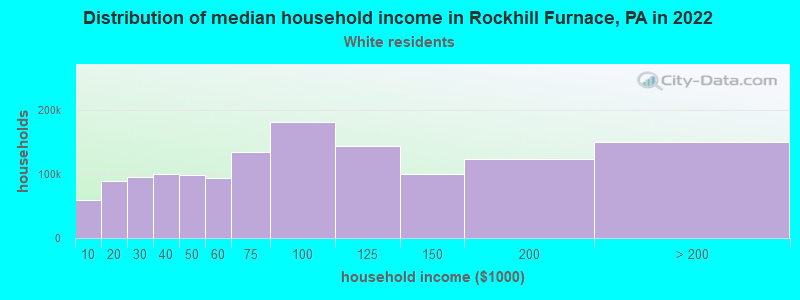
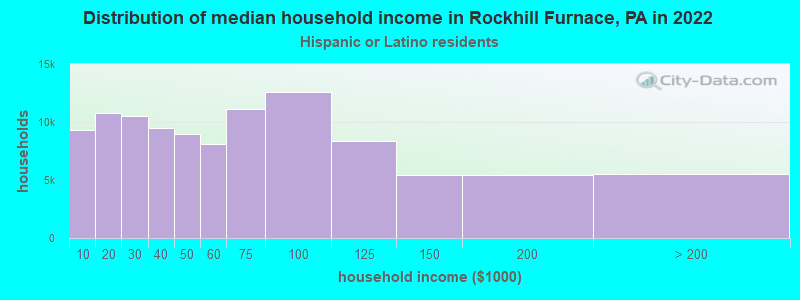
- Median household income in 2022
- $50,049White non-Hispanic householders
- $29,572Hispanic or Latino race householders
- Median 2022 house value
- $151,487White Non-Hispanic householders
- $127,729Hispanic or Latino householders
Household income for White non-Hispanic householders
Household income for Hispanic or Latino race householders
Foreign-born residents in Rockhill Furnace
4 residents are foreign born
| This city: | 1.0% |
| Pennsylvania: | 4.1% |
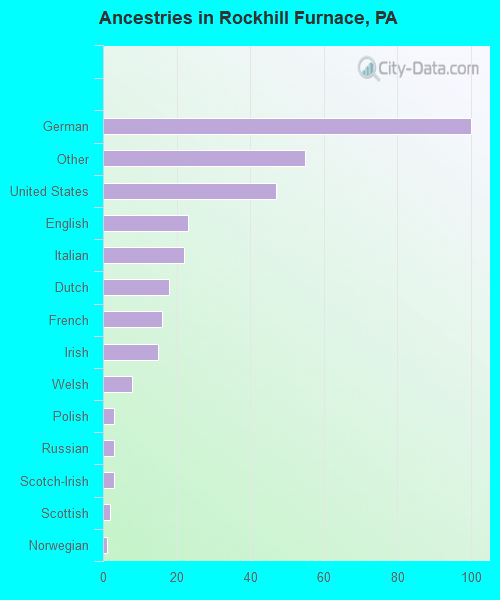
Ancestries in Rockhill Furnace

- 10031.6%German
- 5517.4%Other
- 4714.9%United States
- 237.3%English
- 227.0%Italian
- 185.7%Dutch
- 165.1%French
- 154.7%Irish
- 82.5%Welsh
- 30.9%Polish
- 30.9%Russian
- 30.9%Scotch-Irish
- 20.6%Scottish
- 10.3%Norwegian
Zip codes: 17243.