Races in Rockland, New York (NY) Detailed Stats
Ancestries, Foreign-born residents, place of birth

Recent posts about races in Rockland, New York on our local forum with over 2,400,000 registered users:
 | smaller Upstate NY cities and towns/African American communities (6012 replies) |
| Rockland County (South) schools and deomographic (19 replies) |
| Yorktown (W'chester) vs Clarkstown (Rockland (12 replies) |
| Moving from Brooklyn. Jewish communities upstate? (343 replies) |
| Bought a house years ago, kinda regretting it (40 replies) |
| Moving from Rye Neck to Rockland (20 replies) |
Latest news about races in Rockland, NY collected exclusively by city-data.com from local newspapers, TV, and radio stations
4.9% of Rockland, NY residents are foreign-born (2.5% born in Europe, 1.6% born in Asia), which is 353.1% less than the foreign-born rate of 22.0% across the entire state of New York.
Race distribution in Rockland

- 3,44187.9%White alone
- 2787.1%Hispanic
- 1072.7%Black alone
- 471.2%Two or more races
- 350.9%Asian alone
- 30.08%Other race alone
- 20.05%American Indian alone

2000
2022
-
- 11,760,98162.0%White alone
- 2,867,58315.1%Hispanic
- 2,812,62314.8%Black alone
- 1,035,9265.5%Asian alone
- 366,1161.9%Two or more races
- 75,4990.4%Other race alone
- 52,4990.3%American Indian alone
- 5,2300.03%Native Hawaiian and Other
Pacific Islander alone

-
- 10,408,93352.9%White alone
- 3,867,29919.7%Hispanic
- 2,633,84013.4%Black alone
- 1,776,2869.0%Asian alone
- 732,6703.7%Two or more races
- 216,1101.1%Other race alone
- 35,0820.2%American Indian alone
- 6,9310.04%Native Hawaiian and Other
Pacific Islander alone

Income and house value in Rockland
- Median household income in 2022
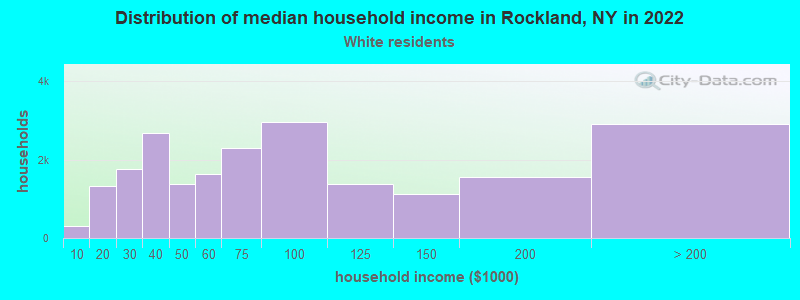
- $59,905White non-Hispanic householders
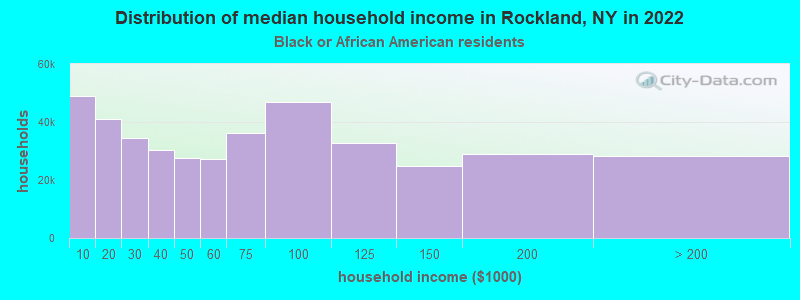
- $41,468Black householders
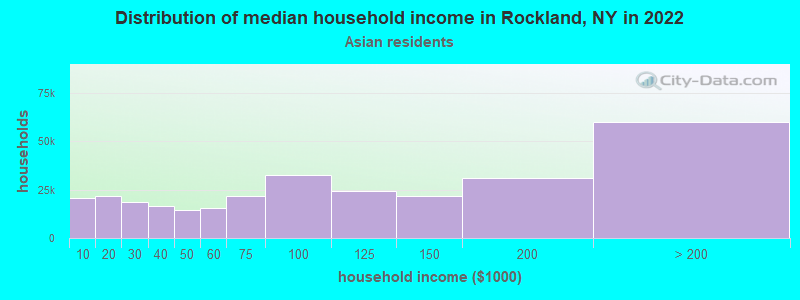
- $69,001Asian householders
- $18,857Some other race householders
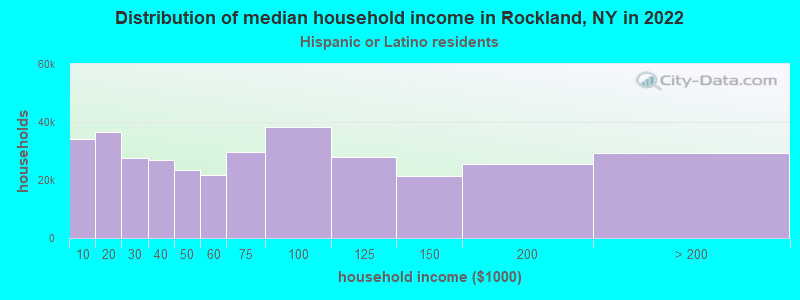
- $33,608Hispanic or Latino race householders
- Median 2022 house value
- $249,873White Non-Hispanic householders
- $461,445Black or African American householders
- $268,416Asian householders
- $288,783Hispanic or Latino householders
Household income for White non-Hispanic householders
Household income for Black householders
Household income for Asian householders
Household income for Hispanic or Latino race householders
Foreign-born residents in Rockland
190 residents are foreign born (2.5% Europe, 1.6% Asia).
| This city: | 4.9% |
| New York: | 20.4% |
Ancestries in Rockland

- 90221.3%German
- 65415.4%Other
- 64015.1%Irish
- 51312.1%Italian
- 3748.8%United States
- 3287.7%English
- 1874.4%Dutch
- 1303.1%Polish
- 751.8%Scotch-Irish
- 711.7%French
- 701.7%Greek
- 481.1%Russian
- 411.0%Norwegian
- 360.9%Scottish
- 360.9%Swedish
- 320.8%Ukrainian
- 240.6%Arab
- 230.5%Hungarian
- 210.5%French Canadian
- 150.4%Swiss
- 100.2%Portuguese
- 50.1%Welsh

Zip codes: 12758.