Races in Rockville, Connecticut (CT) Detailed Stats
Data:
Races - White alone (%)
Races - White alone (% change since 2000)
Races - Black alone (%)
Races - Black alone (% change since 2000)
Races - American Indian alone (%)
Races - American Indian alone (% change since 2000)
Races - Asian alone (%)
Races - Asian alone (% change since 2000)
Races - Hispanic (%)
Races - Hispanic (% change since 2000)
Races - Native Hawaiian and Other Pacific Islander alone (%)
Races - Native Hawaiian and Other Pacific Islander alone (% change since 2000)
Races - Two or more races(%)
Races - Two or more races(% change since 2000)
Races - Other race alone (%)
Races - Other race alone (% change since 2000)
Racial diversity
Place of birth - Born in state of residence (%)
Place of birth - Born in state of residence (%) - White
Place of birth - Born in state of residence (%) - Black or African American
Place of birth - Born in state of residence (%) - Asian
Place of birth - Born in state of residence (%) - Hispanic or Latino
Place of birth - Born in state of residence (%) - American Indian and Alaska Native
Place of birth - Born in state of residence (%) - Multirace
Place of birth - Born in state of residence (%) - Other Race
Place of birth - Born in other state (%)
Place of birth - Born in other state (%) - White
Place of birth - Born in other state (%) - Black or African American
Place of birth - Born in other state (%) - Asian
Place of birth - Born in other state (%) - Hispanic or Latino
Place of birth - Born in other state (%) - American Indian and Alaska Native
Place of birth - Born in other state (%) - Multirace
Place of birth - Born in other state (%) - Other Race
Place of birth - Native, outside of US (%)
Place of birth - Native, outside of US (%) - White
Place of birth - Native, outside of US (%) - Black or African American
Place of birth - Native, outside of US (%) - Asian
Place of birth - Native, outside of US (%) - Hispanic or Latino
Place of birth - Native, outside of US (%) - American Indian and Alaska Native
Place of birth - Native, outside of US (%) - Multirace
Place of birth - Native, outside of US (%) - Other Race
Place of birth - Foreign born (%)
Place of birth - Foreign born (%) - White
Place of birth - Foreign born (%) - Black or African American
Place of birth - Foreign born (%) - Asian
Place of birth - Foreign born (%) - Hispanic or Latino
Place of birth - Foreign born (%) - American Indian and Alaska Native
Place of birth - Foreign born (%) - Multirace
Place of birth - Foreign born (%) - Other Race
Residents speaking English at home (%)
Residents speaking English at home - Born in the United States (%)
Residents speaking English at home - Native, born elsewhere (%)
Residents speaking English at home - Foreign born (%)
Residents speaking Spanish at home (%)
Residents speaking Spanish at home - Born in the United States (%)
Residents speaking Spanish at home - Native, born elsewhere (%)
Residents speaking Spanish at home - Foreign born (%)
Residents speaking other language at home (%)
Residents speaking other language at home - Born in the United States (%)
Residents speaking other language at home - Native, born elsewhere (%)
Residents speaking other language at home - Foreign born (%)
Marital status - Never married (%)
Marital status - Now married (%)
Marital status - Separated (%)
Marital status - Widowed (%)
Marital status - Divorced (%)
Ancestries Reported - Arab (%)
Ancestries Reported - Czech (%)
Ancestries Reported - Danish (%)
Ancestries Reported - Dutch (%)
Ancestries Reported - English (%)
Ancestries Reported - French (%)
Ancestries Reported - French Canadian (%)
Ancestries Reported - German (%)
Ancestries Reported - Greek (%)
Ancestries Reported - Hungarian (%)
Ancestries Reported - Irish (%)
Ancestries Reported - Italian (%)
Ancestries Reported - Lithuanian (%)
Ancestries Reported - Norwegian (%)
Ancestries Reported - Polish (%)
Ancestries Reported - Portuguese (%)
Ancestries Reported - Russian (%)
Ancestries Reported - Scotch-Irish (%)
Ancestries Reported - Scottish (%)
Ancestries Reported - Slovak (%)
Ancestries Reported - Subsaharan African (%)
Ancestries Reported - Swedish (%)
Ancestries Reported - Swiss (%)
Ancestries Reported - Ukrainian (%)
Ancestries Reported - United States (%)
Ancestries Reported - Welsh (%)
Ancestries Reported - West Indian (%)
Ancestries Reported - Other (%)
Geographical mobility - Same house 1 year ago (%)
Geographical mobility - Same house 1 year ago (%) - White
Geographical mobility - Same house 1 year ago (%) - Black or African American
Geographical mobility - Same house 1 year ago (%) - Asian
Geographical mobility - Same house 1 year ago (%) - Hispanic or Latino
Geographical mobility - Same house 1 year ago (%) - American Indian and Alaska Native
Geographical mobility - Same house 1 year ago (%) - Multirace
Geographical mobility - Same house 1 year ago (%) - Other Race
Geographical mobility - Moved within same county (%)
Geographical mobility - Moved within same county (%) - White
Geographical mobility - Moved within same county (%) - Black or African American
Geographical mobility - Moved within same county (%) - Asian
Geographical mobility - Moved within same county (%) - Hispanic or Latino
Geographical mobility - Moved within same county (%) - American Indian and Alaska Native
Geographical mobility - Moved within same county (%) - Multirace
Geographical mobility - Moved within same county (%) - Other Race
Geographical mobility - Moved from different county within same state (%)
Geographical mobility - Moved from different county within same state (%) - White
Geographical mobility - Moved from different county within same state (%) - Black or African American
Geographical mobility - Moved from different county within same state (%) - Asian
Geographical mobility - Moved from different county within same state (%) - Hispanic or Latino
Geographical mobility - Moved from different county within same state (%) - American Indian and Alaska Native
Geographical mobility - Moved from different county within same state (%) - Multirace
Geographical mobility - Moved from different county within same state (%) - Other Race
Geographical mobility - Moved from different state (%)
Geographical mobility - Moved from different state (%) - White
Geographical mobility - Moved from different state (%) - Black or African American
Geographical mobility - Moved from different state (%) - Asian
Geographical mobility - Moved from different state (%) - Hispanic or Latino
Geographical mobility - Moved from different state (%) - American Indian and Alaska Native
Geographical mobility - Moved from different state (%) - Multirace
Geographical mobility - Moved from different state (%) - Other Race
Geographical mobility - Moved from abroad (%)
Geographical mobility - Moved from abroad (%) - White
Geographical mobility - Moved from abroad (%) - Black or African American
Geographical mobility - Moved from abroad (%) - Asian
Geographical mobility - Moved from abroad (%) - Hispanic or Latino
Geographical mobility - Moved from abroad (%) - American Indian and Alaska Native
Geographical mobility - Moved from abroad (%) - Multirace
Geographical mobility - Moved from abroad (%) - Other Race
Place of birth for the foreign-born population - Ireland (%)
Place of birth for the foreign-born population - Denmark (%)
Place of birth for the foreign-born population - Norway (%)
Place of birth for the foreign-born population - Sweden (%)
Place of birth for the foreign-born population - United Kingdom (%)
Place of birth for the foreign-born population - England (%)
Place of birth for the foreign-born population - Scotland (%)
Place of birth for the foreign-born population - Other Northern Europe (%)
Place of birth for the foreign-born population - Austria (%)
Place of birth for the foreign-born population - Belgium (%)
Place of birth for the foreign-born population - France (%)
Place of birth for the foreign-born population - Germany (%)
Place of birth for the foreign-born population - Netherlands (%)
Place of birth for the foreign-born population - Switzerland (%)
Place of birth for the foreign-born population - Other Western Europe (%)
Place of birth for the foreign-born population - Greece (%)
Place of birth for the foreign-born population - Italy (%)
Place of birth for the foreign-born population - Portugal (%)
Place of birth for the foreign-born population - Spain (%)
Place of birth for the foreign-born population - Other Southern Europe (%)
Place of birth for the foreign-born population - Albania (%)
Place of birth for the foreign-born population - Belarus (%)
Place of birth for the foreign-born population - Bosnia and Herzegovina (%)
Place of birth for the foreign-born population - Bulgaria (%)
Place of birth for the foreign-born population - Croatia (%)
Place of birth for the foreign-born population - Czechoslovakia (%)
Place of birth for the foreign-born population - Hungary (%)
Place of birth for the foreign-born population - Latvia (%)
Place of birth for the foreign-born population - Lithuania (%)
Place of birth for the foreign-born population - North Macedonia (Macedonia) (%)
Place of birth for the foreign-born population - Moldova (%)
Place of birth for the foreign-born population - Poland (%)
Place of birth for the foreign-born population - Romania (%)
Place of birth for the foreign-born population - Russia (%)
Place of birth for the foreign-born population - Serbia (%)
Place of birth for the foreign-born population - Ukraine (%)
Place of birth for the foreign-born population - Other Eastern Europe (%)
Place of birth for the foreign-born population - China (%)
Place of birth for the foreign-born population - Hong Kong (%)
Place of birth for the foreign-born population - Taiwan (%)
Place of birth for the foreign-born population - Japan (%)
Place of birth for the foreign-born population - Korea (%)
Place of birth for the foreign-born population - Other Eastern Asia (%)
Place of birth for the foreign-born population - Afghanistan (%)
Place of birth for the foreign-born population - Bangladesh (%)
Place of birth for the foreign-born population - India (%)
Place of birth for the foreign-born population - Iran (%)
Place of birth for the foreign-born population - Kazakhstan (%)
Place of birth for the foreign-born population - Nepal (%)
Place of birth for the foreign-born population - Pakistan (%)
Place of birth for the foreign-born population - Sri Lanka (%)
Place of birth for the foreign-born population - Uzbekistan (%)
Place of birth for the foreign-born population - Other South Central Asia (%)
Place of birth for the foreign-born population - Burma (%)
Place of birth for the foreign-born population - Cambodia (%)
Place of birth for the foreign-born population - Indonesia (%)
Place of birth for the foreign-born population - Laos (%)
Place of birth for the foreign-born population - Malaysia (%)
Place of birth for the foreign-born population - Philippines (%)
Place of birth for the foreign-born population - Singapore (%)
Place of birth for the foreign-born population - Thailand (%)
Place of birth for the foreign-born population - Vietnam (%)
Place of birth for the foreign-born population - Other South Eastern Asia (%)
Place of birth for the foreign-born population - Armenia (%)
Place of birth for the foreign-born population - Iraq (%)
Place of birth for the foreign-born population - Israel (%)
Place of birth for the foreign-born population - Jordan (%)
Place of birth for the foreign-born population - Kuwait (%)
Place of birth for the foreign-born population - Lebanon (%)
Place of birth for the foreign-born population - Saudi Arabia (%)
Place of birth for the foreign-born population - Syria (%)
Place of birth for the foreign-born population - Turkey (%)
Place of birth for the foreign-born population - Yemen (%)
Place of birth for the foreign-born population - Other Western Asia (%)
Place of birth for the foreign-born population - Eritrea (%)
Place of birth for the foreign-born population - Ethiopia (%)
Place of birth for the foreign-born population - Kenya (%)
Place of birth for the foreign-born population - Somalia (%)
Place of birth for the foreign-born population - Uganda (%)
Place of birth for the foreign-born population - Zimbabwe (%)
Place of birth for the foreign-born population - Other Eastern Africa (%)
Place of birth for the foreign-born population - Cameroon (%)
Place of birth for the foreign-born population - Congo (%)
Place of birth for the foreign-born population - Democratic Republic of Congo (Zaire) (%)
Place of birth for the foreign-born population - Other Middle Africa (%)
Place of birth for the foreign-born population - Egypt (%)
Place of birth for the foreign-born population - Morocco (%)
Place of birth for the foreign-born population - Sudan (%)
Place of birth for the foreign-born population - Other Northern Africa (%)
Place of birth for the foreign-born population - South Africa (%)
Place of birth for the foreign-born population - Other Southern Africa (%)
Place of birth for the foreign-born population - Cabo Verde (%)
Place of birth for the foreign-born population - Ghana (%)
Place of birth for the foreign-born population - Liberia (%)
Place of birth for the foreign-born population - Nigeria (%)
Place of birth for the foreign-born population - Senegal (%)
Place of birth for the foreign-born population - Sierra Leone (%)
Place of birth for the foreign-born population - Other Western Africa (%)
Place of birth for the foreign-born population - Australia (%)
Place of birth for the foreign-born population - New Zealand (%)
Place of birth for the foreign-born population - Fiji (%)
Place of birth for the foreign-born population - Micronesia (%)
Place of birth for the foreign-born population - Bahamas (%)
Place of birth for the foreign-born population - Barbados (%)
Place of birth for the foreign-born population - Cuba (%)
Place of birth for the foreign-born population - Dominica (%)
Place of birth for the foreign-born population - Dominican Republic (%)
Place of birth for the foreign-born population - Grenada (%)
Place of birth for the foreign-born population - Haiti (%)
Place of birth for the foreign-born population - Jamaica (%)
Place of birth for the foreign-born population - St. Vincent and the Grenadines (%)
Place of birth for the foreign-born population - Trinidad and Tobago (%)
Place of birth for the foreign-born population - West Indies (%)
Place of birth for the foreign-born population - Other Caribbean (%)
Place of birth for the foreign-born population - Belize (%)
Place of birth for the foreign-born population - Costa Rica (%)
Place of birth for the foreign-born population - El Salvador (%)
Place of birth for the foreign-born population - Guatemala (%)
Place of birth for the foreign-born population - Honduras (%)
Place of birth for the foreign-born population - Mexico (%)
Place of birth for the foreign-born population - Nicaragua (%)
Place of birth for the foreign-born population - Panama (%)
Place of birth for the foreign-born population - Other Central America (%)
Place of birth for the foreign-born population - Argentina (%)
Place of birth for the foreign-born population - Bolivia (%)
Place of birth for the foreign-born population - Brazil (%)
Place of birth for the foreign-born population - Chile (%)
Place of birth for the foreign-born population - Colombia (%)
Place of birth for the foreign-born population - Ecuador (%)
Place of birth for the foreign-born population - Guyana (%)
Place of birth for the foreign-born population - Peru (%)
Place of birth for the foreign-born population - Uruguay (%)
Place of birth for the foreign-born population - Venezuela (%)
Place of birth for the foreign-born population - Other South America (%)
Place of birth for the foreign-born population - Canada (%)
Place of birth for the foreign-born population - Other Northern America (%)
Place of birth for the foreign-born population - Other (%)
Latest news about races in Rockville, CT collected exclusively by city-data.com from local newspapers, TV, and radio stations
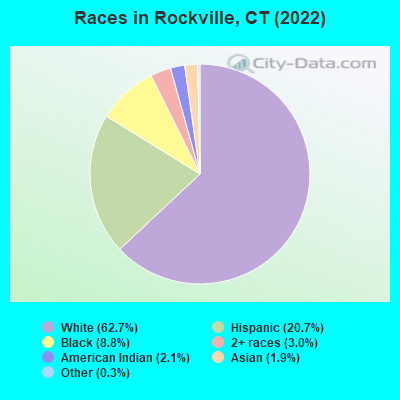
According to 2022 data, the most numerous races in Rockville, CT are White alone (4,376 residents), Hispanic (1,448 residents), and Black alone (614 residents). 85.3% of Rockville residents speak English at home. 3.2% of Rockville, CT residents are foreign-born (0.9% born in Asia, 0.8% born in Africa, 0.7% born in Europe, 0.6% born in North America), which is 363.3% less than the foreign-born rate of 15.0% across the entire state of Connecticut.
Race distribution in Rockville
2000 2022
2,638,845 77.5% White alone 320,323 9.4% Hispanic 295,571 8.7% Black alone 81,564 2.4% Asian alone 52,896 1.6% Two or more races 8,141 0.2% Other race alone 7,267 0.2% American Indian alone 958 0.03% Native Hawaiian and Other
2,246,913 62.0% White alone 658,978 18.2% Hispanic 353,973 9.8% Black alone 172,929 4.8% Asian alone 159,631 4.4% Two or more races 29,761 0.8% Other race alone 3,428 0.09% American Indian alone 592 0.02% Native Hawaiian and Other
Income and house value in Rockville Median household income in 2022 $57,471 White non-Hispanic householders$50,948 Hispanic or Latino race householdersMedian 2022 house value $200,786 White Non-Hispanic householders$187,746 Black or African American householders $200,965 Asian householders$200,965 Some other race householders$200,965 Hispanic or Latino householders
Median age by race in Rockville
34.1 Median age for White residents33.8 35.0 19.9 Median age for Black or African American residents35.2 14.1 11.5 Median age for American Indian / Alaska Native residents8.2 -704,477,611.2 30.0 Median age for Asian residents-678,062,677.4 29.4 -641,269,840.6 Median age for Native Hawaiian / Pacific Islander residents-414,239,481.8 -691,588,784.4 50.8 Median age for Other race residents-670,794,633.0 51.7 33.5 Median age for Two or more races residents32.3 34.5 32.6 Median age for White alone residents32.4 32.9 35.3 Median age for Hispanic or Latino residents34.4 49.7
Owner/renter occupied households by race in Rockville
House owners and renters - White residents 683 32.9% Owner occupied1,391 67.1% Renter occupiedHouse owners and renters - Black or African American residents 201 100.0% Renter occupiedHouse owners and renters - American Indian / Alaska Native residents 47 100.0% Renter occupiedHouse owners and renters - Asian residents 65 100.0% Renter occupiedHouse owners and renters - Other race residents 36 13.9% Owner occupied222 86.1% Renter occupiedHouse owners and renters - Two or more races residents 48 29.0% Owner occupied117 71.0% Renter occupiedHouse owners and renters - White alone residents 640 33.0% Owner occupied1,301 67.0% Renter occupiedHouse owners and renters - Hispanic or Latino residents 109 20.1% Owner occupied433 79.9% Renter occupied
Language usage in Rockville
English speakers - Total 85.3% of residents of Rockville speak English at home.
9.6% of residents speak Spanish at home 313 51.1% Speak English very well300 48.9% Speak English less than very well4.8% of residents speak other language at home 113 36.7% Speak English very well195 63.3% Speak English less than very well
English speakers - Born in the United States 85.3% of residents of Rockville speak English at home.
15.5% of residents speak Spanish at home 122 52.8% Speak English very well109 47.2% Speak English less than very well0.6% of residents speak other language at home 9 100.0% Speak English less than very well
English speakers - Native, born elsewhere 27.4% of residents of Rockville speak English at home.
61.8% of residents speak Spanish at home 98 36.4% Speak English very well171 63.6% Speak English less than very well9.2% of residents speak other language at home 40 100.0% Speak English less than very well
English speakers - Foreign-born 20.9% of residents of Rockville speak English at home.
3.1% of residents speak Spanish at home 7 100.0% Speak English very well72.9% of residents speak other language at home 49 29.9% Speak English very well115 70.1% Speak English less than very well
White (Caucasian) - Speak only English Native:
95.0% (4,348)Foreign-born:
52.3% (41)
White (Caucasian) - Speak another language Native:
5.2% (237)Foreign-born:
51.5% (40)
Black or African American - Speak another language Native:
10.4% (40)Foreign-born:
83.6% (53)
Asian - Speak another language Native:
97.2% (67)Foreign-born:
100.0% (63)
White alone - Speak only English Native:
97.2% (3,981)Foreign-born:
50.0% (42)
White alone - Speak another language Native:
2.7% (113)Foreign-born:
50.5% (43)
Hispanic or Latino - Speak another language Native:
40.1% (523)Foreign-born:
100.0% (7)
Foreign-born residents in Rockville 226 residents are foreign born (0.9% Asia , 0.8% Africa , 0.7% Europe , 0.6% North America ).
This city:
3.2%Connecticut:
15.0%
Marital status for residents in Rockville Marital status - White (Caucasian) population 15 years and over
Males 50.1% Never married30.0% Now married0.7% Separated3.8% Widowed15.4% DivorcedFemales 47.7% Never married23.8% Now married0.6% Separated4.5% Widowed23.4% DivorcedWomen who gave birth in the past 12 months Now married:
44.6% (84)Unmarried:
55.4% (104)
Women who did not give birth in the past 12 months Now married:
11.2% (115)Unmarried:
88.8% (909)
Marital status - Black or African American population 15 years and over
Males 38.0% Never married23.5% Now married0.0% Separated0.0% Widowed38.5% DivorcedFemales 64.1% Never married35.9% Now married0.0% Separated0.0% Widowed0.0% DivorcedWomen who did not give birth in the past 12 months Now married:
25.8% (33)Unmarried:
74.2% (96)
Marital status - Asian population 15 years and over
Males 0.0% Never married69.1% Now married0.0% Separated30.9% Widowed0.0% DivorcedFemales 0.0% Never married79.1% Now married0.0% Separated20.9% Widowed0.0% DivorcedWomen who did not give birth in the past 12 months Now married:
79.1% (33)Unmarried:
20.9% (9)
Marital status - Other race population 15 years and over
Males 0.0% Never married36.0% Now married0.0% Separated0.0% Widowed64.0% DivorcedFemales 40.0% Never married6.8% Now married0.0% Separated0.0% Widowed53.2% DivorcedWomen who did not give birth in the past 12 months Now married:
5.2% (12)Unmarried:
94.8% (226)
Marital status - Two or more races population 15 years and over
Males 69.9% Never married14.9% Now married0.0% Separated0.0% Widowed15.2% DivorcedFemales 44.1% Never married45.6% Now married0.0% Separated0.0% Widowed10.3% DivorcedWomen who did not give birth in the past 12 months Now married:
22.9% (17)Unmarried:
77.1% (57)
Marital status - White alone, not Hispanic / Latino population 15 years and over
Males 53.7% Never married24.8% Now married0.8% Separated4.5% Widowed16.1% DivorcedFemales 50.3% Never married18.9% Now married0.6% Separated4.2% Widowed26.0% DivorcedWomen who gave birth in the past 12 months Now married:
44.6% (88)Unmarried:
55.4% (109)
Women who did not give birth in the past 12 months Now married:
9.3% (93)Unmarried:
90.7% (909)
Marital status - Hispanic or Latino population 15 years and over
Males 47.2% Never married43.1% Now married0.0% Separated0.0% Widowed9.7% DivorcedFemales 37.9% Never married33.3% Now married0.0% Separated3.1% Widowed25.7% DivorcedWomen who did not give birth in the past 12 months Now married:
12.1% (41)Unmarried:
87.9% (297)
Ancestries in Rockville
215 7.3% Polish167 5.7% Irish110 3.7% French Canadian106 3.6% Italian94 3.2% American80 2.7% German79 2.7% English76 2.6% Slovak66 2.2% French54 1.8% Portuguese33 1.1% African22 0.7% Eastern European19 0.6% Austrian15 0.5% Swedish13 0.4% Hungarian11 0.4% Dutch9 0.3% Scotch-Irish4 0.1% European
Children Nativity (place of birth) in Rockville
Children under 6 years - Living with two parents Both parents native 134 100.0% NativeOne native, one foreign-born parent 22 100.0% NativeChildren under 6 years - Living with one parent Native parent 450 100.0% NativeForeign-born parent 54 100.0% NativeChildren 6 to 17 years - Living with two parents Both parents native 174 96.5% Native6 3.5% Foreign-bornOne native, one foreign-born parent 53 79.8% Native13 20.2% Foreign-bornChildren 6 to 17 years - Living with one parent Native parent 600 100.0% Native
Grandparents responsible for own grandchildren in Rockville
Grandparents (30 to 59 years) White / Caucasian 45 100.0% Not responsible for grandchildrenTwo or more races 49 100.0% Not responsible for grandchildrenWhite alone, not Hispanic / Latino 60 100.0% Not responsible for grandchildrenHispanic or Latino 37 100.0% Not responsible for grandchildrenGrandparents (60 years and over) White / Caucasian 33 32.9% Responsible for grandchildren67 67.1% Not responsible for grandchildrenWhite alone, not Hispanic / Latino 35 33.1% Responsible for grandchildren70 66.9% Not responsible for grandchildren