Races in Rocky Mount, North Carolina (NC) Detailed Stats
Data:
Races - White alone (%)
Races - White alone (% change since 2000)
Races - Black alone (%)
Races - Black alone (% change since 2000)
Races - American Indian alone (%)
Races - American Indian alone (% change since 2000)
Races - Asian alone (%)
Races - Asian alone (% change since 2000)
Races - Hispanic (%)
Races - Hispanic (% change since 2000)
Races - Native Hawaiian and Other Pacific Islander alone (%)
Races - Native Hawaiian and Other Pacific Islander alone (% change since 2000)
Races - Two or more races(%)
Races - Two or more races(% change since 2000)
Races - Other race alone (%)
Races - Other race alone (% change since 2000)
Racial diversity
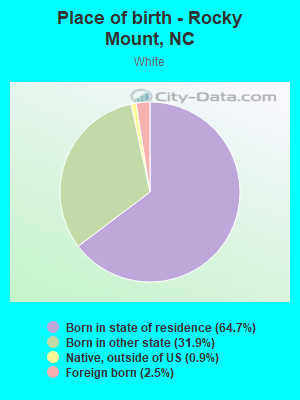
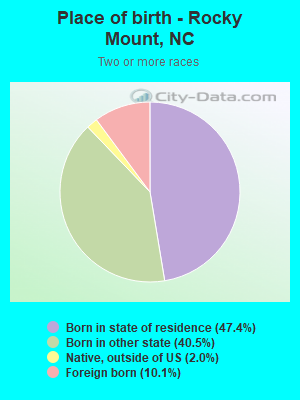
Place of birth - Born in state of residence (%)
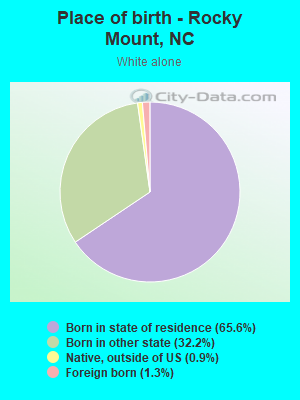
Place of birth - Born in state of residence (%) - White
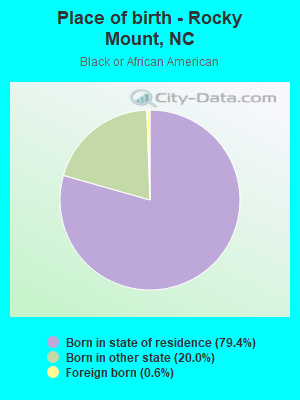
Place of birth - Born in state of residence (%) - Black or African American
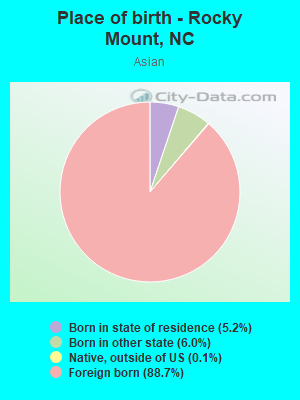
Place of birth - Born in state of residence (%) - Asian
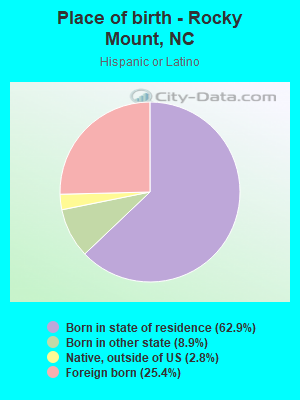
Place of birth - Born in state of residence (%) - Hispanic or Latino
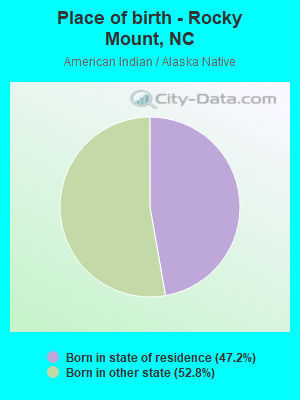
Place of birth - Born in state of residence (%) - American Indian and Alaska Native
Place of birth - Born in state of residence (%) - Multirace
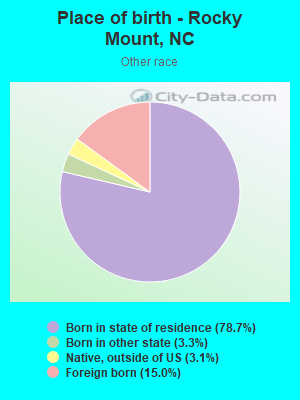
Place of birth - Born in state of residence (%) - Other Race
Place of birth - Born in other state (%)
Place of birth - Born in other state (%) - White
Place of birth - Born in other state (%) - Black or African American
Place of birth - Born in other state (%) - Asian
Place of birth - Born in other state (%) - Hispanic or Latino
Place of birth - Born in other state (%) - American Indian and Alaska Native
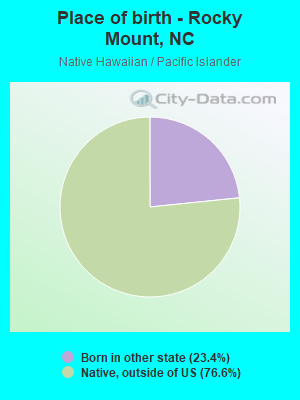
Place of birth - Born in other state (%) - Multirace
Place of birth - Born in other state (%) - Other Race
Place of birth - Native, outside of US (%)
Place of birth - Native, outside of US (%) - White
Place of birth - Native, outside of US (%) - Black or African American
Place of birth - Native, outside of US (%) - Asian
Place of birth - Native, outside of US (%) - Hispanic or Latino
Place of birth - Native, outside of US (%) - American Indian and Alaska Native
Place of birth - Native, outside of US (%) - Multirace
Place of birth - Native, outside of US (%) - Other Race
Place of birth - Foreign born (%)
Place of birth - Foreign born (%) - White
Place of birth - Foreign born (%) - Black or African American
Place of birth - Foreign born (%) - Asian
Place of birth - Foreign born (%) - Hispanic or Latino
Place of birth - Foreign born (%) - American Indian and Alaska Native
Place of birth - Foreign born (%) - Multirace
Place of birth - Foreign born (%) - Other Race
Residents speaking English at home (%)
Residents speaking English at home - Born in the United States (%)
Residents speaking English at home - Native, born elsewhere (%)
Residents speaking English at home - Foreign born (%)
Residents speaking Spanish at home (%)
Residents speaking Spanish at home - Born in the United States (%)
Residents speaking Spanish at home - Native, born elsewhere (%)
Residents speaking Spanish at home - Foreign born (%)
Residents speaking other language at home (%)
Residents speaking other language at home - Born in the United States (%)
Residents speaking other language at home - Native, born elsewhere (%)
Residents speaking other language at home - Foreign born (%)
Marital status - Never married (%)
Marital status - Now married (%)
Marital status - Separated (%)
Marital status - Widowed (%)
Marital status - Divorced (%)
Ancestries Reported - Arab (%)
Ancestries Reported - Czech (%)
Ancestries Reported - Danish (%)
Ancestries Reported - Dutch (%)
Ancestries Reported - English (%)
Ancestries Reported - French (%)
Ancestries Reported - French Canadian (%)
Ancestries Reported - German (%)
Ancestries Reported - Greek (%)
Ancestries Reported - Hungarian (%)
Ancestries Reported - Irish (%)
Ancestries Reported - Italian (%)
Ancestries Reported - Lithuanian (%)
Ancestries Reported - Norwegian (%)
Ancestries Reported - Polish (%)
Ancestries Reported - Portuguese (%)
Ancestries Reported - Russian (%)
Ancestries Reported - Scotch-Irish (%)
Ancestries Reported - Scottish (%)
Ancestries Reported - Slovak (%)
Ancestries Reported - Subsaharan African (%)
Ancestries Reported - Swedish (%)
Ancestries Reported - Swiss (%)
Ancestries Reported - Ukrainian (%)
Ancestries Reported - United States (%)
Ancestries Reported - Welsh (%)
Ancestries Reported - West Indian (%)
Ancestries Reported - Other (%)
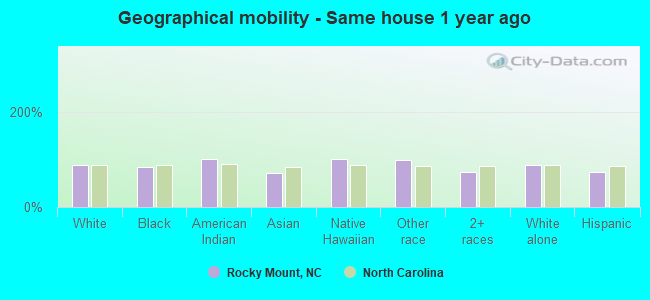
Geographical mobility - Same house 1 year ago (%)
Geographical mobility - Same house 1 year ago (%) - White
Geographical mobility - Same house 1 year ago (%) - Black or African American
Geographical mobility - Same house 1 year ago (%) - Asian
Geographical mobility - Same house 1 year ago (%) - Hispanic or Latino
Geographical mobility - Same house 1 year ago (%) - American Indian and Alaska Native
Geographical mobility - Same house 1 year ago (%) - Multirace
Geographical mobility - Same house 1 year ago (%) - Other Race
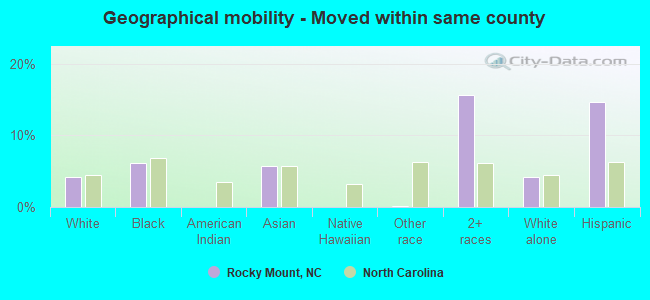
Geographical mobility - Moved within same county (%)
Geographical mobility - Moved within same county (%) - White
Geographical mobility - Moved within same county (%) - Black or African American
Geographical mobility - Moved within same county (%) - Asian
Geographical mobility - Moved within same county (%) - Hispanic or Latino
Geographical mobility - Moved within same county (%) - American Indian and Alaska Native
Geographical mobility - Moved within same county (%) - Multirace
Geographical mobility - Moved within same county (%) - Other Race
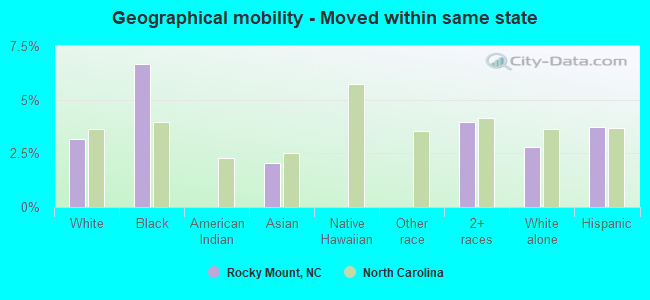
Geographical mobility - Moved from different county within same state (%)
Geographical mobility - Moved from different county within same state (%) - White
Geographical mobility - Moved from different county within same state (%) - Black or African American
Geographical mobility - Moved from different county within same state (%) - Asian
Geographical mobility - Moved from different county within same state (%) - Hispanic or Latino
Geographical mobility - Moved from different county within same state (%) - American Indian and Alaska Native
Geographical mobility - Moved from different county within same state (%) - Multirace
Geographical mobility - Moved from different county within same state (%) - Other Race
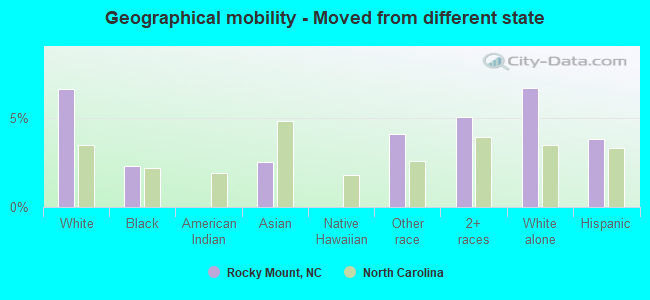
Geographical mobility - Moved from different state (%)
Geographical mobility - Moved from different state (%) - White
Geographical mobility - Moved from different state (%) - Black or African American
Geographical mobility - Moved from different state (%) - Asian
Geographical mobility - Moved from different state (%) - Hispanic or Latino
Geographical mobility - Moved from different state (%) - American Indian and Alaska Native
Geographical mobility - Moved from different state (%) - Multirace
Geographical mobility - Moved from different state (%) - Other Race
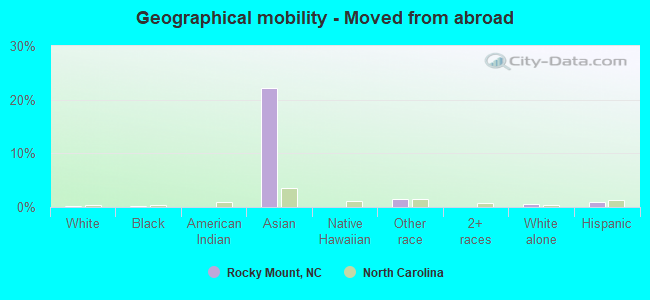
Geographical mobility - Moved from abroad (%)
Geographical mobility - Moved from abroad (%) - White
Geographical mobility - Moved from abroad (%) - Black or African American
Geographical mobility - Moved from abroad (%) - Asian
Geographical mobility - Moved from abroad (%) - Hispanic or Latino
Geographical mobility - Moved from abroad (%) - American Indian and Alaska Native
Geographical mobility - Moved from abroad (%) - Multirace
Geographical mobility - Moved from abroad (%) - Other Race
Place of birth for the foreign-born population - Ireland (%)
Place of birth for the foreign-born population - Denmark (%)
Place of birth for the foreign-born population - Norway (%)
Place of birth for the foreign-born population - Sweden (%)
Place of birth for the foreign-born population - United Kingdom (%)
Place of birth for the foreign-born population - England (%)
Place of birth for the foreign-born population - Scotland (%)
Place of birth for the foreign-born population - Other Northern Europe (%)
Place of birth for the foreign-born population - Austria (%)
Place of birth for the foreign-born population - Belgium (%)
Place of birth for the foreign-born population - France (%)
Place of birth for the foreign-born population - Germany (%)
Place of birth for the foreign-born population - Netherlands (%)
Place of birth for the foreign-born population - Switzerland (%)
Place of birth for the foreign-born population - Other Western Europe (%)
Place of birth for the foreign-born population - Greece (%)
Place of birth for the foreign-born population - Italy (%)
Place of birth for the foreign-born population - Portugal (%)
Place of birth for the foreign-born population - Spain (%)
Place of birth for the foreign-born population - Other Southern Europe (%)
Place of birth for the foreign-born population - Albania (%)
Place of birth for the foreign-born population - Belarus (%)
Place of birth for the foreign-born population - Bosnia and Herzegovina (%)
Place of birth for the foreign-born population - Bulgaria (%)
Place of birth for the foreign-born population - Croatia (%)
Place of birth for the foreign-born population - Czechoslovakia (%)
Place of birth for the foreign-born population - Hungary (%)
Place of birth for the foreign-born population - Latvia (%)
Place of birth for the foreign-born population - Lithuania (%)
Place of birth for the foreign-born population - North Macedonia (Macedonia) (%)
Place of birth for the foreign-born population - Moldova (%)
Place of birth for the foreign-born population - Poland (%)
Place of birth for the foreign-born population - Romania (%)
Place of birth for the foreign-born population - Russia (%)
Place of birth for the foreign-born population - Serbia (%)
Place of birth for the foreign-born population - Ukraine (%)
Place of birth for the foreign-born population - Other Eastern Europe (%)
Place of birth for the foreign-born population - China (%)
Place of birth for the foreign-born population - Hong Kong (%)
Place of birth for the foreign-born population - Taiwan (%)
Place of birth for the foreign-born population - Japan (%)
Place of birth for the foreign-born population - Korea (%)
Place of birth for the foreign-born population - Other Eastern Asia (%)
Place of birth for the foreign-born population - Afghanistan (%)
Place of birth for the foreign-born population - Bangladesh (%)
Place of birth for the foreign-born population - India (%)
Place of birth for the foreign-born population - Iran (%)
Place of birth for the foreign-born population - Kazakhstan (%)
Place of birth for the foreign-born population - Nepal (%)
Place of birth for the foreign-born population - Pakistan (%)
Place of birth for the foreign-born population - Sri Lanka (%)
Place of birth for the foreign-born population - Uzbekistan (%)
Place of birth for the foreign-born population - Other South Central Asia (%)
Place of birth for the foreign-born population - Burma (%)
Place of birth for the foreign-born population - Cambodia (%)
Place of birth for the foreign-born population - Indonesia (%)
Place of birth for the foreign-born population - Laos (%)
Place of birth for the foreign-born population - Malaysia (%)
Place of birth for the foreign-born population - Philippines (%)
Place of birth for the foreign-born population - Singapore (%)
Place of birth for the foreign-born population - Thailand (%)
Place of birth for the foreign-born population - Vietnam (%)
Place of birth for the foreign-born population - Other South Eastern Asia (%)
Place of birth for the foreign-born population - Armenia (%)
Place of birth for the foreign-born population - Iraq (%)
Place of birth for the foreign-born population - Israel (%)
Place of birth for the foreign-born population - Jordan (%)
Place of birth for the foreign-born population - Kuwait (%)
Place of birth for the foreign-born population - Lebanon (%)
Place of birth for the foreign-born population - Saudi Arabia (%)
Place of birth for the foreign-born population - Syria (%)
Place of birth for the foreign-born population - Turkey (%)
Place of birth for the foreign-born population - Yemen (%)
Place of birth for the foreign-born population - Other Western Asia (%)
Place of birth for the foreign-born population - Eritrea (%)
Place of birth for the foreign-born population - Ethiopia (%)
Place of birth for the foreign-born population - Kenya (%)
Place of birth for the foreign-born population - Somalia (%)
Place of birth for the foreign-born population - Uganda (%)
Place of birth for the foreign-born population - Zimbabwe (%)
Place of birth for the foreign-born population - Other Eastern Africa (%)
Place of birth for the foreign-born population - Cameroon (%)
Place of birth for the foreign-born population - Congo (%)
Place of birth for the foreign-born population - Democratic Republic of Congo (Zaire) (%)
Place of birth for the foreign-born population - Other Middle Africa (%)
Place of birth for the foreign-born population - Egypt (%)
Place of birth for the foreign-born population - Morocco (%)
Place of birth for the foreign-born population - Sudan (%)
Place of birth for the foreign-born population - Other Northern Africa (%)
Place of birth for the foreign-born population - South Africa (%)
Place of birth for the foreign-born population - Other Southern Africa (%)
Place of birth for the foreign-born population - Cabo Verde (%)
Place of birth for the foreign-born population - Ghana (%)
Place of birth for the foreign-born population - Liberia (%)
Place of birth for the foreign-born population - Nigeria (%)
Place of birth for the foreign-born population - Senegal (%)
Place of birth for the foreign-born population - Sierra Leone (%)
Place of birth for the foreign-born population - Other Western Africa (%)
Place of birth for the foreign-born population - Australia (%)
Place of birth for the foreign-born population - New Zealand (%)
Place of birth for the foreign-born population - Fiji (%)
Place of birth for the foreign-born population - Micronesia (%)
Place of birth for the foreign-born population - Bahamas (%)
Place of birth for the foreign-born population - Barbados (%)
Place of birth for the foreign-born population - Cuba (%)
Place of birth for the foreign-born population - Dominica (%)
Place of birth for the foreign-born population - Dominican Republic (%)
Place of birth for the foreign-born population - Grenada (%)
Place of birth for the foreign-born population - Haiti (%)
Place of birth for the foreign-born population - Jamaica (%)
Place of birth for the foreign-born population - St. Vincent and the Grenadines (%)
Place of birth for the foreign-born population - Trinidad and Tobago (%)
Place of birth for the foreign-born population - West Indies (%)
Place of birth for the foreign-born population - Other Caribbean (%)
Place of birth for the foreign-born population - Belize (%)
Place of birth for the foreign-born population - Costa Rica (%)
Place of birth for the foreign-born population - El Salvador (%)
Place of birth for the foreign-born population - Guatemala (%)
Place of birth for the foreign-born population - Honduras (%)
Place of birth for the foreign-born population - Mexico (%)
Place of birth for the foreign-born population - Nicaragua (%)
Place of birth for the foreign-born population - Panama (%)
Place of birth for the foreign-born population - Other Central America (%)
Place of birth for the foreign-born population - Argentina (%)
Place of birth for the foreign-born population - Bolivia (%)
Place of birth for the foreign-born population - Brazil (%)
Place of birth for the foreign-born population - Chile (%)
Place of birth for the foreign-born population - Colombia (%)
Place of birth for the foreign-born population - Ecuador (%)
Place of birth for the foreign-born population - Guyana (%)
Place of birth for the foreign-born population - Peru (%)
Place of birth for the foreign-born population - Uruguay (%)
Place of birth for the foreign-born population - Venezuela (%)
Place of birth for the foreign-born population - Other South America (%)
Place of birth for the foreign-born population - Canada (%)
Place of birth for the foreign-born population - Other Northern America (%)
Place of birth for the foreign-born population - Other (%)
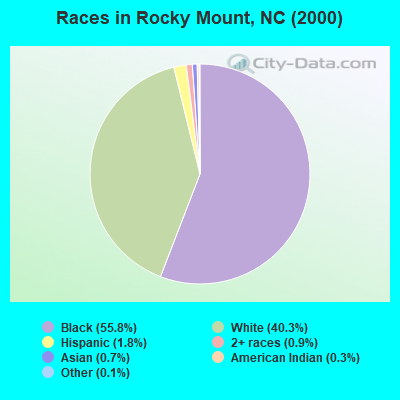
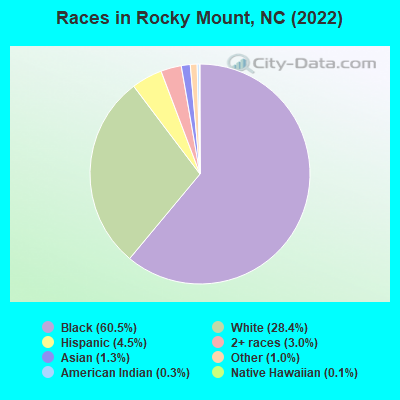
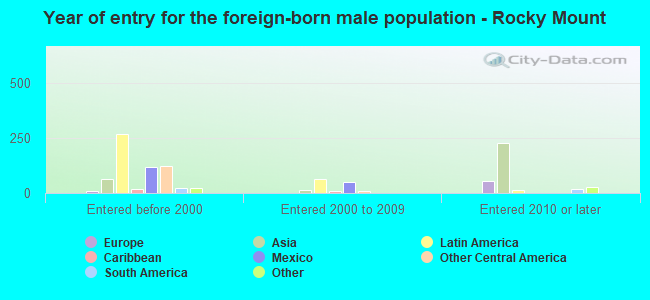
According to 2022 data, the most numerous races in Rocky Mount, NC are White alone (15,748 residents), Black alone (33,557 residents), and Hispanic (2,468 residents). 95.0% of Rocky Mount residents speak English at home. 3.2% of Rocky Mount, NC residents are foreign-born (1.4% born in Latin America, 1.2% born in Asia), which is 152.5% less than the foreign-born rate of 8.0% across the entire state of North Carolina.
Race distribution in Rocky Mount
2000 2022
5,647,155 70.2% White alone 1,723,301 21.4% Black alone 378,963 4.7% Hispanic 112,416 1.4% Asian alone 95,333 1.2% American Indian alone 79,965 1.0% Two or more races 9,015 0.1% Other race alone 3,165 0.04% Native Hawaiian and Other
6,497,519 60.7% White alone 2,155,650 20.1% Black alone 1,114,799 10.4% Hispanic 438,061 4.1% Two or more races 341,052 3.2% Asian alone 91,758 0.9% American Indian alone 50,180 0.5% Other race alone 9,954 0.09% Native Hawaiian and Other
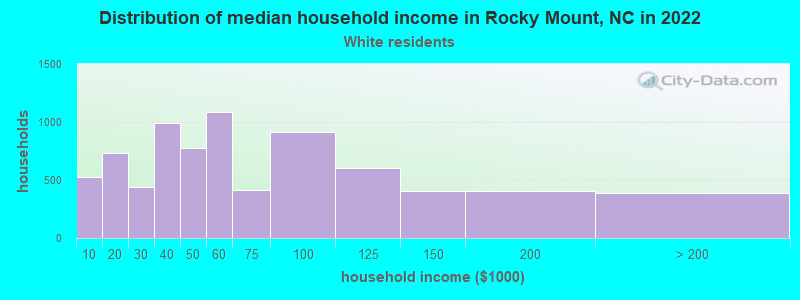
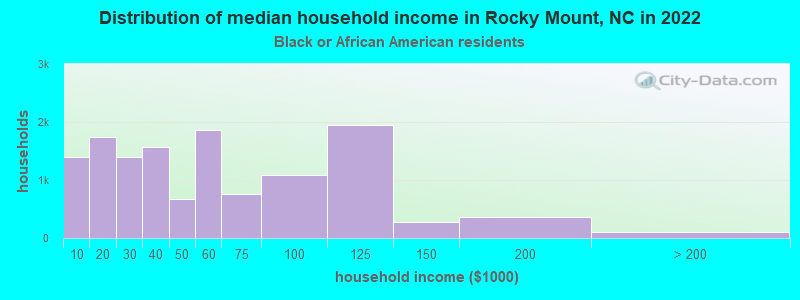
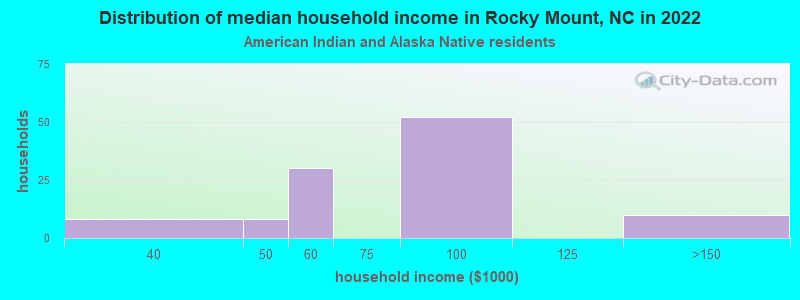
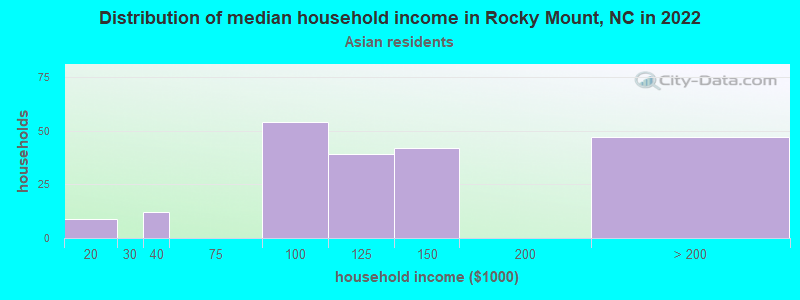
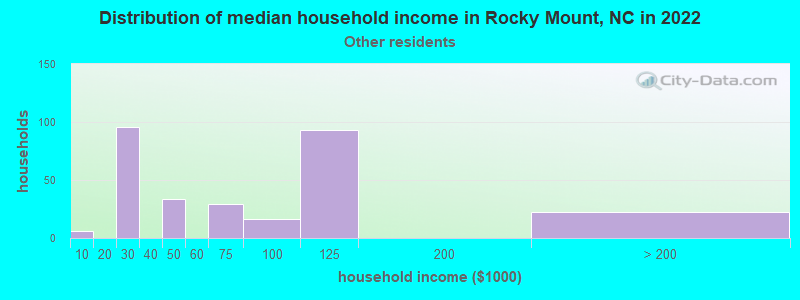
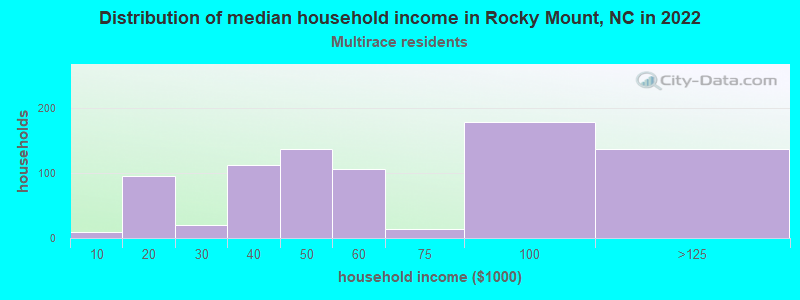
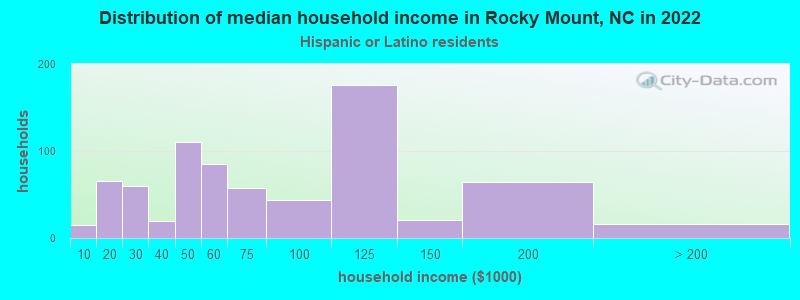
Income and house value in Rocky Mount Median household income in 2022 $50,335 White non-Hispanic householders$47,057 Black householders$76,281 American Indian and Alaska Native householders$117,203 Asian householders$74,594 Some other race householders$62,902 Two or more races householders$44,601 Hispanic or Latino race householdersMedian 2022 house value $193,011 White Non-Hispanic householders$123,653 Black or African American householders$333,213 American Indian or Alaska Native householders $147,268 Asian householders$244,146 Some other race householders$276,314 Two or more races householders$171,813 Hispanic or Latino householders
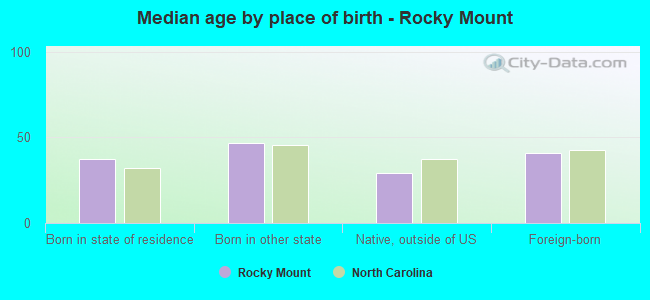
Median age by race in Rocky Mount
52.1 Median age for White residents48.1 55.6 38.3 Median age for Black or African American residents33.0 43.7 50.8 Median age for American Indian / Alaska Native residents23.3 34.7 19.3 Median age for Asian residents46.8 18.1 -609,884,331.7 Median age for Native Hawaiian / Pacific Islander residents-611,708,482.1 -666,666,666.0 15.0 Median age for Other race residents17.3 34.1 18.4 Median age for Two or more races residents17.5 20.8 52.9 Median age for White alone residents48.0 57.0 26.2 Median age for Hispanic or Latino residents25.0 28.1
Owner/renter occupied households by race in Rocky Mount
House owners and renters - White residents 5,602 74.5% Owner occupied1,915 25.5% Renter occupiedHouse owners and renters - Black or African American residents 4,735 35.8% Owner occupied8,498 64.2% Renter occupiedHouse owners and renters - American Indian / Alaska Native residents 65 58.9% Owner occupied45 41.1% Renter occupiedHouse owners and renters - Asian residents 166 80.3% Owner occupied41 19.7% Renter occupiedHouse owners and renters - Native Hawaiian / Pacific Islander residents 12 23.1% Owner occupied40 76.9% Renter occupiedHouse owners and renters - Other race residents 173 73.6% Owner occupied62 26.4% Renter occupiedHouse owners and renters - Two or more races residents 346 39.6% Owner occupied527 60.4% Renter occupiedHouse owners and renters - White alone residents 5,587 75.4% Owner occupied1,823 24.6% Renter occupiedHouse owners and renters - Hispanic or Latino residents 412 38.8% Owner occupied649 61.2% Renter occupied
Language usage in Rocky Mount
English speakers - Total 95.0% of residents of Rocky Mount speak English at home.
2.9% of residents speak Spanish at home 1,149 74.8% Speak English very well388 25.2% Speak English less than very well1.8% of residents speak other language at home 621 66.8% Speak English very well308 33.2% Speak English less than very well
English speakers - Born in the United States 97.2% of residents of Rocky Mount speak English at home.
1.9% of residents speak Spanish at home 230 94.3% Speak English very well14 5.7% Speak English less than very well0.8% of residents speak other language at home 101 100.0% Speak English very well
English speakers - Native, born elsewhere 48.6% of residents of Rocky Mount speak English at home.
29.9% of residents speak Spanish at home 48 57.8% Speak English very well35 42.2% Speak English less than very well24.8% of residents speak other language at home 69 100.0% Speak English very well
English speakers - Foreign-born 22.4% of residents of Rocky Mount speak English at home.
40.3% of residents speak Spanish at home 352 51.0% Speak English very well338 49.0% Speak English less than very well37.2% of residents speak other language at home 335 52.6% Speak English very well302 47.4% Speak English less than very well
White (Caucasian) - Speak only English Native:
97.8% (14,842)Foreign-born:
42.7% (121)
White (Caucasian) - Speak another language Native:
2.3% (346)Foreign-born:
58.4% (165)
Black or African American - Speak only English Native:
99.6% (31,519)Foreign-born:
47.9% (50)
Black or African American - Speak another language Native:
0.5% (163)Foreign-born:
52.2% (54)
Asian - Speak only English Native:
33.7% (22)Foreign-born:
24.9% (153)
Asian - Speak another language Native:
66.5% (43)Foreign-born:
74.9% (460)
Other race - Speak only English Native:
84.8% (913)Foreign-born:
11.4% (50)
Other race - Speak another language Native:
16.4% (177)Foreign-born:
88.0% (389)
Two or more races - Speak another language Native:
17.7% (367)Foreign-born:
100.0% (291)
White alone - Speak only English Native:
97.6% (14,768)Foreign-born:
51.3% (114)
White alone - Speak another language Native:
2.5% (375)Foreign-born:
48.8% (109)
Hispanic or Latino - Speak only English Native:
40.6% (575)Foreign-born:
8.6% (58)
Hispanic or Latino - Speak another language Native:
48.7% (689)Foreign-born:
99.4% (667)
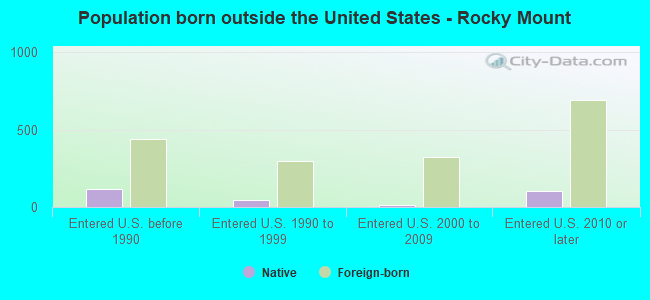
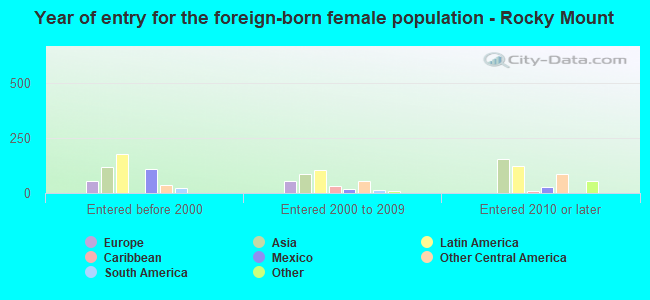
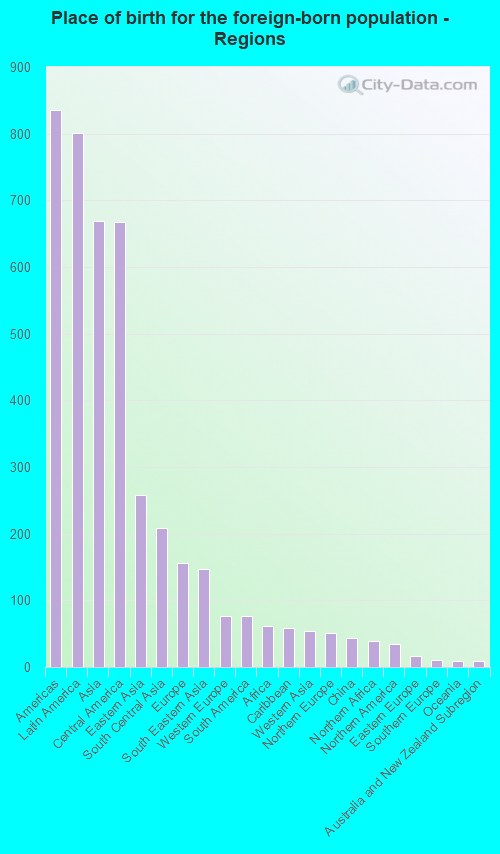
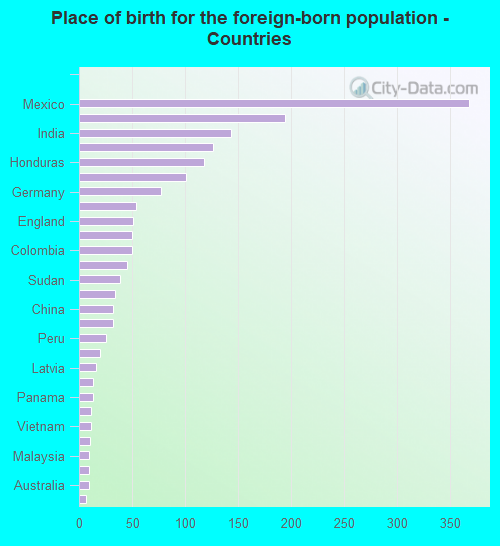
Foreign-born residents in Rocky Mount 1,733 residents are foreign born (1.4% Latin America , 1.2% Asia ).
This city:
3.2%North Carolina:
8.3%
Marital status for residents in Rocky Mount Marital status - White (Caucasian) population 15 years and over
Males 35.2% Never married48.8% Now married2.0% Separated3.1% Widowed10.9% DivorcedFemales 20.4% Never married43.2% Now married6.2% Separated13.3% Widowed16.9% DivorcedWomen who gave birth in the past 12 months Now married:
100.0% (63)Unmarried:
0.0% (0)
Women who did not give birth in the past 12 months Now married:
43.5% (1,135)Unmarried:
56.5% (1,475)
Marital status - Black or African American population 15 years and over
Males 50.4% Never married30.3% Now married6.2% Separated3.8% Widowed9.3% DivorcedFemales 47.3% Never married23.1% Now married5.0% Separated10.4% Widowed14.3% DivorcedWomen who gave birth in the past 12 months Now married:
70.0% (84)Unmarried:
30.0% (36)
Women who did not give birth in the past 12 months Now married:
18.3% (1,510)Unmarried:
81.7% (6,753)
Marital status - American Indian / Alaska Native population 15 years and over
Males 30.5% Never married58.1% Now married0.0% Separated0.0% Widowed11.4% DivorcedFemales 9.8% Never married70.7% Now married0.0% Separated0.0% Widowed19.6% DivorcedWomen who did not give birth in the past 12 months Now married:
68.6% (62)Unmarried:
31.4% (29)
Marital status - Asian population 15 years and over
Males 25.6% Never married74.4% Now married0.0% Separated0.0% Widowed0.0% DivorcedFemales 13.7% Never married61.2% Now married0.0% Separated6.9% Widowed18.2% DivorcedWomen who did not give birth in the past 12 months Now married:
66.9% (125)Unmarried:
33.1% (62)
Marital status - Other race population 15 years and over
Males 21.2% Never married57.3% Now married0.0% Separated11.8% Widowed9.7% DivorcedFemales 12.3% Never married64.3% Now married12.3% Separated5.3% Widowed5.8% DivorcedWomen who gave birth in the past 12 months Now married:
100.0% (137)Unmarried:
0.0% (0)
Women who did not give birth in the past 12 months Now married:
68.8% (221)Unmarried:
31.2% (100)
Marital status - Two or more races population 15 years and over
Males 57.2% Never married19.6% Now married8.7% Separated0.0% Widowed14.5% DivorcedFemales 44.4% Never married35.8% Now married18.0% Separated1.8% Widowed0.0% DivorcedWomen who did not give birth in the past 12 months Now married:
36.6% (175)Unmarried:
63.4% (304)
Marital status - White alone, not Hispanic / Latino population 15 years and over
Males 34.3% Never married49.3% Now married2.1% Separated3.2% Widowed11.1% DivorcedFemales 19.4% Never married43.2% Now married6.4% Separated13.7% Widowed17.4% DivorcedWomen who gave birth in the past 12 months Now married:
100.0% (45)Unmarried:
0.0% (0)
Women who did not give birth in the past 12 months Now married:
44.4% (1,104)Unmarried:
55.6% (1,382)
Marital status - Hispanic or Latino population 15 years and over
Males 49.8% Never married31.6% Now married8.5% Separated5.5% Widowed4.6% DivorcedFemales 30.3% Never married52.0% Now married10.9% Separated3.2% Widowed3.5% DivorcedWomen who gave birth in the past 12 months Now married:
100.0% (129)Unmarried:
0.0% (0)
Women who did not give birth in the past 12 months Now married:
48.1% (228)Unmarried:
51.9% (246)
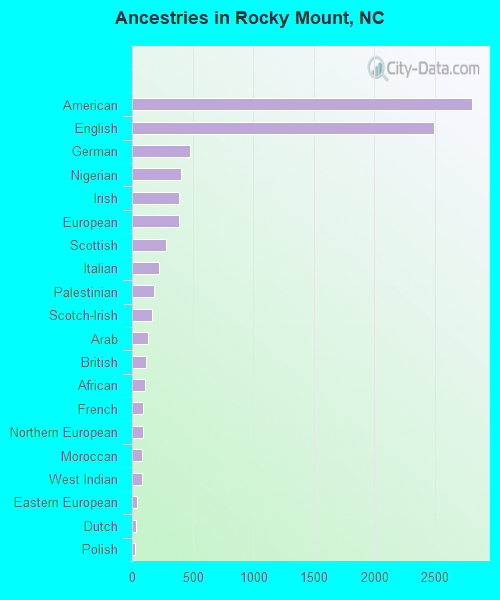
Ancestries in Rocky Mount
2,809 7.5% American2,494 6.7% English482 1.3% German404 1.1% Nigerian390 1.0% Irish387 1.0% European278 0.7% Scottish221 0.6% Italian179 0.5% Palestinian167 0.4% Scotch-Irish136 0.4% Arab112 0.3% British111 0.3% African88 0.2% French88 0.2% Northern European81 0.2% Moroccan79 0.2% West Indian39 0.1% Eastern European29 0.08% Dutch28 0.08% Polish24 0.06% Norwegian14 0.04% British West Indian8 0.02% Jamaican6 0.02% Ukrainian5 0.01% Greek
Geographical mobility in Rocky Mount Same house 1 year ago 13,507 86.9% White (Caucasian)27,803 83.6% Black or African American254 100.0% American Indian / Alaska Native514 71.2% Asian62 100.0% Native Hawaiian / Pacific Islander1,330 98.9% Other race1,986 72.5% Two or more races13,441 87.1% White alone, not Hispanic / Latino1,724 74.4% Hispanic or LatinoMoved within same county 642 4.1% White / Caucasian2,053 6.2% Black or African American42 5.8% Asian2 0.1% Other race427 15.6% Two or more races642 4.2% White alone, not Hispanic / Latino341 14.7% Hispanic or LatinoMoved within same state 492 3.2% White / Caucasian2,217 6.7% Black or African American15 2.1% Asian109 4.0% Two or more races433 2.8% White alone, not Hispanic / Latino87 3.7% Hispanic or LatinoMoved from different state 1,027 6.6% White / Caucasian768 2.3% Black or African American18 2.5% Asian55 4.1% Other race138 5.1% Two or more races1,027 6.7% White alone, not Hispanic / Latino88 3.8% Hispanic or LatinoMoved from abroad 32 0.2% White39 0.1% Black or African American160 22.1% Asian21 1.6% Other race97 0.6% White alone, not Hispanic / Latino22 1.0% Hispanic or Latino
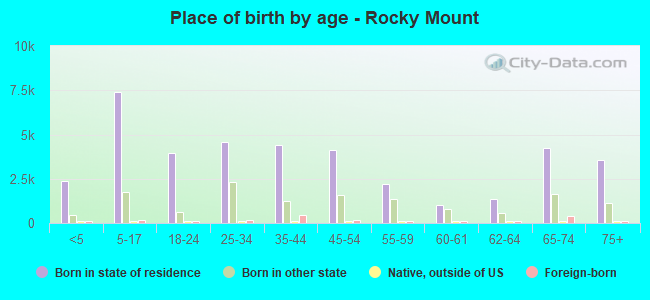
Children Nativity (place of birth) in Rocky Mount
Children under 6 years - Living with two parents Both parents native 1,129 100.0% Native0 0.0% Foreign-bornBoth parents foreign-born 65 77.3% Native19 22.7% Foreign-bornOne native, one foreign-born parent 34 100.0% NativeChildren under 6 years - Living with one parent Native parent 1,826 100.0% NativeForeign-born parent 138 100.0% NativeChildren 6 to 17 years - Living with two parents Both parents native 2,220 99.0% Native22 1.0% Foreign-bornBoth parents foreign-born 33 29.8% Native78 70.2% Foreign-bornOne native, one foreign-born parent 86 100.0% NativeChildren 6 to 17 years - Living with one parent Native parent 5,114 100.0% NativeForeign-born parent 310 51.0% Native299 49.0% Foreign-born
Grandparents responsible for own grandchildren in Rocky Mount
Grandparents (30 to 59 years) White / Caucasian 37 16.3% Responsible for grandchildren188 83.7% Not responsible for grandchildrenBlack or African American 173 44.5% Responsible for grandchildren215 55.5% Not responsible for grandchildrenOther race 86 100.0% Not responsible for grandchildrenWhite alone, not Hispanic / Latino 39 16.7% Responsible for grandchildren194 83.3% Not responsible for grandchildrenHispanic or Latino 8 100.0% Not responsible for grandchildrenGrandparents (60 years and over) White / Caucasian 76 82.7% Responsible for grandchildren16 17.3% Not responsible for grandchildrenBlack or African American 301 37.5% Responsible for grandchildren501 62.5% Not responsible for grandchildrenOther race 13 100.0% Not responsible for grandchildrenWhite alone, not Hispanic / Latino 78 82.8% Responsible for grandchildren16 17.2% Not responsible for grandchildrenHispanic or Latino 18 100.0% Not responsible for grandchildren