Races in Rocky River, Ohio (OH) Detailed Stats
Ancestries, Foreign-born residents, place of birth
Settings
X


Recent posts about races in Rocky River, Ohio on our local forum with over 2,400,000 registered users:
 | Is Columbus the best city in the Midwest? (709 replies) |
| Is it right time to buy house in Cleveland suburbs? (32 replies) |
| Raising kids in Westlake, Rocky River, Lakewood.. appreciate your candor (lol) (17 replies) |
| WHERE SHOULD I MOVE?! (another post on Rocky River and Shaker Heights) (12 replies) |
| Cleveland Development Discussions (4357 replies) |
| Charming “Main Street” Places in or near Cleveland (133 replies) |
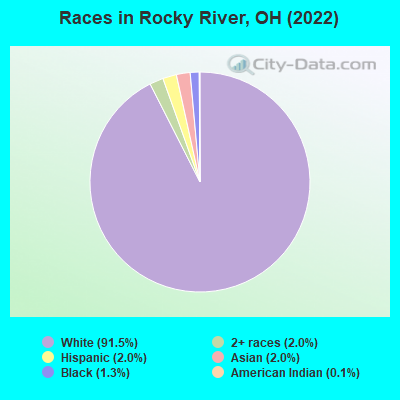
According to 2022 data, the most numerous races in Rocky River, OH are White alone (19,405 residents), Black alone (284 residents), and Two or more races (431 residents). 87.8% of Rocky River residents speak English at home. 10.3% of Rocky River, OH residents are foreign-born (5.7% born in Europe, 3.1% born in Asia), which is 61.0% greater than the foreign-born rate of 4.0% across the entire state of Ohio.
Race distribution in Rocky River
2000
2022

- 19,89195.9%White alone
- 2731.3%Asian alone
- 2481.2%Hispanic
- 2091.0%Two or more races
- 800.4%Black alone
- 190.09%Other race alone
- 110.05%American Indian alone
- 40.02%Native Hawaiian and Other
Pacific Islander alone

-
- 19,40591.5%White alone
- 4312.0%Two or more races
- 4312.0%Hispanic
- 4172.0%Asian alone
- 2841.3%Black alone
- 310.1%American Indian alone
- 140.07%Other race alone
2000
2022
-
- 9,538,11184.0%White alone
- 1,290,66211.4%Black alone
- 217,1231.9%Hispanic
- 137,7701.2%Two or more races
- 131,6701.2%Asian alone
- 21,9850.2%American Indian alone
- 13,4830.1%Other race alone
- 2,3360.02%Native Hawaiian and Other
Pacific Islander alone

-
- 8,948,79376.1%White alone
- 1,401,40311.9%Black alone
- 529,2914.5%Two or more races
- 517,2324.4%Hispanic
- 293,3872.5%Asian alone
- 52,8050.4%Other race alone
- 9,7850.08%American Indian alone
- 3,3620.03%Native Hawaiian and Other
Pacific Islander alone

Income and house value in Rocky River
- Median household income in 2022
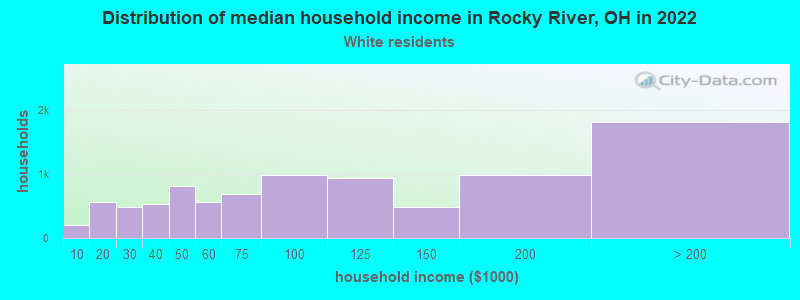
- $89,590White non-Hispanic householders
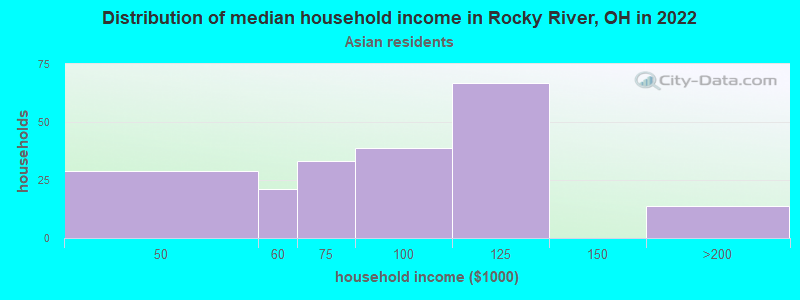
- $82,769Asian householders
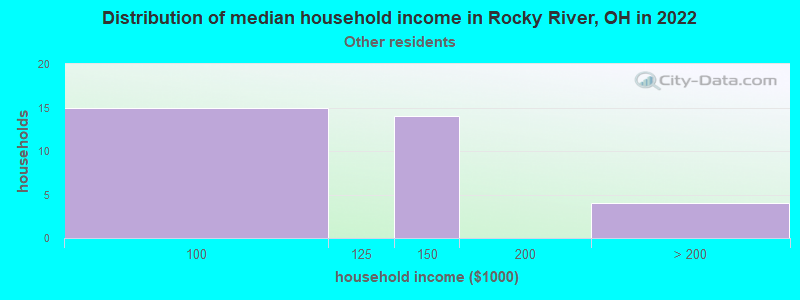
- $148,985Some other race householders
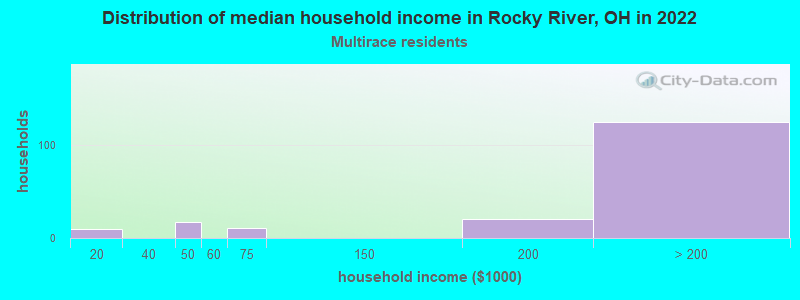
- over $200,000Two or more races householders
- Median 2022 house value
- $363,296White Non-Hispanic householders
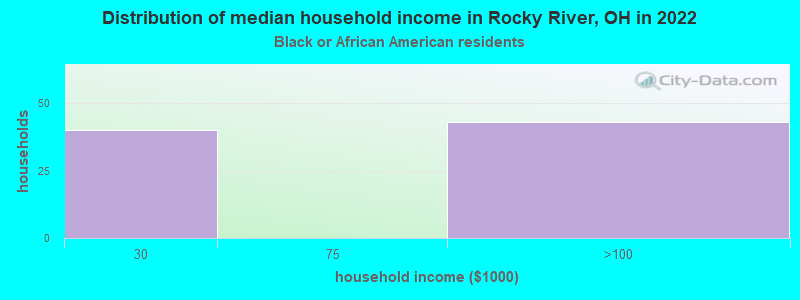
- $143,708Black or African American householders
- $162,870American Indian or Alaska Native householders
- $270,364Asian householders
- $269,406Some other race householders
- $182,031Two or more races householders
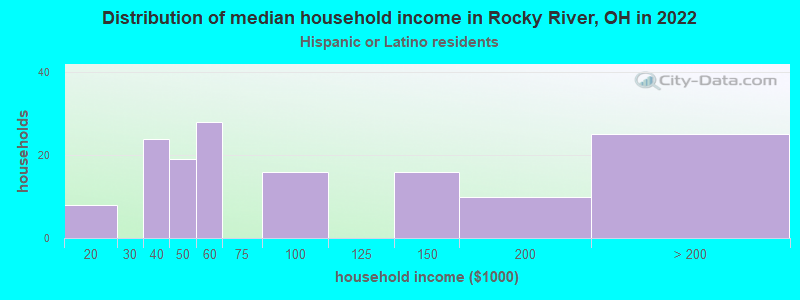
- $317,309Hispanic or Latino householders
Household income for White non-Hispanic householders
Household income for Black householders
Household income for Asian householders
Household income for Some other race householders
Household income for Two or more races householders
Household income for Hispanic or Latino race householders
Median age by race in Rocky River
- 44.7Median age for White residents
- 44.3Males
- 45.2Females
- 49.0Median age for Black or African American residents
- 42.2Males
- 63.8Females
- 40.2Median age for American Indian / Alaska Native residents
- -734,374,999.3Males
- -499,999,999.5Females
- 43.3Median age for Asian residents
- 43.5Males
- 45.9Females
- -706,093,189.3Median age for Native Hawaiian / Pacific Islander residents
- -750,242,953.6Males
- -805,394,989.6Females
- 65.4Median age for Other race residents
- -613,026,819.3Males
- -710,103,870.9Females
- 17.9Median age for Two or more races residents
- 29.1Males
- 11.7Females
- 44.6Median age for White alone residents
- 44.1Males
- 44.9Females
- 26.0Median age for Hispanic or Latino residents
- 27.0Males
- 10.9Females
Owner/renter occupied households by race in Rocky River
- House owners and renters - White residents
- 6,48971.6%Owner occupied
- 2,57928.4%Renter occupied
- House owners and renters - Black or African American residents
- 80100.0%Renter occupied
- House owners and renters - American Indian / Alaska Native residents
- 17100.0%Renter occupied
- House owners and renters - Asian residents
- 20089.0%Owner occupied
- 2511.0%Renter occupied
- House owners and renters - Other race residents
- 1642.3%Owner occupied
- 2257.7%Renter occupied
- House owners and renters - Two or more races residents
- 15376.6%Owner occupied
- 4723.4%Renter occupied
- House owners and renters - White alone residents
- 6,49871.2%Owner occupied
- 2,62828.8%Renter occupied
- House owners and renters - Hispanic or Latino residents
- 9758.1%Owner occupied
- 7041.9%Renter occupied
Language usage in Rocky River
- English speakers - Total
- 87.8% of residents of Rocky River speak English at home.
- 0.2% of residents speak Spanish at home
- 37100.0%Speak English very well
- 12.3% of residents speak other language at home
- 1,83675.4%Speak English very well
- 60024.6%Speak English less than very well
- English speakers - Born in the United States
- 95.6% of residents of Rocky River speak English at home.
- 4.9% of residents speak other language at home
- 19094.5%Speak English very well
- 115.5%Speak English less than very well
- English speakers - Native, born elsewhere
- 80.6% of residents of Rocky River speak English at home.
- 28.2% of residents speak other language at home
- 1314.4%Speak English very well
- 7785.6%Speak English less than very well
- English speakers - Foreign-born
- 23.4% of residents of Rocky River speak English at home.
- 76.4% of residents speak other language at home
- 1,13370.9%Speak English very well
- 46429.1%Speak English less than very well
White (Caucasian) - Speak only English
| Native: | 96.7% (15,760) |
| Foreign-born: | 29.6% (472) |
White (Caucasian) - Speak another language
| Native: | 3.4% (557) |
| Foreign-born: | 70.5% (1,123) |
Asian - Speak only English
| Native: | 69.8% (134) |
| Foreign-born: | 6.3% (15) |
Asian - Speak another language
| Native: | 27.4% (53) |
| Foreign-born: | 93.6% (218) |
Two or more races - Speak another language
| Native: | 3.7% (22) |
| Foreign-born: | 100.0% (120) |
White alone - Speak only English
| Native: | 95.6% (15,707) |
| Foreign-born: | 28.0% (460) |
White alone - Speak another language
| Native: | 4.4% (729) |
| Foreign-born: | 72.0% (1,182) |
Hispanic or Latino - Speak only English
| Native: | 100.0% (391) |
| Foreign-born: | 66.3% (16) |
Hispanic or Latino - Speak another language
| Native: | 1.5% (6) |
| Foreign-born: | 4.7% (1) |
Foreign-born residents in Rocky River
2,173 residents are foreign born (5.7% Europe, 3.1% Asia).
| This city: | 10.3% |
| Ohio: | 4.9% |


Marital status for residents in Rocky River
Marital status - White (Caucasian) population 15 years and over
- Males
- 26.4%Never married
- 63.1%Now married
- 0.6%Separated
- 2.8%Widowed
- 7.1%Divorced
- Females
- 29.4%Never married
- 50.9%Now married
- 0.1%Separated
- 10.8%Widowed
- 8.8%Divorced
Women who gave birth in the past 12 months
| Now married: | 98.0% (323) |
| Unmarried: | 2.0% (7) |
Women who did not give birth in the past 12 months
| Now married: | 40.6% (1,558) |
| Unmarried: | 59.4% (2,280) |
Marital status - Black or African American population 15 years and over
- Males
- 13.5%Never married
- 34.9%Now married
- 0.0%Separated
- 0.0%Widowed
- 51.6%Divorced
- Females
- 6.2%Never married
- 5.4%Now married
- 0.0%Separated
- 5.4%Widowed
- 83.0%Divorced
Women who did not give birth in the past 12 months
| Now married: | 0.0% (0) |
| Unmarried: | 100.0% (41) |
Marital status - Asian population 15 years and over
- Males
- 41.1%Never married
- 58.9%Now married
- 0.0%Separated
- 0.0%Widowed
- 0.0%Divorced
- Females
- 33.2%Never married
- 49.7%Now married
- 7.0%Separated
- 10.2%Widowed
- 0.0%Divorced
Women who did not give birth in the past 12 months
| Now married: | 40.4% (43) |
| Unmarried: | 59.6% (64) |
Marital status - Other race population 15 years and over
- Males
- 30.0%Never married
- 0.0%Now married
- 0.0%Separated
- 70.0%Widowed
- 0.0%Divorced
- Females
- 100.0%Never married
- 0.0%Now married
- 0.0%Separated
- 0.0%Widowed
- 0.0%Divorced
Women who did not give birth in the past 12 months
| Now married: | 0.0% (0) |
| Unmarried: | 100.0% (21) |
Marital status - Two or more races population 15 years and over
- Males
- 43.0%Never married
- 57.0%Now married
- 0.0%Separated
- 0.0%Widowed
- 0.0%Divorced
- Females
- 29.9%Never married
- 64.6%Now married
- 0.0%Separated
- 4.8%Widowed
- 0.7%Divorced
Women who did not give birth in the past 12 months
| Now married: | 53.7% (60) |
| Unmarried: | 46.3% (52) |
Marital status - White alone, not Hispanic / Latino population 15 years and over
- Males
- 25.9%Never married
- 63.4%Now married
- 0.6%Separated
- 2.9%Widowed
- 7.2%Divorced
- Females
- 29.3%Never married
- 50.8%Now married
- 0.1%Separated
- 10.8%Widowed
- 8.9%Divorced
Women who gave birth in the past 12 months
| Now married: | 98.0% (332) |
| Unmarried: | 2.0% (7) |
Women who did not give birth in the past 12 months
| Now married: | 40.4% (1,581) |
| Unmarried: | 59.6% (2,330) |
Marital status - Hispanic or Latino population 15 years and over
- Males
- 62.4%Never married
- 37.6%Now married
- 0.0%Separated
- 0.0%Widowed
- 0.0%Divorced
- Females
- 62.2%Never married
- 37.8%Now married
- 0.0%Separated
- 0.0%Widowed
- 0.0%Divorced
Women who did not give birth in the past 12 months
| Now married: | 27.3% (22) |
| Unmarried: | 72.7% (58) |
Ancestries in Rocky River

- 1,09412.3%Irish
- 98311.0%German
- 8109.1%Albanian
- 7057.9%Italian
- 6567.4%English
- 4314.8%American
- 4234.8%Polish
- 2602.9%European
- 2132.4%Hungarian
- 2042.3%Romanian
- 1792.0%Slovak
- 1742.0%Lebanese
- 1411.6%Arab
- 1351.5%Syrian
- 1241.4%Eastern European
- 991.1%Ukrainian
- 961.1%British
- 901.0%Yugoslavian
- 871.0%Bulgarian
- 830.9%Croatian
- 790.9%Greek
- 750.8%Scottish
- 590.7%Czech
- 560.6%African
- 510.6%Dutch
- 510.6%Scotch-Irish
- 490.6%Slovene
- 480.5%Russian
- 410.5%French
- 400.4%French Canadian
- 330.4%Austrian
- 320.4%Norwegian
- 260.3%Latvian
- 190.2%Swedish
- 160.2%Armenian
- 160.2%South African
- 140.2%Lithuanian
- 140.2%Serbian
- 80.09%Czechoslovakian
- 50.06%Brazilian

Geographical mobility in Rocky River

- Same house 1 year ago
- 16,65588.5%White (Caucasian)
- 13949.1%Black or African American
- 38100.0%American Indian / Alaska Native
- 34081.6%Asian
- 3791.6%Other race
- 80697.9%Two or more races
- 16,76588.1%White alone, not Hispanic / Latino
- 41896.9%Hispanic or Latino

-
- Moved within same county
- 1,3457.1%White / Caucasian
- 12845.1%Black or African American
- 4510.9%Asian
- 1,4047.4%White alone, not Hispanic / Latino

-
- Moved within same state
- 3371.8%White / Caucasian
- 202.5%Two or more races
- 3401.8%White alone, not Hispanic / Latino

-
- Moved from different state
- 4792.5%White / Caucasian
- 5082.7%White alone, not Hispanic / Latino

-
- Moved from abroad
- 110.1%White
- 368.8%Asian
- 140.1%White alone, not Hispanic / Latino

Children Nativity (place of birth) in Rocky River
Place of birth for residents in Rocky River
![Place of birth for the foreign-born population - Regions]()
- 1,251Europe
- 910Eastern Europe
- 695Asia
- 442Western Asia
- 133Southern Europe
- 132Americas
- 121South Central Asia
- 115Northern Europe
- 98Eastern Asia
- 98China
- 95Africa
- 92Western Europe
- 86Northern America
- 79Northern Africa
- 46Latin America
- 45South America
- 32South Eastern Asia
- 15Southern Africa
- 1Central America

![Place of birth for the foreign-born population - Countries]()
- 381Albania
- 207Romania
- 186Syria
- 181Lebanon
- 121India
- 107United Kingdom
- 106Hungary
- 86Canada
- 83Bosnia and Herzegovina
- 79Egypt
- 71Italy
- 65Hong Kong
- 61Greece
- 50Germany
- 41France
- 39Israel
- 33Latvia
- 32China
- 32Philippines
- 29Croatia
- 29Ukraine
- 23Brazil
- 22Bulgaria
- 21Colombia
- 20Jordan
- 15South Africa
- 14Saudi Arabia
- 8England
- 1Nicaragua

Grandparents responsible for own grandchildren in Rocky River
Zip codes: 44116.