Races in Rolling Meadows, Illinois (IL) Detailed Stats
Data:
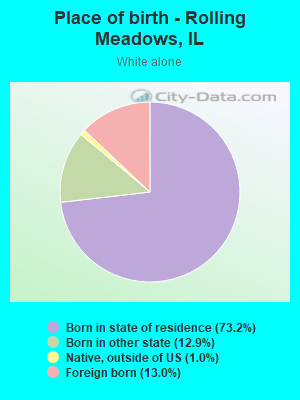
Races - White alone (%)
Races - White alone (% change since 2000)
Races - Black alone (%)
Races - Black alone (% change since 2000)
Races - American Indian alone (%)
Races - American Indian alone (% change since 2000)
Races - Asian alone (%)
Races - Asian alone (% change since 2000)
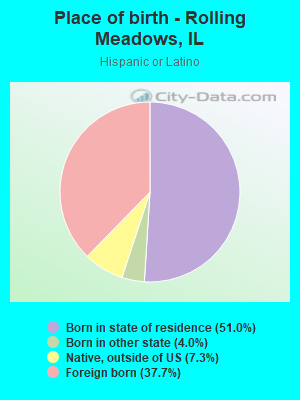
Races - Hispanic (%)
Races - Hispanic (% change since 2000)
Races - Native Hawaiian and Other Pacific Islander alone (%)
Races - Native Hawaiian and Other Pacific Islander alone (% change since 2000)
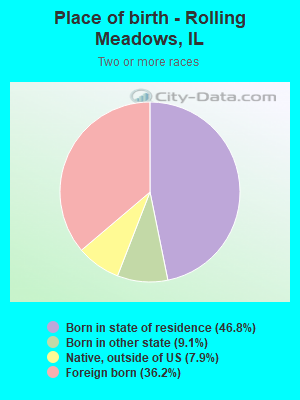
Races - Two or more races(%)
Races - Two or more races(% change since 2000)
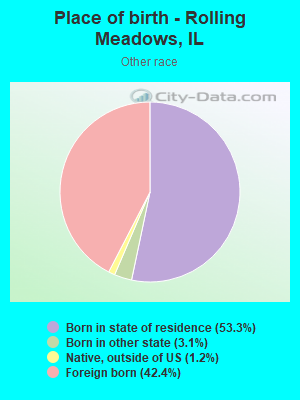
Races - Other race alone (%)
Races - Other race alone (% change since 2000)
Racial diversity
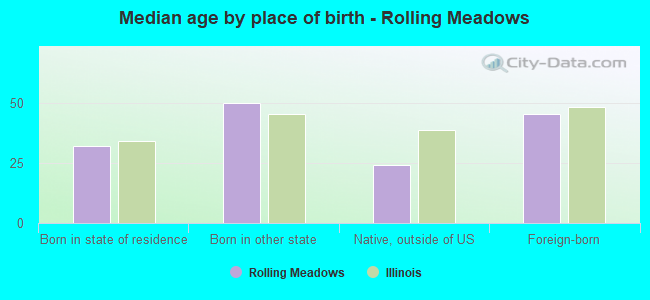
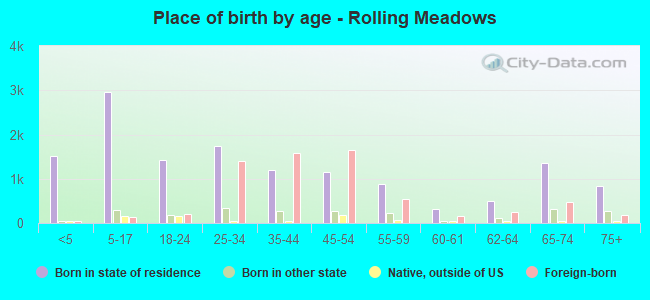
Place of birth - Born in state of residence (%)
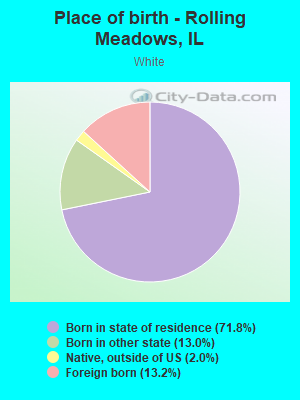
Place of birth - Born in state of residence (%) - White
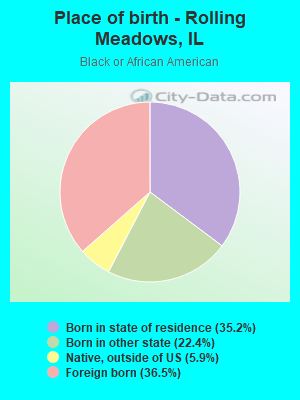
Place of birth - Born in state of residence (%) - Black or African American
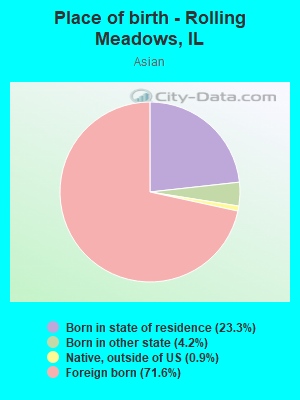
Place of birth - Born in state of residence (%) - Asian
Place of birth - Born in state of residence (%) - Hispanic or Latino
Place of birth - Born in state of residence (%) - American Indian and Alaska Native
Place of birth - Born in state of residence (%) - Multirace
Place of birth - Born in state of residence (%) - Other Race
Place of birth - Born in other state (%)
Place of birth - Born in other state (%) - White
Place of birth - Born in other state (%) - Black or African American
Place of birth - Born in other state (%) - Asian
Place of birth - Born in other state (%) - Hispanic or Latino
Place of birth - Born in other state (%) - American Indian and Alaska Native
Place of birth - Born in other state (%) - Multirace
Place of birth - Born in other state (%) - Other Race
Place of birth - Native, outside of US (%)
Place of birth - Native, outside of US (%) - White
Place of birth - Native, outside of US (%) - Black or African American
Place of birth - Native, outside of US (%) - Asian
Place of birth - Native, outside of US (%) - Hispanic or Latino
Place of birth - Native, outside of US (%) - American Indian and Alaska Native
Place of birth - Native, outside of US (%) - Multirace
Place of birth - Native, outside of US (%) - Other Race
Place of birth - Foreign born (%)
Place of birth - Foreign born (%) - White
Place of birth - Foreign born (%) - Black or African American
Place of birth - Foreign born (%) - Asian
Place of birth - Foreign born (%) - Hispanic or Latino
Place of birth - Foreign born (%) - American Indian and Alaska Native
Place of birth - Foreign born (%) - Multirace
Place of birth - Foreign born (%) - Other Race
Residents speaking English at home (%)
Residents speaking English at home - Born in the United States (%)
Residents speaking English at home - Native, born elsewhere (%)
Residents speaking English at home - Foreign born (%)
Residents speaking Spanish at home (%)
Residents speaking Spanish at home - Born in the United States (%)
Residents speaking Spanish at home - Native, born elsewhere (%)
Residents speaking Spanish at home - Foreign born (%)
Residents speaking other language at home (%)
Residents speaking other language at home - Born in the United States (%)
Residents speaking other language at home - Native, born elsewhere (%)
Residents speaking other language at home - Foreign born (%)
Marital status - Never married (%)
Marital status - Now married (%)
Marital status - Separated (%)
Marital status - Widowed (%)
Marital status - Divorced (%)
Ancestries Reported - Arab (%)
Ancestries Reported - Czech (%)
Ancestries Reported - Danish (%)
Ancestries Reported - Dutch (%)
Ancestries Reported - English (%)
Ancestries Reported - French (%)
Ancestries Reported - French Canadian (%)
Ancestries Reported - German (%)
Ancestries Reported - Greek (%)
Ancestries Reported - Hungarian (%)
Ancestries Reported - Irish (%)
Ancestries Reported - Italian (%)
Ancestries Reported - Lithuanian (%)
Ancestries Reported - Norwegian (%)
Ancestries Reported - Polish (%)
Ancestries Reported - Portuguese (%)
Ancestries Reported - Russian (%)
Ancestries Reported - Scotch-Irish (%)
Ancestries Reported - Scottish (%)
Ancestries Reported - Slovak (%)
Ancestries Reported - Subsaharan African (%)
Ancestries Reported - Swedish (%)
Ancestries Reported - Swiss (%)
Ancestries Reported - Ukrainian (%)
Ancestries Reported - United States (%)
Ancestries Reported - Welsh (%)
Ancestries Reported - West Indian (%)
Ancestries Reported - Other (%)
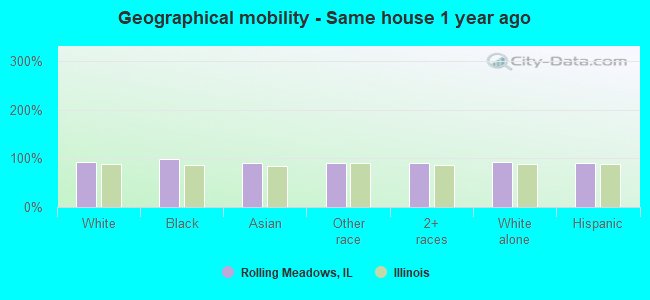
Geographical mobility - Same house 1 year ago (%)
Geographical mobility - Same house 1 year ago (%) - White
Geographical mobility - Same house 1 year ago (%) - Black or African American
Geographical mobility - Same house 1 year ago (%) - Asian
Geographical mobility - Same house 1 year ago (%) - Hispanic or Latino
Geographical mobility - Same house 1 year ago (%) - American Indian and Alaska Native
Geographical mobility - Same house 1 year ago (%) - Multirace
Geographical mobility - Same house 1 year ago (%) - Other Race
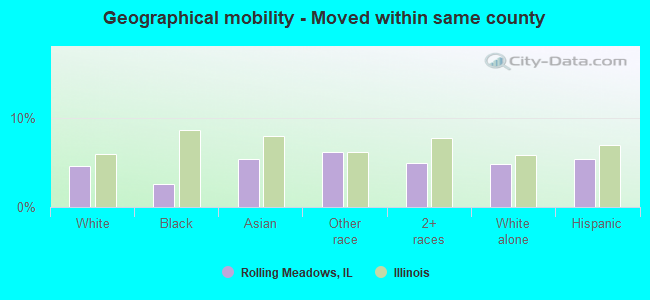
Geographical mobility - Moved within same county (%)
Geographical mobility - Moved within same county (%) - White
Geographical mobility - Moved within same county (%) - Black or African American
Geographical mobility - Moved within same county (%) - Asian
Geographical mobility - Moved within same county (%) - Hispanic or Latino
Geographical mobility - Moved within same county (%) - American Indian and Alaska Native
Geographical mobility - Moved within same county (%) - Multirace
Geographical mobility - Moved within same county (%) - Other Race
Geographical mobility - Moved from different county within same state (%)
Geographical mobility - Moved from different county within same state (%) - White
Geographical mobility - Moved from different county within same state (%) - Black or African American
Geographical mobility - Moved from different county within same state (%) - Asian
Geographical mobility - Moved from different county within same state (%) - Hispanic or Latino
Geographical mobility - Moved from different county within same state (%) - American Indian and Alaska Native
Geographical mobility - Moved from different county within same state (%) - Multirace
Geographical mobility - Moved from different county within same state (%) - Other Race
Geographical mobility - Moved from different state (%)
Geographical mobility - Moved from different state (%) - White
Geographical mobility - Moved from different state (%) - Black or African American
Geographical mobility - Moved from different state (%) - Asian
Geographical mobility - Moved from different state (%) - Hispanic or Latino
Geographical mobility - Moved from different state (%) - American Indian and Alaska Native
Geographical mobility - Moved from different state (%) - Multirace
Geographical mobility - Moved from different state (%) - Other Race
Geographical mobility - Moved from abroad (%)
Geographical mobility - Moved from abroad (%) - White
Geographical mobility - Moved from abroad (%) - Black or African American
Geographical mobility - Moved from abroad (%) - Asian
Geographical mobility - Moved from abroad (%) - Hispanic or Latino
Geographical mobility - Moved from abroad (%) - American Indian and Alaska Native
Geographical mobility - Moved from abroad (%) - Multirace
Geographical mobility - Moved from abroad (%) - Other Race
Place of birth for the foreign-born population - Ireland (%)
Place of birth for the foreign-born population - Denmark (%)
Place of birth for the foreign-born population - Norway (%)
Place of birth for the foreign-born population - Sweden (%)
Place of birth for the foreign-born population - United Kingdom (%)
Place of birth for the foreign-born population - England (%)
Place of birth for the foreign-born population - Scotland (%)
Place of birth for the foreign-born population - Other Northern Europe (%)
Place of birth for the foreign-born population - Austria (%)
Place of birth for the foreign-born population - Belgium (%)
Place of birth for the foreign-born population - France (%)
Place of birth for the foreign-born population - Germany (%)
Place of birth for the foreign-born population - Netherlands (%)
Place of birth for the foreign-born population - Switzerland (%)
Place of birth for the foreign-born population - Other Western Europe (%)
Place of birth for the foreign-born population - Greece (%)
Place of birth for the foreign-born population - Italy (%)
Place of birth for the foreign-born population - Portugal (%)
Place of birth for the foreign-born population - Spain (%)
Place of birth for the foreign-born population - Other Southern Europe (%)
Place of birth for the foreign-born population - Albania (%)
Place of birth for the foreign-born population - Belarus (%)
Place of birth for the foreign-born population - Bosnia and Herzegovina (%)
Place of birth for the foreign-born population - Bulgaria (%)
Place of birth for the foreign-born population - Croatia (%)
Place of birth for the foreign-born population - Czechoslovakia (%)
Place of birth for the foreign-born population - Hungary (%)
Place of birth for the foreign-born population - Latvia (%)
Place of birth for the foreign-born population - Lithuania (%)
Place of birth for the foreign-born population - North Macedonia (Macedonia) (%)
Place of birth for the foreign-born population - Moldova (%)
Place of birth for the foreign-born population - Poland (%)
Place of birth for the foreign-born population - Romania (%)
Place of birth for the foreign-born population - Russia (%)
Place of birth for the foreign-born population - Serbia (%)
Place of birth for the foreign-born population - Ukraine (%)
Place of birth for the foreign-born population - Other Eastern Europe (%)
Place of birth for the foreign-born population - China (%)
Place of birth for the foreign-born population - Hong Kong (%)
Place of birth for the foreign-born population - Taiwan (%)
Place of birth for the foreign-born population - Japan (%)
Place of birth for the foreign-born population - Korea (%)
Place of birth for the foreign-born population - Other Eastern Asia (%)
Place of birth for the foreign-born population - Afghanistan (%)
Place of birth for the foreign-born population - Bangladesh (%)
Place of birth for the foreign-born population - India (%)
Place of birth for the foreign-born population - Iran (%)
Place of birth for the foreign-born population - Kazakhstan (%)
Place of birth for the foreign-born population - Nepal (%)
Place of birth for the foreign-born population - Pakistan (%)
Place of birth for the foreign-born population - Sri Lanka (%)
Place of birth for the foreign-born population - Uzbekistan (%)
Place of birth for the foreign-born population - Other South Central Asia (%)
Place of birth for the foreign-born population - Burma (%)
Place of birth for the foreign-born population - Cambodia (%)
Place of birth for the foreign-born population - Indonesia (%)
Place of birth for the foreign-born population - Laos (%)
Place of birth for the foreign-born population - Malaysia (%)
Place of birth for the foreign-born population - Philippines (%)
Place of birth for the foreign-born population - Singapore (%)
Place of birth for the foreign-born population - Thailand (%)
Place of birth for the foreign-born population - Vietnam (%)
Place of birth for the foreign-born population - Other South Eastern Asia (%)
Place of birth for the foreign-born population - Armenia (%)
Place of birth for the foreign-born population - Iraq (%)
Place of birth for the foreign-born population - Israel (%)
Place of birth for the foreign-born population - Jordan (%)
Place of birth for the foreign-born population - Kuwait (%)
Place of birth for the foreign-born population - Lebanon (%)
Place of birth for the foreign-born population - Saudi Arabia (%)
Place of birth for the foreign-born population - Syria (%)
Place of birth for the foreign-born population - Turkey (%)
Place of birth for the foreign-born population - Yemen (%)
Place of birth for the foreign-born population - Other Western Asia (%)
Place of birth for the foreign-born population - Eritrea (%)
Place of birth for the foreign-born population - Ethiopia (%)
Place of birth for the foreign-born population - Kenya (%)
Place of birth for the foreign-born population - Somalia (%)
Place of birth for the foreign-born population - Uganda (%)
Place of birth for the foreign-born population - Zimbabwe (%)
Place of birth for the foreign-born population - Other Eastern Africa (%)
Place of birth for the foreign-born population - Cameroon (%)
Place of birth for the foreign-born population - Congo (%)
Place of birth for the foreign-born population - Democratic Republic of Congo (Zaire) (%)
Place of birth for the foreign-born population - Other Middle Africa (%)
Place of birth for the foreign-born population - Egypt (%)
Place of birth for the foreign-born population - Morocco (%)
Place of birth for the foreign-born population - Sudan (%)
Place of birth for the foreign-born population - Other Northern Africa (%)
Place of birth for the foreign-born population - South Africa (%)
Place of birth for the foreign-born population - Other Southern Africa (%)
Place of birth for the foreign-born population - Cabo Verde (%)
Place of birth for the foreign-born population - Ghana (%)
Place of birth for the foreign-born population - Liberia (%)
Place of birth for the foreign-born population - Nigeria (%)
Place of birth for the foreign-born population - Senegal (%)
Place of birth for the foreign-born population - Sierra Leone (%)
Place of birth for the foreign-born population - Other Western Africa (%)
Place of birth for the foreign-born population - Australia (%)
Place of birth for the foreign-born population - New Zealand (%)
Place of birth for the foreign-born population - Fiji (%)
Place of birth for the foreign-born population - Micronesia (%)
Place of birth for the foreign-born population - Bahamas (%)
Place of birth for the foreign-born population - Barbados (%)
Place of birth for the foreign-born population - Cuba (%)
Place of birth for the foreign-born population - Dominica (%)
Place of birth for the foreign-born population - Dominican Republic (%)
Place of birth for the foreign-born population - Grenada (%)
Place of birth for the foreign-born population - Haiti (%)
Place of birth for the foreign-born population - Jamaica (%)
Place of birth for the foreign-born population - St. Vincent and the Grenadines (%)
Place of birth for the foreign-born population - Trinidad and Tobago (%)
Place of birth for the foreign-born population - West Indies (%)
Place of birth for the foreign-born population - Other Caribbean (%)
Place of birth for the foreign-born population - Belize (%)
Place of birth for the foreign-born population - Costa Rica (%)
Place of birth for the foreign-born population - El Salvador (%)
Place of birth for the foreign-born population - Guatemala (%)
Place of birth for the foreign-born population - Honduras (%)
Place of birth for the foreign-born population - Mexico (%)
Place of birth for the foreign-born population - Nicaragua (%)
Place of birth for the foreign-born population - Panama (%)
Place of birth for the foreign-born population - Other Central America (%)
Place of birth for the foreign-born population - Argentina (%)
Place of birth for the foreign-born population - Bolivia (%)
Place of birth for the foreign-born population - Brazil (%)
Place of birth for the foreign-born population - Chile (%)
Place of birth for the foreign-born population - Colombia (%)
Place of birth for the foreign-born population - Ecuador (%)
Place of birth for the foreign-born population - Guyana (%)
Place of birth for the foreign-born population - Peru (%)
Place of birth for the foreign-born population - Uruguay (%)
Place of birth for the foreign-born population - Venezuela (%)
Place of birth for the foreign-born population - Other South America (%)
Place of birth for the foreign-born population - Canada (%)
Place of birth for the foreign-born population - Other Northern America (%)
Place of birth for the foreign-born population - Other (%)
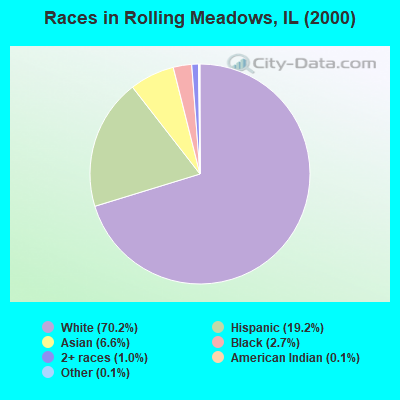
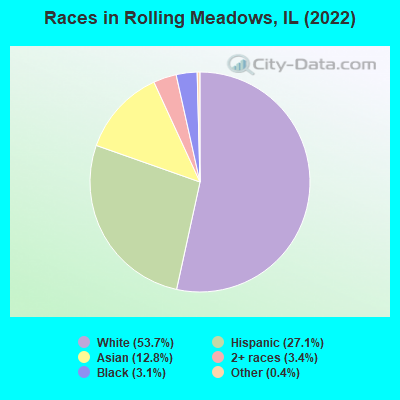
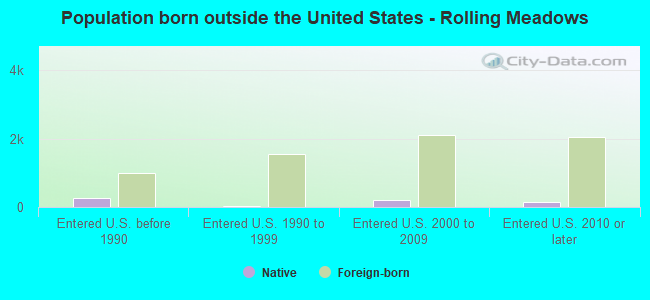
According to 2022 data, the most numerous races in Rolling Meadows, IL are White alone (12,629 residents), Hispanic (6,381 residents), and Black alone (727 residents). 57.1% of Rolling Meadows residents speak English at home. 28.3% of Rolling Meadows, IL residents are foreign-born (10.8% born in Asia, 10.4% born in Latin America, 5.8% born in Europe), which is 50.6% greater than the foreign-born rate of 14.0% across the entire state of Illinois.
Race distribution in Rolling Meadows
2000 2022
8,424,140 67.8% White alone 1,856,152 14.9% Black alone 1,530,262 12.3% Hispanic 419,916 3.4% Asian alone 153,996 1.2% Two or more races 13,479 0.1% Other race alone 18,232 0.1% American Indian alone 3,116 0.03% Native Hawaiian and Other
7,356,301 58.5% White alone 2,299,726 18.3% Hispanic 1,660,423 13.2% Black alone 747,296 5.9% Asian alone 458,599 3.6% Two or more races 45,386 0.4% Other race alone 10,405 0.08% American Indian alone 3,896 0.03% Native Hawaiian and Other
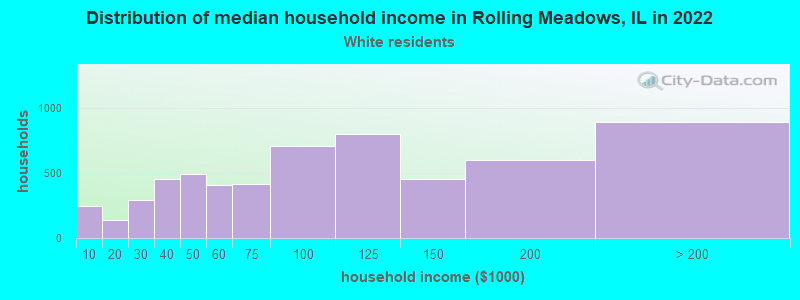
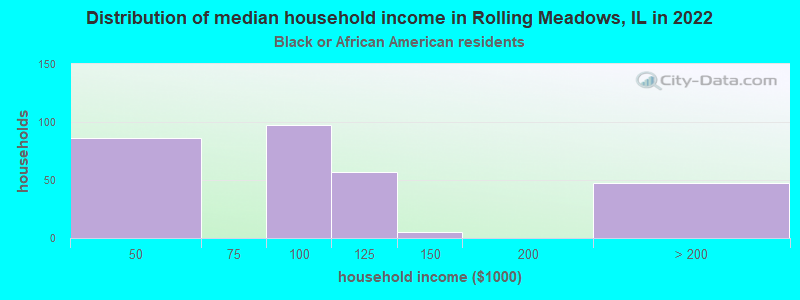
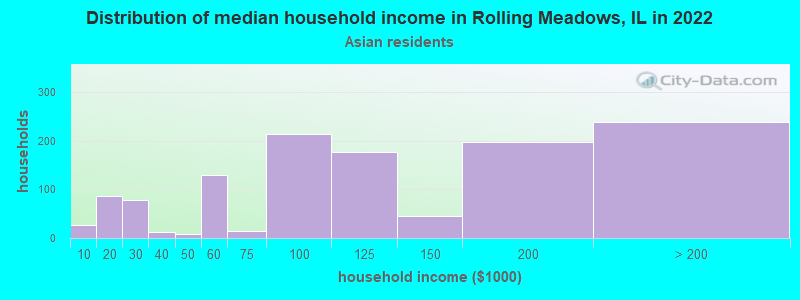
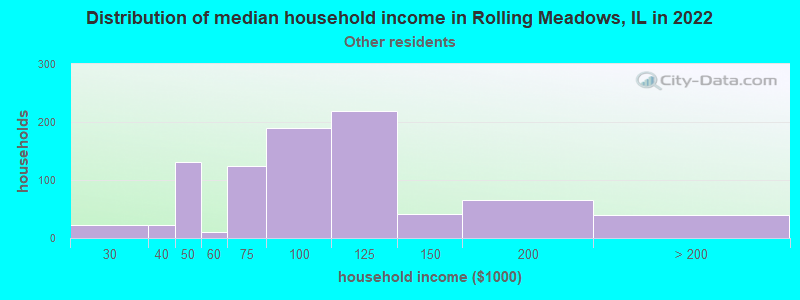
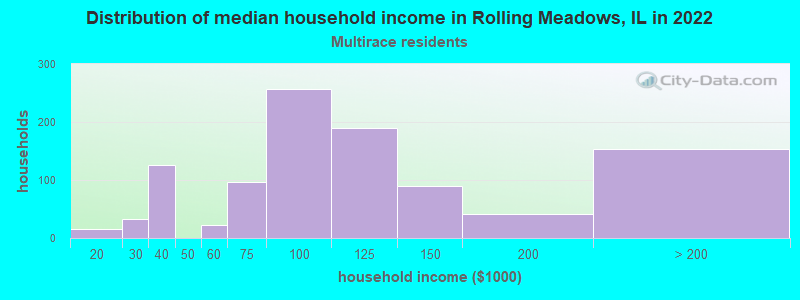
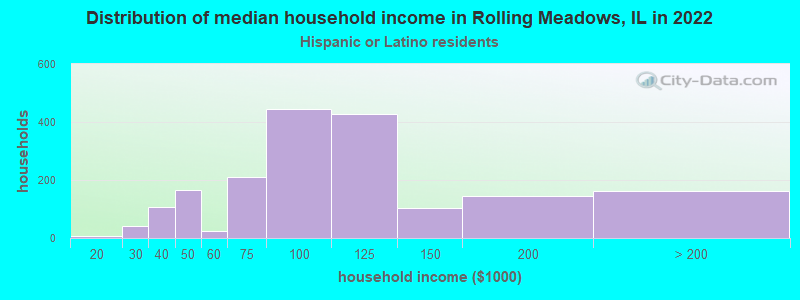
Income and house value in Rolling Meadows Median household income in 2022 $88,250 White non-Hispanic householders$89,976 Black householders$96,432 Asian householders$88,017 Some other race householders$88,080 Two or more races householders$92,014 Hispanic or Latino race householdersMedian 2022 house value $308,528 White Non-Hispanic householders$388,999 Black or African American householders $426,950 Asian householders$614,949 Native Hawaiian and other Pacific Islander householders$284,633 Some other race householders$325,044 Two or more races householders$280,944 Hispanic or Latino householders
Median age by race in Rolling Meadows
44.1 Median age for White residents40.2 46.3 43.7 Median age for Black or African American residents48.1 43.1 -680,473,372.1 Median age for American Indian / Alaska Native residents-736,736,736.0 -641,399,416.3 36.4 Median age for Asian residents32.5 40.0 -687,999,999.3 Median age for Native Hawaiian / Pacific Islander residents-918,721,460.3 -610,229,276.3 32.4 Median age for Other race residents30.8 32.6 33.1 Median age for Two or more races residents28.9 36.5 45.9 Median age for White alone residents42.2 48.5 29.2 Median age for Hispanic or Latino residents29.3 29.1
Owner/renter occupied households by race in Rolling Meadows
House owners and renters - White residents 4,676 79.3% Owner occupied1,218 20.7% Renter occupiedHouse owners and renters - Black or African American residents 35 12.9% Owner occupied239 87.1% Renter occupiedHouse owners and renters - Asian residents 956 75.0% Owner occupied319 25.0% Renter occupiedHouse owners and renters - Other race residents 396 49.3% Owner occupied407 50.7% Renter occupiedHouse owners and renters - Two or more races residents 585 56.0% Owner occupied460 44.0% Renter occupiedHouse owners and renters - White alone residents 4,656 80.5% Owner occupied1,125 19.5% Renter occupiedHouse owners and renters - Hispanic or Latino residents 979 55.2% Owner occupied795 44.8% Renter occupied
Language usage in Rolling Meadows
English speakers - Total 57.1% of residents of Rolling Meadows speak English at home.
21.3% of residents speak Spanish at home 2,553 54.6% Speak English very well2,124 45.4% Speak English less than very well21.8% of residents speak other language at home 3,207 66.9% Speak English very well1,585 33.1% Speak English less than very well
English speakers - Born in the United States 81.1% of residents of Rolling Meadows speak English at home.
8.2% of residents speak Spanish at home 151 79.9% Speak English very well38 20.1% Speak English less than very well11.5% of residents speak other language at home 265 100.0% Speak English very well
English speakers - Native, born elsewhere 20.7% of residents of Rolling Meadows speak English at home.
63.9% of residents speak Spanish at home 268 62.6% Speak English very well160 37.4% Speak English less than very well14.8% of residents speak other language at home 87 87.9% Speak English very well12 12.1% Speak English less than very well
English speakers - Foreign-born 9.2% of residents of Rolling Meadows speak English at home.
34.6% of residents speak Spanish at home 654 28.4% Speak English very well1,652 71.6% Speak English less than very well56.2% of residents speak other language at home 2,258 60.3% Speak English very well1,487 39.7% Speak English less than very well
White (Caucasian) - Speak only English Native:
92.1% (9,515)Foreign-born:
11.7% (200)
White (Caucasian) - Speak another language Native:
8.9% (917)Foreign-born:
88.1% (1,504)
Black or African American - Speak only English Native:
80.5% (372)Foreign-born:
3.0% (8)
Black or African American - Speak another language Native:
19.9% (92)Foreign-born:
88.9% (231)
Asian - Speak only English Native:
53.5% (426)Foreign-born:
11.8% (257)
Asian - Speak another language Native:
46.5% (370)Foreign-born:
88.1% (1,911)
Other race - Speak only English Native:
33.3% (594)Foreign-born:
1.7% (24)
Other race - Speak another language Native:
67.4% (1,203)Foreign-born:
98.6% (1,358)
Two or more races - Speak only English Native:
57.7% (1,015)Foreign-born:
11.2% (134)
Two or more races - Speak another language Native:
41.9% (736)Foreign-born:
88.8% (1,061)
White alone - Speak only English Native:
93.8% (9,560)Foreign-born:
13.6% (221)
White alone - Speak another language Native:
5.9% (606)Foreign-born:
86.6% (1,414)
Hispanic or Latino - Speak only English Native:
32.1% (1,084)Foreign-born:
5.6% (136)
Hispanic or Latino - Speak another language Native:
67.8% (2,289)Foreign-born:
94.2% (2,273)
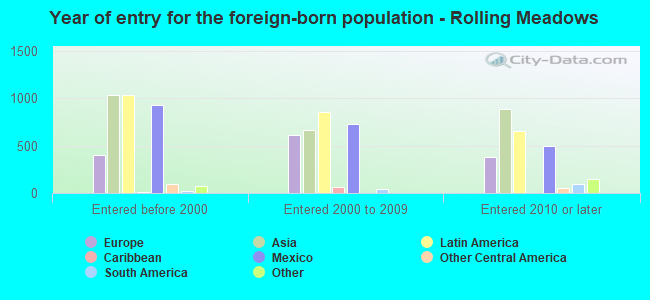
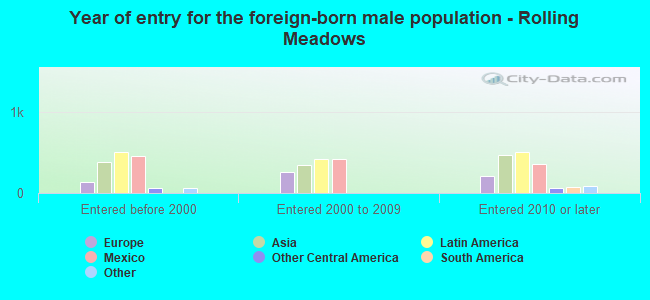
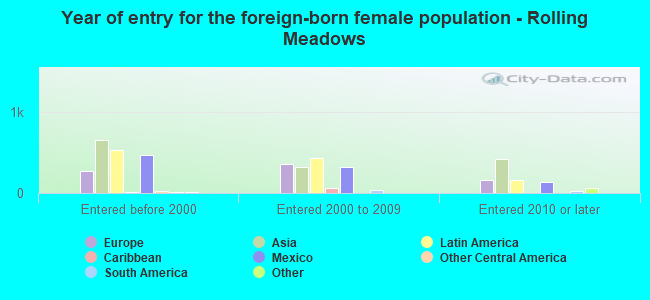
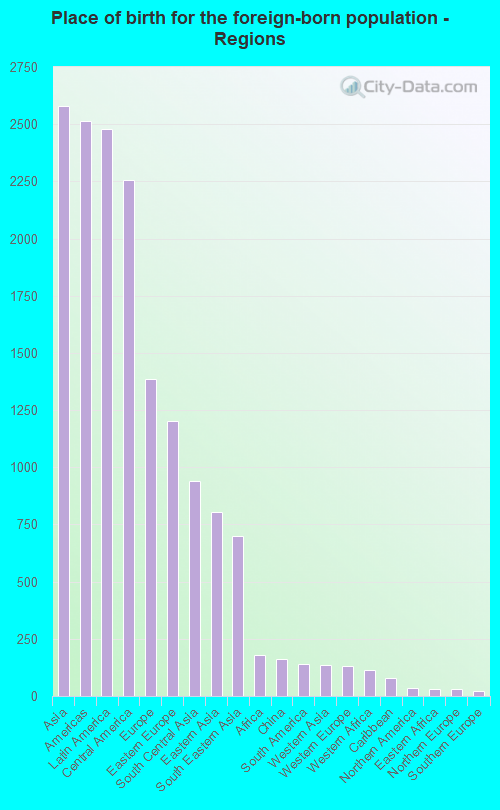
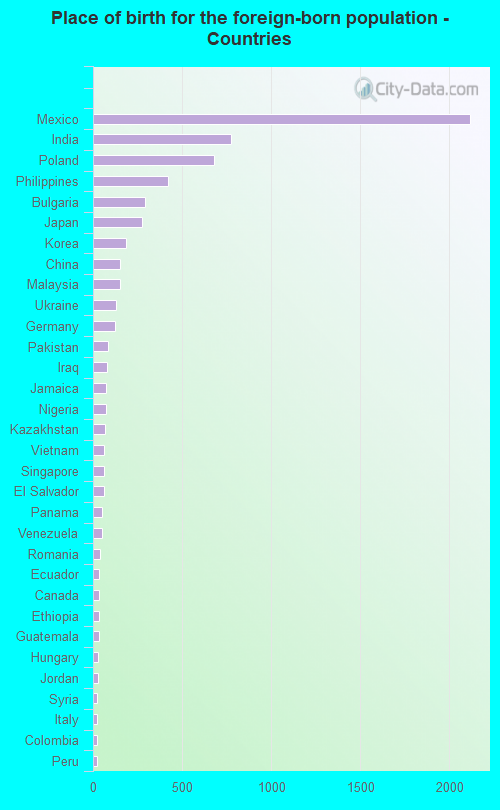
Foreign-born residents in Rolling Meadows 6,661 residents are foreign born (10.8% Asia , 10.4% Latin America , 5.8% Europe ).
This city:
28.3%Illinois:
14.1%
Marital status for residents in Rolling Meadows Marital status - White (Caucasian) population 15 years and over
Males 28.8% Never married56.7% Now married1.5% Separated2.1% Widowed10.8% DivorcedFemales 24.8% Never married48.5% Now married2.2% Separated11.3% Widowed13.1% DivorcedWomen who gave birth in the past 12 months Now married:
96.4% (293)Unmarried:
3.6% (11)
Women who did not give birth in the past 12 months Now married:
46.8% (1,176)Unmarried:
53.2% (1,336)
Marital status - Black or African American population 15 years and over
Males 37.4% Never married61.7% Now married0.0% Separated0.0% Widowed0.9% DivorcedFemales 23.1% Never married63.5% Now married0.0% Separated9.7% Widowed3.7% DivorcedWomen who did not give birth in the past 12 months Now married:
71.3% (131)Unmarried:
28.7% (53)
Marital status - Asian population 15 years and over
Males 38.8% Never married58.6% Now married1.3% Separated1.3% Widowed0.0% DivorcedFemales 13.4% Never married57.3% Now married8.7% Separated5.9% Widowed14.8% DivorcedWomen who did not give birth in the past 12 months Now married:
58.8% (446)Unmarried:
41.2% (313)
Marital status - Other race population 15 years and over
Males 54.3% Never married37.0% Now married5.6% Separated0.4% Widowed2.7% DivorcedFemales 36.1% Never married46.5% Now married2.5% Separated3.5% Widowed11.4% DivorcedWomen who gave birth in the past 12 months Now married:
39.3% (12)Unmarried:
60.7% (19)
Women who did not give birth in the past 12 months Now married:
41.8% (324)Unmarried:
58.2% (452)
Marital status - Two or more races population 15 years and over
Males 43.3% Never married45.5% Now married0.0% Separated0.0% Widowed11.3% DivorcedFemales 40.5% Never married51.6% Now married0.0% Separated4.4% Widowed3.5% DivorcedWomen who gave birth in the past 12 months Now married:
100.0% (32)Unmarried:
0.0% (0)
Women who did not give birth in the past 12 months Now married:
46.8% (348)Unmarried:
53.2% (395)
Marital status - White alone, not Hispanic / Latino population 15 years and over
Males 26.8% Never married57.1% Now married1.4% Separated2.4% Widowed12.2% DivorcedFemales 23.1% Never married47.8% Now married2.3% Separated12.6% Widowed14.3% DivorcedWomen who gave birth in the past 12 months Now married:
93.8% (187)Unmarried:
6.2% (12)
Women who did not give birth in the past 12 months Now married:
50.0% (1,235)Unmarried:
50.0% (1,233)
Marital status - Hispanic or Latino population 15 years and over
Males 47.9% Never married45.9% Now married3.5% Separated0.2% Widowed2.5% DivorcedFemales 36.2% Never married52.0% Now married0.5% Separated4.8% Widowed6.5% DivorcedWomen who gave birth in the past 12 months Now married:
90.9% (169)Unmarried:
9.1% (17)
Women who did not give birth in the past 12 months Now married:
39.5% (571)Unmarried:
60.5% (876)
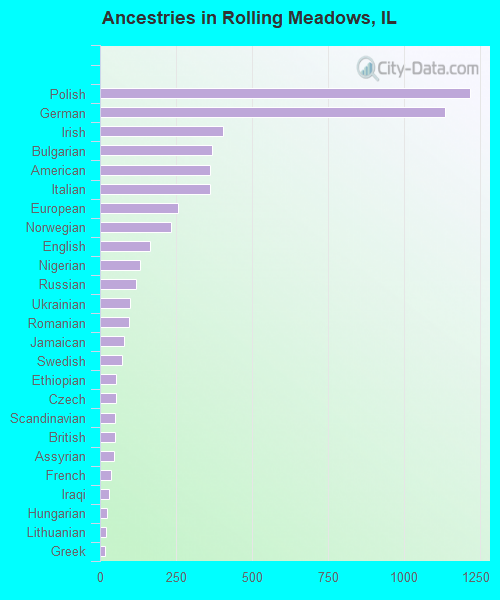
Ancestries in Rolling Meadows
1,219 9.5% Polish1,136 8.8% German406 3.1% Irish367 2.8% Bulgarian361 2.8% American361 2.8% Italian256 2.0% European235 1.8% Norwegian163 1.3% English131 1.0% Nigerian119 0.9% Russian100 0.8% Ukrainian96 0.7% Romanian79 0.6% Jamaican73 0.6% Swedish54 0.4% Ethiopian54 0.4% Czech49 0.4% Scandinavian48 0.4% British46 0.4% Assyrian35 0.3% French30 0.2% Iraqi23 0.2% Hungarian19 0.1% Lithuanian18 0.1% Greek15 0.1% Scottish13 0.1% Arab12 0.09% Macedonian11 0.09% Belgian10 0.08% Swiss9 0.07% Lebanese7 0.05% Welsh6 0.05% Jordanian6 0.05% French Canadian6 0.05% Yugoslavian5 0.04% Czechoslovakian4 0.03% Finnish4 0.03% Slovak3 0.02% Danish
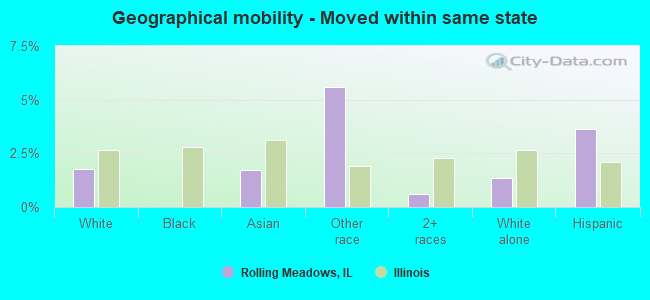
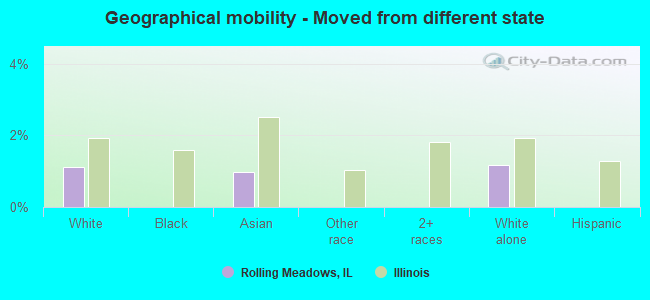
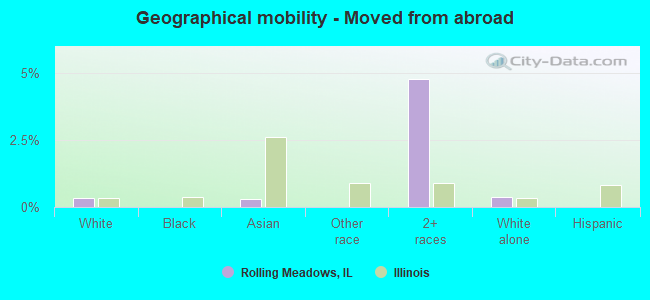
Geographical mobility in Rolling Meadows Same house 1 year ago 11,644 91.7% White (Caucasian)713 98.1% Black or African American2,761 91.0% Asian2,909 89.7% Other race2,944 90.4% Two or more races11,430 91.9% White alone, not Hispanic / Latino5,593 90.9% Hispanic or LatinoMoved within same county 575 4.5% White / Caucasian19 2.6% Black or African American162 5.3% Asian200 6.2% Other race160 4.9% Two or more races599 4.8% White alone, not Hispanic / Latino328 5.3% Hispanic or LatinoMoved within same state 227 1.8% White / Caucasian52 1.7% Asian182 5.6% Other race20 0.6% Two or more races167 1.3% White alone, not Hispanic / Latino224 3.6% Hispanic or LatinoMoved from different state 142 1.1% White / Caucasian29 1.0% Asian146 1.2% White alone, not Hispanic / LatinoMoved from abroad 42 0.3% White9 0.3% Asian155 4.8% Two or more races46 0.4% White alone, not Hispanic / Latino
Children Nativity (place of birth) in Rolling Meadows
Children under 6 years - Living with two parents Both parents native 785 100.0% NativeBoth parents foreign-born 346 89.2% Native42 10.8% Foreign-bornOne native, one foreign-born parent 398 100.0% NativeChildren under 6 years - Living with one parent Native parent 235 100.0% NativeChildren 6 to 17 years - Living with two parents Both parents native 821 100.0% NativeBoth parents foreign-born 950 95.4% Native46 4.6% Foreign-bornOne native, one foreign-born parent 380 100.0% NativeChildren 6 to 17 years - Living with one parent Native parent 338 100.0% NativeForeign-born parent 448 52.9% Native400 47.1% Foreign-born
Grandparents responsible for own grandchildren in Rolling Meadows
Grandparents (30 to 59 years) White / Caucasian 6 5.7% Responsible for grandchildren108 94.3% Not responsible for grandchildrenOther race 30 100.0% Not responsible for grandchildrenWhite alone, not Hispanic / Latino 9 27.8% Responsible for grandchildren22 72.2% Not responsible for grandchildrenHispanic or Latino 153 100.0% Not responsible for grandchildrenGrandparents (60 years and over) White / Caucasian 17 21.1% Responsible for grandchildren65 78.9% Not responsible for grandchildrenOther race 19 57.9% Responsible for grandchildren13 42.1% Not responsible for grandchildrenWhite alone, not Hispanic / Latino 21 20.3% Responsible for grandchildren83 79.7% Not responsible for grandchildrenHispanic or Latino 26 66.6% Responsible for grandchildren13 33.4% Not responsible for grandchildren