Races in Rome, New York (NY) Detailed Stats
Data:
Races - White alone (%)
Races - White alone (% change since 2000)
Races - Black alone (%)
Races - Black alone (% change since 2000)
Races - American Indian alone (%)
Races - American Indian alone (% change since 2000)
Races - Asian alone (%)
Races - Asian alone (% change since 2000)
Races - Hispanic (%)
Races - Hispanic (% change since 2000)
Races - Native Hawaiian and Other Pacific Islander alone (%)
Races - Native Hawaiian and Other Pacific Islander alone (% change since 2000)
Races - Two or more races(%)
Races - Two or more races(% change since 2000)
Races - Other race alone (%)
Races - Other race alone (% change since 2000)
Racial diversity
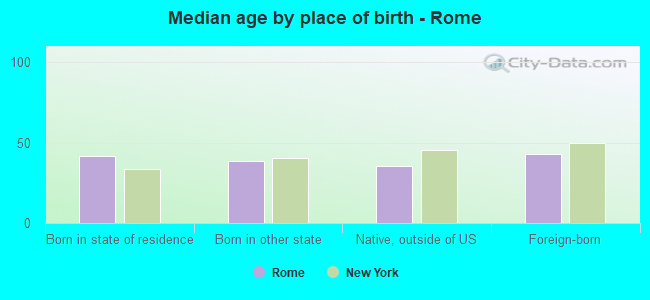
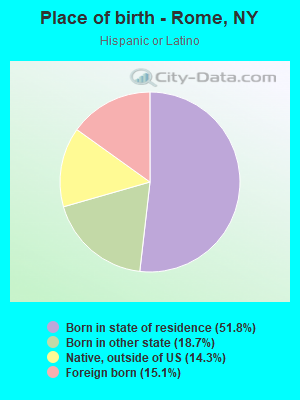
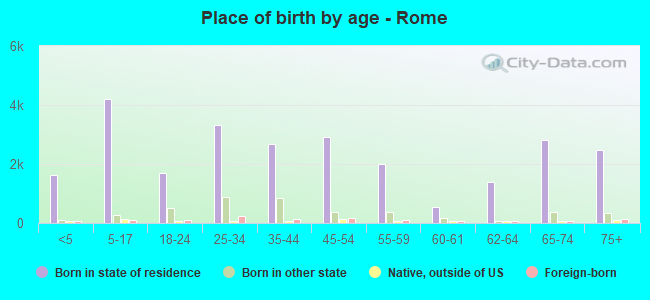
Place of birth - Born in state of residence (%)
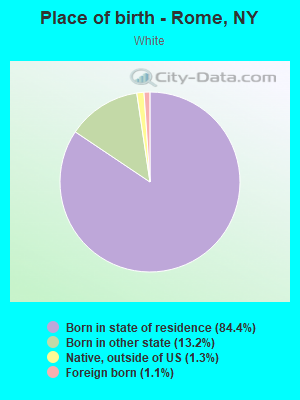
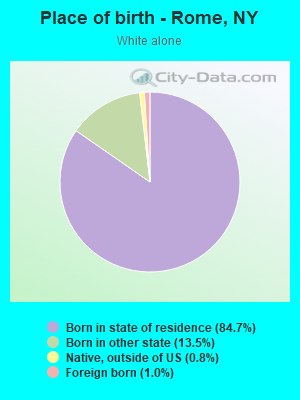
Place of birth - Born in state of residence (%) - White
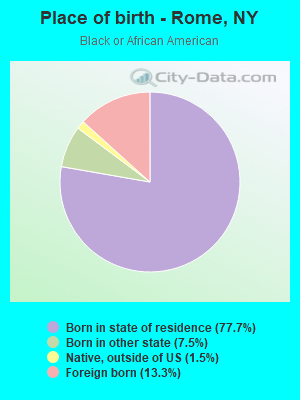
Place of birth - Born in state of residence (%) - Black or African American
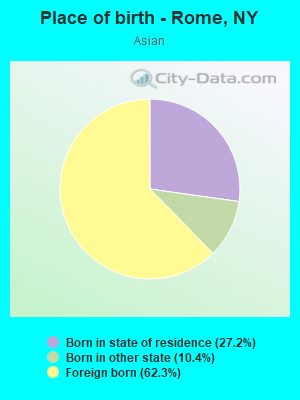
Place of birth - Born in state of residence (%) - Asian
Place of birth - Born in state of residence (%) - Hispanic or Latino
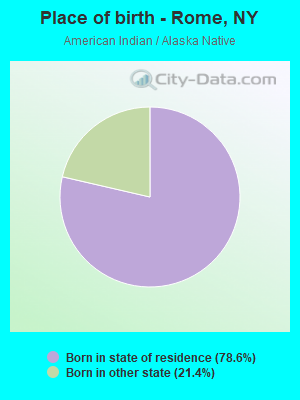
Place of birth - Born in state of residence (%) - American Indian and Alaska Native
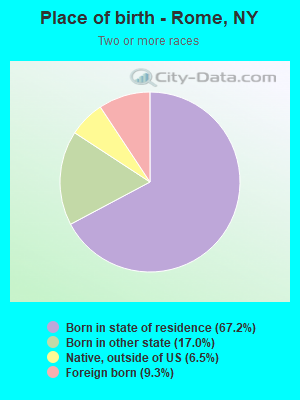
Place of birth - Born in state of residence (%) - Multirace
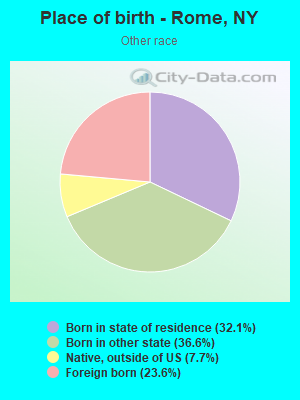
Place of birth - Born in state of residence (%) - Other Race
Place of birth - Born in other state (%)
Place of birth - Born in other state (%) - White
Place of birth - Born in other state (%) - Black or African American
Place of birth - Born in other state (%) - Asian
Place of birth - Born in other state (%) - Hispanic or Latino
Place of birth - Born in other state (%) - American Indian and Alaska Native
Place of birth - Born in other state (%) - Multirace
Place of birth - Born in other state (%) - Other Race
Place of birth - Native, outside of US (%)
Place of birth - Native, outside of US (%) - White
Place of birth - Native, outside of US (%) - Black or African American
Place of birth - Native, outside of US (%) - Asian
Place of birth - Native, outside of US (%) - Hispanic or Latino
Place of birth - Native, outside of US (%) - American Indian and Alaska Native
Place of birth - Native, outside of US (%) - Multirace
Place of birth - Native, outside of US (%) - Other Race
Place of birth - Foreign born (%)
Place of birth - Foreign born (%) - White
Place of birth - Foreign born (%) - Black or African American
Place of birth - Foreign born (%) - Asian
Place of birth - Foreign born (%) - Hispanic or Latino
Place of birth - Foreign born (%) - American Indian and Alaska Native
Place of birth - Foreign born (%) - Multirace
Place of birth - Foreign born (%) - Other Race
Residents speaking English at home (%)
Residents speaking English at home - Born in the United States (%)
Residents speaking English at home - Native, born elsewhere (%)
Residents speaking English at home - Foreign born (%)
Residents speaking Spanish at home (%)
Residents speaking Spanish at home - Born in the United States (%)
Residents speaking Spanish at home - Native, born elsewhere (%)
Residents speaking Spanish at home - Foreign born (%)
Residents speaking other language at home (%)
Residents speaking other language at home - Born in the United States (%)
Residents speaking other language at home - Native, born elsewhere (%)
Residents speaking other language at home - Foreign born (%)
Marital status - Never married (%)
Marital status - Now married (%)
Marital status - Separated (%)
Marital status - Widowed (%)
Marital status - Divorced (%)
Ancestries Reported - Arab (%)
Ancestries Reported - Czech (%)
Ancestries Reported - Danish (%)
Ancestries Reported - Dutch (%)
Ancestries Reported - English (%)
Ancestries Reported - French (%)
Ancestries Reported - French Canadian (%)
Ancestries Reported - German (%)
Ancestries Reported - Greek (%)
Ancestries Reported - Hungarian (%)
Ancestries Reported - Irish (%)
Ancestries Reported - Italian (%)
Ancestries Reported - Lithuanian (%)
Ancestries Reported - Norwegian (%)
Ancestries Reported - Polish (%)
Ancestries Reported - Portuguese (%)
Ancestries Reported - Russian (%)
Ancestries Reported - Scotch-Irish (%)
Ancestries Reported - Scottish (%)
Ancestries Reported - Slovak (%)
Ancestries Reported - Subsaharan African (%)
Ancestries Reported - Swedish (%)
Ancestries Reported - Swiss (%)
Ancestries Reported - Ukrainian (%)
Ancestries Reported - United States (%)
Ancestries Reported - Welsh (%)
Ancestries Reported - West Indian (%)
Ancestries Reported - Other (%)
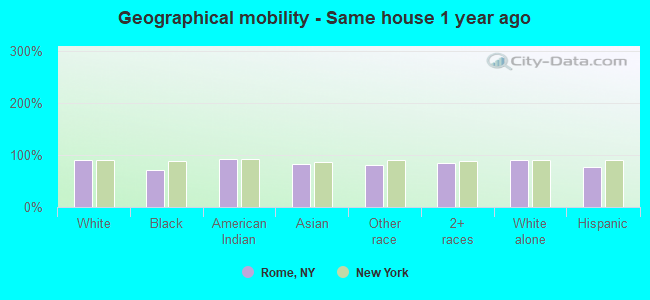
Geographical mobility - Same house 1 year ago (%)
Geographical mobility - Same house 1 year ago (%) - White
Geographical mobility - Same house 1 year ago (%) - Black or African American
Geographical mobility - Same house 1 year ago (%) - Asian
Geographical mobility - Same house 1 year ago (%) - Hispanic or Latino
Geographical mobility - Same house 1 year ago (%) - American Indian and Alaska Native
Geographical mobility - Same house 1 year ago (%) - Multirace
Geographical mobility - Same house 1 year ago (%) - Other Race
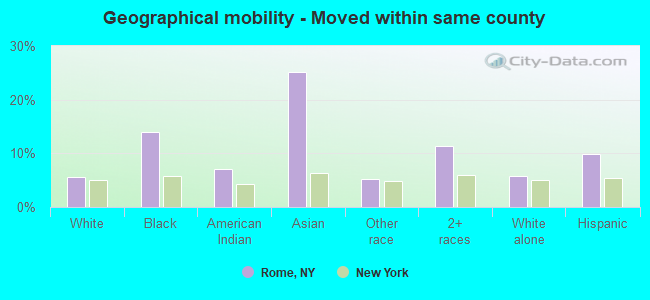
Geographical mobility - Moved within same county (%)
Geographical mobility - Moved within same county (%) - White
Geographical mobility - Moved within same county (%) - Black or African American
Geographical mobility - Moved within same county (%) - Asian
Geographical mobility - Moved within same county (%) - Hispanic or Latino
Geographical mobility - Moved within same county (%) - American Indian and Alaska Native
Geographical mobility - Moved within same county (%) - Multirace
Geographical mobility - Moved within same county (%) - Other Race
Geographical mobility - Moved from different county within same state (%)
Geographical mobility - Moved from different county within same state (%) - White
Geographical mobility - Moved from different county within same state (%) - Black or African American
Geographical mobility - Moved from different county within same state (%) - Asian
Geographical mobility - Moved from different county within same state (%) - Hispanic or Latino
Geographical mobility - Moved from different county within same state (%) - American Indian and Alaska Native
Geographical mobility - Moved from different county within same state (%) - Multirace
Geographical mobility - Moved from different county within same state (%) - Other Race
Geographical mobility - Moved from different state (%)
Geographical mobility - Moved from different state (%) - White
Geographical mobility - Moved from different state (%) - Black or African American
Geographical mobility - Moved from different state (%) - Asian
Geographical mobility - Moved from different state (%) - Hispanic or Latino
Geographical mobility - Moved from different state (%) - American Indian and Alaska Native
Geographical mobility - Moved from different state (%) - Multirace
Geographical mobility - Moved from different state (%) - Other Race
Geographical mobility - Moved from abroad (%)
Geographical mobility - Moved from abroad (%) - White
Geographical mobility - Moved from abroad (%) - Black or African American
Geographical mobility - Moved from abroad (%) - Asian
Geographical mobility - Moved from abroad (%) - Hispanic or Latino
Geographical mobility - Moved from abroad (%) - American Indian and Alaska Native
Geographical mobility - Moved from abroad (%) - Multirace
Geographical mobility - Moved from abroad (%) - Other Race
Place of birth for the foreign-born population - Ireland (%)
Place of birth for the foreign-born population - Denmark (%)
Place of birth for the foreign-born population - Norway (%)
Place of birth for the foreign-born population - Sweden (%)
Place of birth for the foreign-born population - United Kingdom (%)
Place of birth for the foreign-born population - England (%)
Place of birth for the foreign-born population - Scotland (%)
Place of birth for the foreign-born population - Other Northern Europe (%)
Place of birth for the foreign-born population - Austria (%)
Place of birth for the foreign-born population - Belgium (%)
Place of birth for the foreign-born population - France (%)
Place of birth for the foreign-born population - Germany (%)
Place of birth for the foreign-born population - Netherlands (%)
Place of birth for the foreign-born population - Switzerland (%)
Place of birth for the foreign-born population - Other Western Europe (%)
Place of birth for the foreign-born population - Greece (%)
Place of birth for the foreign-born population - Italy (%)
Place of birth for the foreign-born population - Portugal (%)
Place of birth for the foreign-born population - Spain (%)
Place of birth for the foreign-born population - Other Southern Europe (%)
Place of birth for the foreign-born population - Albania (%)
Place of birth for the foreign-born population - Belarus (%)
Place of birth for the foreign-born population - Bosnia and Herzegovina (%)
Place of birth for the foreign-born population - Bulgaria (%)
Place of birth for the foreign-born population - Croatia (%)
Place of birth for the foreign-born population - Czechoslovakia (%)
Place of birth for the foreign-born population - Hungary (%)
Place of birth for the foreign-born population - Latvia (%)
Place of birth for the foreign-born population - Lithuania (%)
Place of birth for the foreign-born population - North Macedonia (Macedonia) (%)
Place of birth for the foreign-born population - Moldova (%)
Place of birth for the foreign-born population - Poland (%)
Place of birth for the foreign-born population - Romania (%)
Place of birth for the foreign-born population - Russia (%)
Place of birth for the foreign-born population - Serbia (%)
Place of birth for the foreign-born population - Ukraine (%)
Place of birth for the foreign-born population - Other Eastern Europe (%)
Place of birth for the foreign-born population - China (%)
Place of birth for the foreign-born population - Hong Kong (%)
Place of birth for the foreign-born population - Taiwan (%)
Place of birth for the foreign-born population - Japan (%)
Place of birth for the foreign-born population - Korea (%)
Place of birth for the foreign-born population - Other Eastern Asia (%)
Place of birth for the foreign-born population - Afghanistan (%)
Place of birth for the foreign-born population - Bangladesh (%)
Place of birth for the foreign-born population - India (%)
Place of birth for the foreign-born population - Iran (%)
Place of birth for the foreign-born population - Kazakhstan (%)
Place of birth for the foreign-born population - Nepal (%)
Place of birth for the foreign-born population - Pakistan (%)
Place of birth for the foreign-born population - Sri Lanka (%)
Place of birth for the foreign-born population - Uzbekistan (%)
Place of birth for the foreign-born population - Other South Central Asia (%)
Place of birth for the foreign-born population - Burma (%)
Place of birth for the foreign-born population - Cambodia (%)
Place of birth for the foreign-born population - Indonesia (%)
Place of birth for the foreign-born population - Laos (%)
Place of birth for the foreign-born population - Malaysia (%)
Place of birth for the foreign-born population - Philippines (%)
Place of birth for the foreign-born population - Singapore (%)
Place of birth for the foreign-born population - Thailand (%)
Place of birth for the foreign-born population - Vietnam (%)
Place of birth for the foreign-born population - Other South Eastern Asia (%)
Place of birth for the foreign-born population - Armenia (%)
Place of birth for the foreign-born population - Iraq (%)
Place of birth for the foreign-born population - Israel (%)
Place of birth for the foreign-born population - Jordan (%)
Place of birth for the foreign-born population - Kuwait (%)
Place of birth for the foreign-born population - Lebanon (%)
Place of birth for the foreign-born population - Saudi Arabia (%)
Place of birth for the foreign-born population - Syria (%)
Place of birth for the foreign-born population - Turkey (%)
Place of birth for the foreign-born population - Yemen (%)
Place of birth for the foreign-born population - Other Western Asia (%)
Place of birth for the foreign-born population - Eritrea (%)
Place of birth for the foreign-born population - Ethiopia (%)
Place of birth for the foreign-born population - Kenya (%)
Place of birth for the foreign-born population - Somalia (%)
Place of birth for the foreign-born population - Uganda (%)
Place of birth for the foreign-born population - Zimbabwe (%)
Place of birth for the foreign-born population - Other Eastern Africa (%)
Place of birth for the foreign-born population - Cameroon (%)
Place of birth for the foreign-born population - Congo (%)
Place of birth for the foreign-born population - Democratic Republic of Congo (Zaire) (%)
Place of birth for the foreign-born population - Other Middle Africa (%)
Place of birth for the foreign-born population - Egypt (%)
Place of birth for the foreign-born population - Morocco (%)
Place of birth for the foreign-born population - Sudan (%)
Place of birth for the foreign-born population - Other Northern Africa (%)
Place of birth for the foreign-born population - South Africa (%)
Place of birth for the foreign-born population - Other Southern Africa (%)
Place of birth for the foreign-born population - Cabo Verde (%)
Place of birth for the foreign-born population - Ghana (%)
Place of birth for the foreign-born population - Liberia (%)
Place of birth for the foreign-born population - Nigeria (%)
Place of birth for the foreign-born population - Senegal (%)
Place of birth for the foreign-born population - Sierra Leone (%)
Place of birth for the foreign-born population - Other Western Africa (%)
Place of birth for the foreign-born population - Australia (%)
Place of birth for the foreign-born population - New Zealand (%)
Place of birth for the foreign-born population - Fiji (%)
Place of birth for the foreign-born population - Micronesia (%)
Place of birth for the foreign-born population - Bahamas (%)
Place of birth for the foreign-born population - Barbados (%)
Place of birth for the foreign-born population - Cuba (%)
Place of birth for the foreign-born population - Dominica (%)
Place of birth for the foreign-born population - Dominican Republic (%)
Place of birth for the foreign-born population - Grenada (%)
Place of birth for the foreign-born population - Haiti (%)
Place of birth for the foreign-born population - Jamaica (%)
Place of birth for the foreign-born population - St. Vincent and the Grenadines (%)
Place of birth for the foreign-born population - Trinidad and Tobago (%)
Place of birth for the foreign-born population - West Indies (%)
Place of birth for the foreign-born population - Other Caribbean (%)
Place of birth for the foreign-born population - Belize (%)
Place of birth for the foreign-born population - Costa Rica (%)
Place of birth for the foreign-born population - El Salvador (%)
Place of birth for the foreign-born population - Guatemala (%)
Place of birth for the foreign-born population - Honduras (%)
Place of birth for the foreign-born population - Mexico (%)
Place of birth for the foreign-born population - Nicaragua (%)
Place of birth for the foreign-born population - Panama (%)
Place of birth for the foreign-born population - Other Central America (%)
Place of birth for the foreign-born population - Argentina (%)
Place of birth for the foreign-born population - Bolivia (%)
Place of birth for the foreign-born population - Brazil (%)
Place of birth for the foreign-born population - Chile (%)
Place of birth for the foreign-born population - Colombia (%)
Place of birth for the foreign-born population - Ecuador (%)
Place of birth for the foreign-born population - Guyana (%)
Place of birth for the foreign-born population - Peru (%)
Place of birth for the foreign-born population - Uruguay (%)
Place of birth for the foreign-born population - Venezuela (%)
Place of birth for the foreign-born population - Other South America (%)
Place of birth for the foreign-born population - Canada (%)
Place of birth for the foreign-born population - Other Northern America (%)
Place of birth for the foreign-born population - Other (%)
Latest news about races in Rome, NY collected exclusively by city-data.com from local newspapers, TV, and radio stations
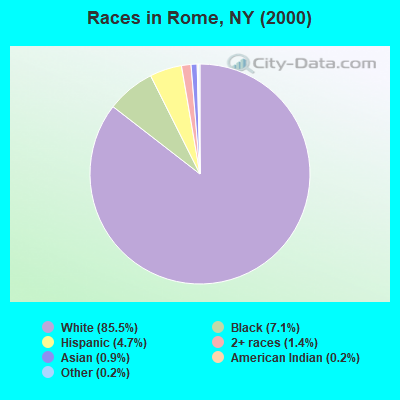
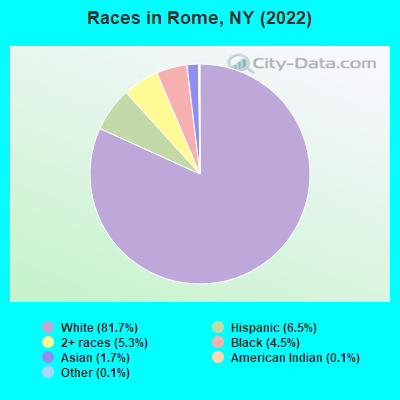
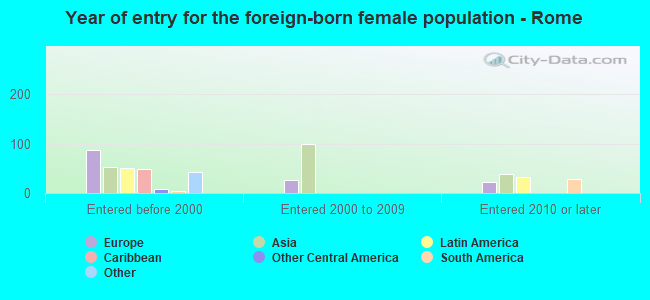
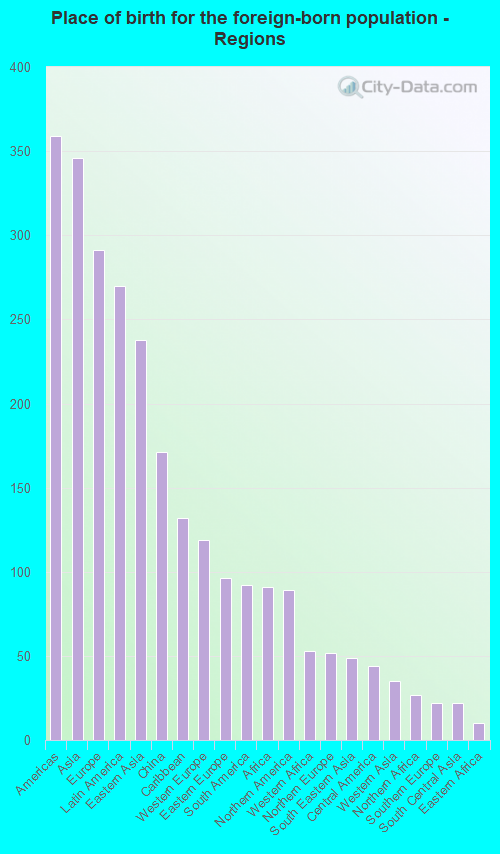
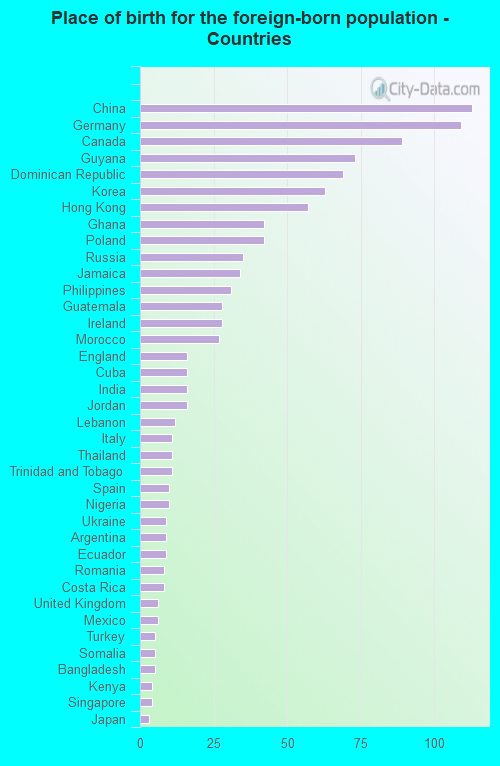
According to 2022 data, the most numerous races in Rome, NY are White alone (25,914 residents), Hispanic (2,053 residents), and Black alone (1,436 residents). 92.2% of Rome residents speak English at home. 3.4% of Rome, NY residents are foreign-born (1.1% born in Asia, 0.9% born in Europe, 0.9% born in Latin America), which is 540.9% less than the foreign-born rate of 22.0% across the entire state of New York.
Race distribution in Rome
2000 2022
11,760,981 62.0% White alone 2,867,583 15.1% Hispanic 2,812,623 14.8% Black alone 1,035,926 5.5% Asian alone 366,116 1.9% Two or more races 75,499 0.4% Other race alone 52,499 0.3% American Indian alone 5,230 0.03% Native Hawaiian and Other
10,408,933 52.9% White alone 3,867,299 19.7% Hispanic 2,633,840 13.4% Black alone 1,776,286 9.0% Asian alone 732,670 3.7% Two or more races 216,110 1.1% Other race alone 35,082 0.2% American Indian alone 6,931 0.04% Native Hawaiian and Other
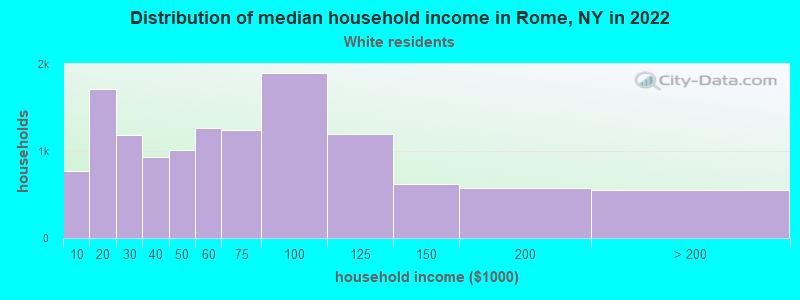
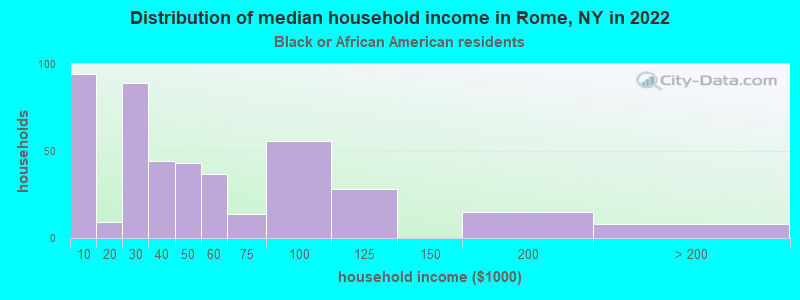
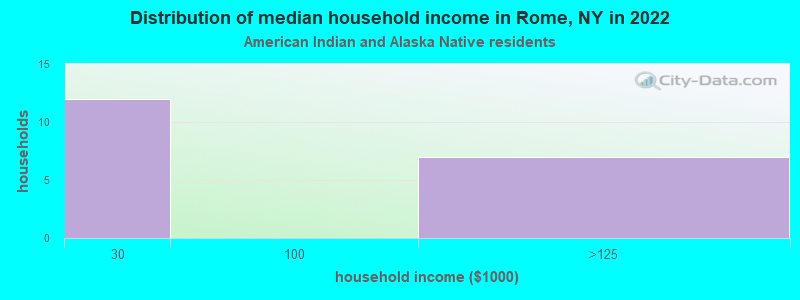
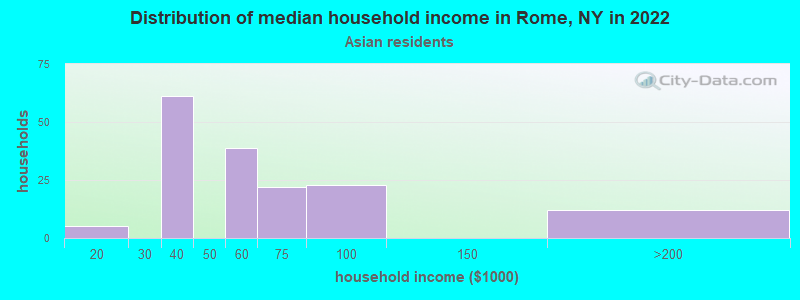
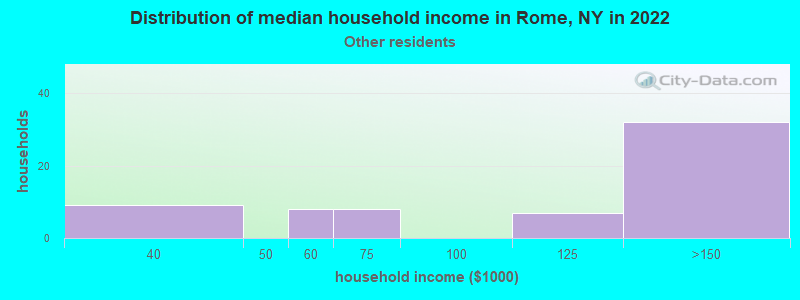
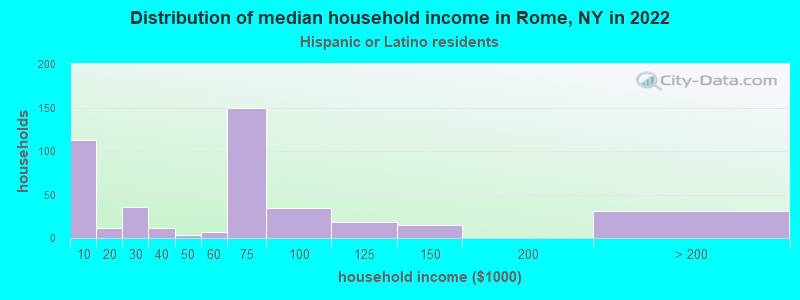
Income and house value in Rome Median household income in 2022 $56,239 White non-Hispanic householders$43,539 Black householders$58,845 Asian householders$97,132 Some other race householders$40,463 Two or more races householders$65,693 Hispanic or Latino race householdersMedian 2022 house value $136,759 White Non-Hispanic householders$110,475 Black or African American householders$86,039 American Indian or Alaska Native householders $195,076 Asian householders$77,825 Some other race householders$120,742 Two or more races householders$114,171 Hispanic or Latino householders
Median age by race in Rome
44.0 Median age for White residents43.5 44.8 36.0 Median age for Black or African American residents34.3 39.6 54.0 Median age for American Indian / Alaska Native residents42.1 -642,115,202.4 29.6 Median age for Asian residents26.5 29.7 -487,992,314.6 Median age for Native Hawaiian / Pacific Islander residents-477,502,295.2 -497,387,669.3 23.9 Median age for Other race residents26.2 26.0 30.7 Median age for Two or more races residents24.0 50.7 44.7 Median age for White alone residents44.6 44.6 28.8 Median age for Hispanic or Latino residents25.5 53.1
Owner/renter occupied households by race in Rome
House owners and renters - White residents 7,402 57.0% Owner occupied5,577 43.0% Renter occupiedHouse owners and renters - Black or African American residents 144 37.7% Owner occupied237 62.3% Renter occupiedHouse owners and renters - American Indian / Alaska Native residents 7 100.0% Owner occupiedHouse owners and renters - Asian residents 108 61.4% Owner occupied68 38.6% Renter occupiedHouse owners and renters - Other race residents 29 36.7% Owner occupied51 63.3% Renter occupiedHouse owners and renters - Two or more races residents 369 35.0% Owner occupied686 65.0% Renter occupiedHouse owners and renters - White alone residents 7,289 56.9% Owner occupied5,519 43.1% Renter occupiedHouse owners and renters - Hispanic or Latino residents 246 43.2% Owner occupied323 56.8% Renter occupied
Language usage in Rome
English speakers - Total 92.2% of residents of Rome speak English at home.
4.2% of residents speak Spanish at home 939 74.0% Speak English very well330 26.0% Speak English less than very well3.1% of residents speak other language at home 528 57.3% Speak English very well393 42.7% Speak English less than very well
English speakers - Born in the United States 94.2% of residents of Rome speak English at home.
3.4% of residents speak Spanish at home 118 81.4% Speak English very well27 18.6% Speak English less than very well1.8% of residents speak other language at home 55 73.3% Speak English very well20 26.7% Speak English less than very well
English speakers - Native, born elsewhere 53.7% of residents of Rome speak English at home.
27.6% of residents speak Spanish at home 46 28.4% Speak English very well116 71.6% Speak English less than very well11.1% of residents speak other language at home 65 100.0% Speak English very well
English speakers - Foreign-born 38.4% of residents of Rome speak English at home.
27.0% of residents speak Spanish at home 167 57.4% Speak English very well124 42.6% Speak English less than very well41.9% of residents speak other language at home 225 49.9% Speak English very well226 50.1% Speak English less than very well
White (Caucasian) - Speak only English Native:
97.4% (24,565)Foreign-born:
32.9% (94)
White (Caucasian) - Speak another language Native:
2.6% (665)Foreign-born:
63.4% (181)
Black or African American - Speak only English Native:
68.3% (839)Foreign-born:
30.1% (57)
Black or African American - Speak another language Native:
4.7% (58)Foreign-born:
70.4% (133)
Asian - Speak only English Native:
86.8% (126)Foreign-born:
69.1% (227)
Asian - Speak another language Native:
17.0% (25)Foreign-born:
59.2% (194)
Other race - Speak another language Native:
52.1% (302)Foreign-born:
93.8% (121)
Two or more races - Speak only English Native:
86.3% (1,419)Foreign-born:
23.8% (47)
Two or more races - Speak another language Native:
12.6% (207)Foreign-born:
56.9% (113)
White alone - Speak only English Native:
98.3% (24,252)Foreign-born:
38.2% (100)
White alone - Speak another language Native:
1.5% (370)Foreign-born:
61.5% (161)
Hispanic or Latino - Speak only English Native:
48.8% (688)Foreign-born:
4.8% (13)
Hispanic or Latino - Speak another language Native:
52.0% (733)Foreign-born:
96.6% (269)
Foreign-born residents in Rome 1,089 residents are foreign born (1.1% Asia , 0.9% Europe , 0.9% Latin America ).
This city:
3.4%New York:
22.6%
Marital status for residents in Rome Marital status - White (Caucasian) population 15 years and over
Males 35.2% Never married45.0% Now married1.5% Separated6.0% Widowed12.4% DivorcedFemales 29.8% Never married39.8% Now married4.2% Separated12.0% Widowed14.2% DivorcedWomen who gave birth in the past 12 months Now married:
69.3% (396)Unmarried:
30.7% (176)
Women who did not give birth in the past 12 months Now married:
40.2% (1,983)Unmarried:
59.8% (2,949)
Marital status - Black or African American population 15 years and over
Males 63.6% Never married26.9% Now married3.0% Separated4.1% Widowed2.4% DivorcedFemales 31.7% Never married27.4% Now married25.9% Separated0.8% Widowed14.3% DivorcedWomen who gave birth in the past 12 months Now married:
100.0% (61)Unmarried:
0.0% (0)
Women who did not give birth in the past 12 months Now married:
0.0% (0)Unmarried:
100.0% (43)
Marital status - American Indian / Alaska Native population 15 years and over
Males 73.3% Never married23.3% Now married0.0% Separated0.0% Widowed3.3% DivorcedFemales 0.0% Never married100.0% Now married0.0% Separated0.0% Widowed0.0% DivorcedWomen who did not give birth in the past 12 months Now married:
100.0% (6)Unmarried:
0.0% (0)
Marital status - Asian population 15 years and over
Males 37.8% Never married40.4% Now married0.0% Separated0.0% Widowed21.8% DivorcedFemales 45.4% Never married38.6% Now married0.0% Separated3.4% Widowed12.6% DivorcedWomen who did not give birth in the past 12 months Now married:
35.4% (44)Unmarried:
64.6% (80)
Marital status - Other race population 15 years and over
Males 41.5% Never married18.6% Now married2.1% Separated10.6% Widowed27.1% DivorcedFemales 92.4% Never married6.6% Now married0.0% Separated0.0% Widowed1.0% DivorcedWomen who did not give birth in the past 12 months Now married:
2.4% (8)Unmarried:
97.6% (308)
Marital status - Two or more races population 15 years and over
Males 59.6% Never married27.6% Now married1.4% Separated4.3% Widowed7.1% DivorcedFemales 60.7% Never married15.1% Now married2.3% Separated12.9% Widowed8.9% DivorcedWomen who did not give birth in the past 12 months Now married:
10.0% (50)Unmarried:
90.0% (453)
Marital status - White alone, not Hispanic / Latino population 15 years and over
Males 33.5% Never married46.1% Now married1.5% Separated6.3% Widowed12.6% DivorcedFemales 29.1% Never married40.2% Now married4.3% Separated12.2% Widowed14.1% DivorcedWomen who gave birth in the past 12 months Now married:
70.0% (403)Unmarried:
30.0% (172)
Women who did not give birth in the past 12 months Now married:
41.1% (1,986)Unmarried:
58.9% (2,849)
Marital status - Hispanic or Latino population 15 years and over
Males 65.2% Never married21.2% Now married1.5% Separated3.0% Widowed9.1% DivorcedFemales 69.4% Never married18.4% Now married0.9% Separated1.2% Widowed10.1% DivorcedWomen who gave birth in the past 12 months Now married:
0.0% (0)Unmarried:
100.0% (7)
Women who did not give birth in the past 12 months Now married:
10.0% (56)Unmarried:
90.0% (502)
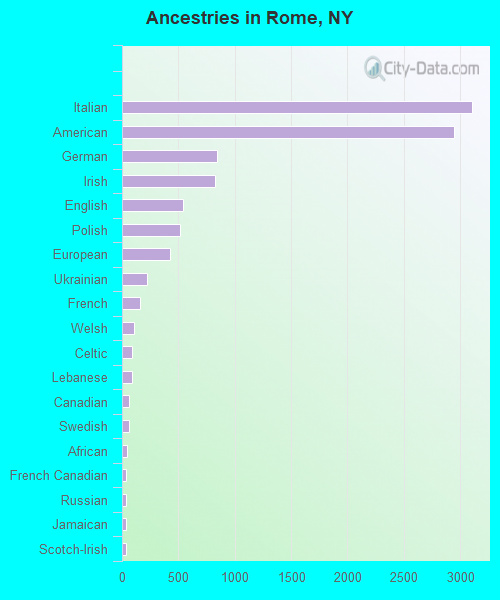
Ancestries in Rome
3,100 23.5% Italian2,943 22.3% American847 6.4% German828 6.3% Irish542 4.1% English515 3.9% Polish426 3.2% European223 1.7% Ukrainian157 1.2% French106 0.8% Welsh93 0.7% Celtic89 0.7% Lebanese60 0.5% Canadian59 0.4% Swedish40 0.3% African39 0.3% French Canadian38 0.3% Russian36 0.3% Jamaican33 0.3% Scotch-Irish28 0.2% Moroccan24 0.2% Greek23 0.2% Scottish19 0.1% Slavic19 0.1% Hungarian17 0.1% Dutch16 0.1% British14 0.1% Danish12 0.09% Trinidadian and Tobagonian11 0.08% Nigerian10 0.08% Slovene8 0.06% Finnish7 0.05% Czech7 0.05% Eastern European6 0.05% Turkish4 0.03% Portuguese3 0.02% Ghanaian3 0.02% Somali3 0.02% Swiss2 0.02% Serbian
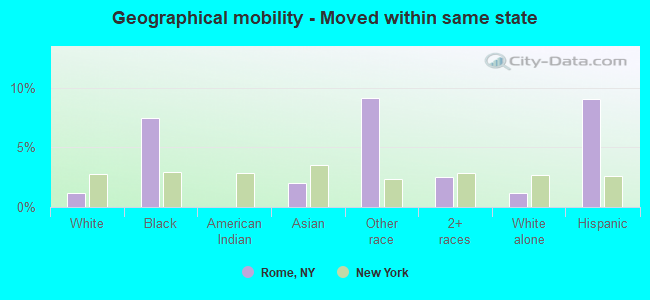
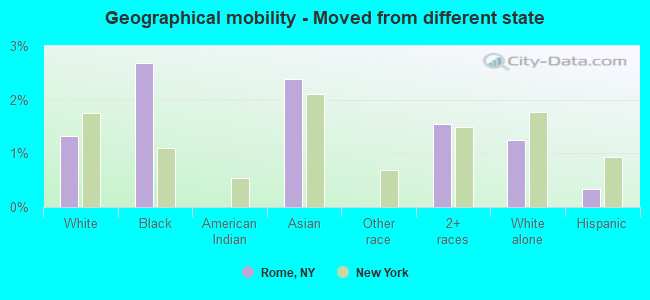
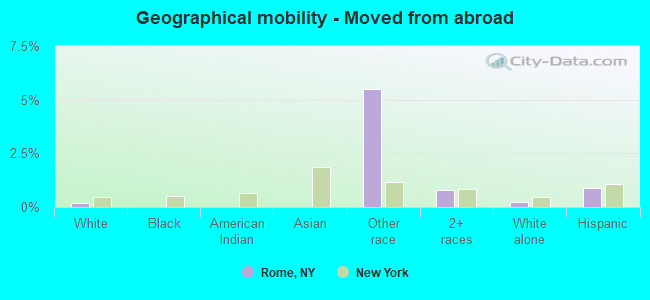
Geographical mobility in Rome Same house 1 year ago 23,958 91.2% White (Caucasian)1,072 72.0% Black or African American47 92.5% American Indian / Alaska Native429 82.1% Asian546 81.0% Other race1,790 85.4% Two or more races23,220 90.8% White alone, not Hispanic / Latino1,599 78.0% Hispanic or LatinoMoved within same county 1,444 5.5% White / Caucasian207 13.9% Black or African American4 7.0% American Indian / Alaska Native131 25.1% Asian35 5.2% Other race238 11.3% Two or more races1,499 5.9% White alone, not Hispanic / Latino202 9.9% Hispanic or LatinoMoved within same state 310 1.2% White / Caucasian111 7.5% Black or African American10 2.0% Asian62 9.2% Other race52 2.5% Two or more races305 1.2% White alone, not Hispanic / Latino186 9.1% Hispanic or LatinoMoved from different state 346 1.3% White / Caucasian40 2.7% Black or African American12 2.4% Asian32 1.5% Two or more races320 1.3% White alone, not Hispanic / Latino7 0.3% Hispanic or LatinoMoved from abroad 54 0.2% White37 5.5% Other race17 0.8% Two or more races60 0.2% White alone, not Hispanic / Latino18 0.9% Hispanic or Latino
Children Nativity (place of birth) in Rome
Children under 6 years - Living with two parents Both parents native 1,015 100.0% NativeBoth parents foreign-born 11 100.0% NativeOne native, one foreign-born parent 86 100.0% NativeChildren under 6 years - Living with one parent Native parent 880 100.0% Native
Children 6 to 17 years - Living with two parents Both parents native 1,847 96.1% Native75 3.9% Foreign-bornBoth parents foreign-born 8 100.0% Foreign-bornOne native, one foreign-born parent 38 100.0% NativeChildren 6 to 17 years - Living with one parent Native parent 2,054 100.0% Native
Grandparents responsible for own grandchildren in Rome
Grandparents (30 to 59 years) White / Caucasian 115 54.1% Responsible for grandchildren98 45.9% Not responsible for grandchildrenAsian 6 100.0% Not responsible for grandchildrenTwo or more races 17 49.8% Responsible for grandchildren17 50.2% Not responsible for grandchildrenWhite alone, not Hispanic / Latino 133 56.2% Responsible for grandchildren104 43.8% Not responsible for grandchildrenHispanic or Latino 6 100.0% Not responsible for grandchildrenGrandparents (60 years and over) White / Caucasian 40 14.0% Responsible for grandchildren249 86.0% Not responsible for grandchildrenTwo or more races 24 88.7% Responsible for grandchildren3 11.3% Not responsible for grandchildrenWhite alone, not Hispanic / Latino 40 13.3% Responsible for grandchildren264 86.7% Not responsible for grandchildrenHispanic or Latino 2 100.0% Not responsible for grandchildren