Races in Romeoville, Illinois (IL) Detailed Stats
Data:
Races - White alone (%)
Races - White alone (% change since 2000)
Races - Black alone (%)
Races - Black alone (% change since 2000)
Races - American Indian alone (%)
Races - American Indian alone (% change since 2000)
Races - Asian alone (%)
Races - Asian alone (% change since 2000)
Races - Hispanic (%)
Races - Hispanic (% change since 2000)
Races - Native Hawaiian and Other Pacific Islander alone (%)
Races - Native Hawaiian and Other Pacific Islander alone (% change since 2000)
Races - Two or more races(%)
Races - Two or more races(% change since 2000)
Races - Other race alone (%)
Races - Other race alone (% change since 2000)
Racial diversity
Place of birth - Born in state of residence (%)
Place of birth - Born in state of residence (%) - White
Place of birth - Born in state of residence (%) - Black or African American
Place of birth - Born in state of residence (%) - Asian
Place of birth - Born in state of residence (%) - Hispanic or Latino
Place of birth - Born in state of residence (%) - American Indian and Alaska Native
Place of birth - Born in state of residence (%) - Multirace
Place of birth - Born in state of residence (%) - Other Race
Place of birth - Born in other state (%)
Place of birth - Born in other state (%) - White
Place of birth - Born in other state (%) - Black or African American
Place of birth - Born in other state (%) - Asian
Place of birth - Born in other state (%) - Hispanic or Latino
Place of birth - Born in other state (%) - American Indian and Alaska Native
Place of birth - Born in other state (%) - Multirace
Place of birth - Born in other state (%) - Other Race
Place of birth - Native, outside of US (%)
Place of birth - Native, outside of US (%) - White
Place of birth - Native, outside of US (%) - Black or African American
Place of birth - Native, outside of US (%) - Asian
Place of birth - Native, outside of US (%) - Hispanic or Latino
Place of birth - Native, outside of US (%) - American Indian and Alaska Native
Place of birth - Native, outside of US (%) - Multirace
Place of birth - Native, outside of US (%) - Other Race
Place of birth - Foreign born (%)
Place of birth - Foreign born (%) - White
Place of birth - Foreign born (%) - Black or African American
Place of birth - Foreign born (%) - Asian
Place of birth - Foreign born (%) - Hispanic or Latino
Place of birth - Foreign born (%) - American Indian and Alaska Native
Place of birth - Foreign born (%) - Multirace
Place of birth - Foreign born (%) - Other Race
Residents speaking English at home (%)
Residents speaking English at home - Born in the United States (%)
Residents speaking English at home - Native, born elsewhere (%)
Residents speaking English at home - Foreign born (%)
Residents speaking Spanish at home (%)
Residents speaking Spanish at home - Born in the United States (%)
Residents speaking Spanish at home - Native, born elsewhere (%)
Residents speaking Spanish at home - Foreign born (%)
Residents speaking other language at home (%)
Residents speaking other language at home - Born in the United States (%)
Residents speaking other language at home - Native, born elsewhere (%)
Residents speaking other language at home - Foreign born (%)
Marital status - Never married (%)
Marital status - Now married (%)
Marital status - Separated (%)
Marital status - Widowed (%)
Marital status - Divorced (%)
Ancestries Reported - Arab (%)
Ancestries Reported - Czech (%)
Ancestries Reported - Danish (%)
Ancestries Reported - Dutch (%)
Ancestries Reported - English (%)
Ancestries Reported - French (%)
Ancestries Reported - French Canadian (%)
Ancestries Reported - German (%)
Ancestries Reported - Greek (%)
Ancestries Reported - Hungarian (%)
Ancestries Reported - Irish (%)
Ancestries Reported - Italian (%)
Ancestries Reported - Lithuanian (%)
Ancestries Reported - Norwegian (%)
Ancestries Reported - Polish (%)
Ancestries Reported - Portuguese (%)
Ancestries Reported - Russian (%)
Ancestries Reported - Scotch-Irish (%)
Ancestries Reported - Scottish (%)
Ancestries Reported - Slovak (%)
Ancestries Reported - Subsaharan African (%)
Ancestries Reported - Swedish (%)
Ancestries Reported - Swiss (%)
Ancestries Reported - Ukrainian (%)
Ancestries Reported - United States (%)
Ancestries Reported - Welsh (%)
Ancestries Reported - West Indian (%)
Ancestries Reported - Other (%)
Geographical mobility - Same house 1 year ago (%)
Geographical mobility - Same house 1 year ago (%) - White
Geographical mobility - Same house 1 year ago (%) - Black or African American
Geographical mobility - Same house 1 year ago (%) - Asian
Geographical mobility - Same house 1 year ago (%) - Hispanic or Latino
Geographical mobility - Same house 1 year ago (%) - American Indian and Alaska Native
Geographical mobility - Same house 1 year ago (%) - Multirace
Geographical mobility - Same house 1 year ago (%) - Other Race
Geographical mobility - Moved within same county (%)
Geographical mobility - Moved within same county (%) - White
Geographical mobility - Moved within same county (%) - Black or African American
Geographical mobility - Moved within same county (%) - Asian
Geographical mobility - Moved within same county (%) - Hispanic or Latino
Geographical mobility - Moved within same county (%) - American Indian and Alaska Native
Geographical mobility - Moved within same county (%) - Multirace
Geographical mobility - Moved within same county (%) - Other Race
Geographical mobility - Moved from different county within same state (%)
Geographical mobility - Moved from different county within same state (%) - White
Geographical mobility - Moved from different county within same state (%) - Black or African American
Geographical mobility - Moved from different county within same state (%) - Asian
Geographical mobility - Moved from different county within same state (%) - Hispanic or Latino
Geographical mobility - Moved from different county within same state (%) - American Indian and Alaska Native
Geographical mobility - Moved from different county within same state (%) - Multirace
Geographical mobility - Moved from different county within same state (%) - Other Race
Geographical mobility - Moved from different state (%)
Geographical mobility - Moved from different state (%) - White
Geographical mobility - Moved from different state (%) - Black or African American
Geographical mobility - Moved from different state (%) - Asian
Geographical mobility - Moved from different state (%) - Hispanic or Latino
Geographical mobility - Moved from different state (%) - American Indian and Alaska Native
Geographical mobility - Moved from different state (%) - Multirace
Geographical mobility - Moved from different state (%) - Other Race
Geographical mobility - Moved from abroad (%)
Geographical mobility - Moved from abroad (%) - White
Geographical mobility - Moved from abroad (%) - Black or African American
Geographical mobility - Moved from abroad (%) - Asian
Geographical mobility - Moved from abroad (%) - Hispanic or Latino
Geographical mobility - Moved from abroad (%) - American Indian and Alaska Native
Geographical mobility - Moved from abroad (%) - Multirace
Geographical mobility - Moved from abroad (%) - Other Race
Place of birth for the foreign-born population - Ireland (%)
Place of birth for the foreign-born population - Denmark (%)
Place of birth for the foreign-born population - Norway (%)
Place of birth for the foreign-born population - Sweden (%)
Place of birth for the foreign-born population - United Kingdom (%)
Place of birth for the foreign-born population - England (%)
Place of birth for the foreign-born population - Scotland (%)
Place of birth for the foreign-born population - Other Northern Europe (%)
Place of birth for the foreign-born population - Austria (%)
Place of birth for the foreign-born population - Belgium (%)
Place of birth for the foreign-born population - France (%)
Place of birth for the foreign-born population - Germany (%)
Place of birth for the foreign-born population - Netherlands (%)
Place of birth for the foreign-born population - Switzerland (%)
Place of birth for the foreign-born population - Other Western Europe (%)
Place of birth for the foreign-born population - Greece (%)
Place of birth for the foreign-born population - Italy (%)
Place of birth for the foreign-born population - Portugal (%)
Place of birth for the foreign-born population - Spain (%)
Place of birth for the foreign-born population - Other Southern Europe (%)
Place of birth for the foreign-born population - Albania (%)
Place of birth for the foreign-born population - Belarus (%)
Place of birth for the foreign-born population - Bosnia and Herzegovina (%)
Place of birth for the foreign-born population - Bulgaria (%)
Place of birth for the foreign-born population - Croatia (%)
Place of birth for the foreign-born population - Czechoslovakia (%)
Place of birth for the foreign-born population - Hungary (%)
Place of birth for the foreign-born population - Latvia (%)
Place of birth for the foreign-born population - Lithuania (%)
Place of birth for the foreign-born population - North Macedonia (Macedonia) (%)
Place of birth for the foreign-born population - Moldova (%)
Place of birth for the foreign-born population - Poland (%)
Place of birth for the foreign-born population - Romania (%)
Place of birth for the foreign-born population - Russia (%)
Place of birth for the foreign-born population - Serbia (%)
Place of birth for the foreign-born population - Ukraine (%)
Place of birth for the foreign-born population - Other Eastern Europe (%)
Place of birth for the foreign-born population - China (%)
Place of birth for the foreign-born population - Hong Kong (%)
Place of birth for the foreign-born population - Taiwan (%)
Place of birth for the foreign-born population - Japan (%)
Place of birth for the foreign-born population - Korea (%)
Place of birth for the foreign-born population - Other Eastern Asia (%)
Place of birth for the foreign-born population - Afghanistan (%)
Place of birth for the foreign-born population - Bangladesh (%)
Place of birth for the foreign-born population - India (%)
Place of birth for the foreign-born population - Iran (%)
Place of birth for the foreign-born population - Kazakhstan (%)
Place of birth for the foreign-born population - Nepal (%)
Place of birth for the foreign-born population - Pakistan (%)
Place of birth for the foreign-born population - Sri Lanka (%)
Place of birth for the foreign-born population - Uzbekistan (%)
Place of birth for the foreign-born population - Other South Central Asia (%)
Place of birth for the foreign-born population - Burma (%)
Place of birth for the foreign-born population - Cambodia (%)
Place of birth for the foreign-born population - Indonesia (%)
Place of birth for the foreign-born population - Laos (%)
Place of birth for the foreign-born population - Malaysia (%)
Place of birth for the foreign-born population - Philippines (%)
Place of birth for the foreign-born population - Singapore (%)
Place of birth for the foreign-born population - Thailand (%)
Place of birth for the foreign-born population - Vietnam (%)
Place of birth for the foreign-born population - Other South Eastern Asia (%)
Place of birth for the foreign-born population - Armenia (%)
Place of birth for the foreign-born population - Iraq (%)
Place of birth for the foreign-born population - Israel (%)
Place of birth for the foreign-born population - Jordan (%)
Place of birth for the foreign-born population - Kuwait (%)
Place of birth for the foreign-born population - Lebanon (%)
Place of birth for the foreign-born population - Saudi Arabia (%)
Place of birth for the foreign-born population - Syria (%)
Place of birth for the foreign-born population - Turkey (%)
Place of birth for the foreign-born population - Yemen (%)
Place of birth for the foreign-born population - Other Western Asia (%)
Place of birth for the foreign-born population - Eritrea (%)
Place of birth for the foreign-born population - Ethiopia (%)
Place of birth for the foreign-born population - Kenya (%)
Place of birth for the foreign-born population - Somalia (%)
Place of birth for the foreign-born population - Uganda (%)
Place of birth for the foreign-born population - Zimbabwe (%)
Place of birth for the foreign-born population - Other Eastern Africa (%)
Place of birth for the foreign-born population - Cameroon (%)
Place of birth for the foreign-born population - Congo (%)
Place of birth for the foreign-born population - Democratic Republic of Congo (Zaire) (%)
Place of birth for the foreign-born population - Other Middle Africa (%)
Place of birth for the foreign-born population - Egypt (%)
Place of birth for the foreign-born population - Morocco (%)
Place of birth for the foreign-born population - Sudan (%)
Place of birth for the foreign-born population - Other Northern Africa (%)
Place of birth for the foreign-born population - South Africa (%)
Place of birth for the foreign-born population - Other Southern Africa (%)
Place of birth for the foreign-born population - Cabo Verde (%)
Place of birth for the foreign-born population - Ghana (%)
Place of birth for the foreign-born population - Liberia (%)
Place of birth for the foreign-born population - Nigeria (%)
Place of birth for the foreign-born population - Senegal (%)
Place of birth for the foreign-born population - Sierra Leone (%)
Place of birth for the foreign-born population - Other Western Africa (%)
Place of birth for the foreign-born population - Australia (%)
Place of birth for the foreign-born population - New Zealand (%)
Place of birth for the foreign-born population - Fiji (%)
Place of birth for the foreign-born population - Micronesia (%)
Place of birth for the foreign-born population - Bahamas (%)
Place of birth for the foreign-born population - Barbados (%)
Place of birth for the foreign-born population - Cuba (%)
Place of birth for the foreign-born population - Dominica (%)
Place of birth for the foreign-born population - Dominican Republic (%)
Place of birth for the foreign-born population - Grenada (%)
Place of birth for the foreign-born population - Haiti (%)
Place of birth for the foreign-born population - Jamaica (%)
Place of birth for the foreign-born population - St. Vincent and the Grenadines (%)
Place of birth for the foreign-born population - Trinidad and Tobago (%)
Place of birth for the foreign-born population - West Indies (%)
Place of birth for the foreign-born population - Other Caribbean (%)
Place of birth for the foreign-born population - Belize (%)
Place of birth for the foreign-born population - Costa Rica (%)
Place of birth for the foreign-born population - El Salvador (%)
Place of birth for the foreign-born population - Guatemala (%)
Place of birth for the foreign-born population - Honduras (%)
Place of birth for the foreign-born population - Mexico (%)
Place of birth for the foreign-born population - Nicaragua (%)
Place of birth for the foreign-born population - Panama (%)
Place of birth for the foreign-born population - Other Central America (%)
Place of birth for the foreign-born population - Argentina (%)
Place of birth for the foreign-born population - Bolivia (%)
Place of birth for the foreign-born population - Brazil (%)
Place of birth for the foreign-born population - Chile (%)
Place of birth for the foreign-born population - Colombia (%)
Place of birth for the foreign-born population - Ecuador (%)
Place of birth for the foreign-born population - Guyana (%)
Place of birth for the foreign-born population - Peru (%)
Place of birth for the foreign-born population - Uruguay (%)
Place of birth for the foreign-born population - Venezuela (%)
Place of birth for the foreign-born population - Other South America (%)
Place of birth for the foreign-born population - Canada (%)
Place of birth for the foreign-born population - Other Northern America (%)
Place of birth for the foreign-born population - Other (%)
Latest news about races in Romeoville, IL collected exclusively by city-data.com from local newspapers, TV, and radio stations
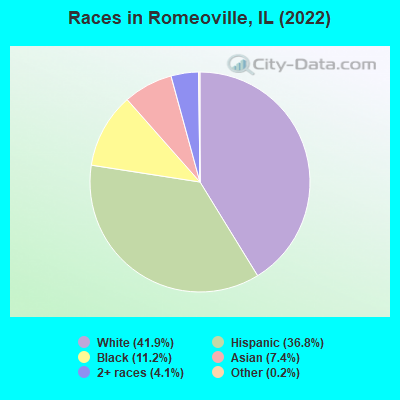
According to 2022 data, the most numerous races in Romeoville, IL are White alone (16,806 residents), Hispanic (14,767 residents), and Black alone (4,481 residents). 58.9% of Romeoville residents speak English at home. 21.2% of Romeoville, IL residents are foreign-born (10.5% born in Latin America, 4.7% born in Asia, 3.3% born in Europe, 2.5% born in Africa), which is 34.0% greater than the foreign-born rate of 14.0% across the entire state of Illinois.
Race distribution in Romeoville
2000 2022
8,424,140 67.8% White alone 1,856,152 14.9% Black alone 1,530,262 12.3% Hispanic 419,916 3.4% Asian alone 153,996 1.2% Two or more races 13,479 0.1% Other race alone 18,232 0.1% American Indian alone 3,116 0.03% Native Hawaiian and Other
7,356,301 58.5% White alone 2,299,726 18.3% Hispanic 1,660,423 13.2% Black alone 747,296 5.9% Asian alone 458,599 3.6% Two or more races 45,386 0.4% Other race alone 10,405 0.08% American Indian alone 3,896 0.03% Native Hawaiian and Other
Income and house value in Romeoville Median household income in 2022 $88,670 White non-Hispanic householders$84,192 Black householders$76,833 American Indian and Alaska Native householders$87,320 Asian householders$93,435 Some other race householders$108,715 Two or more races householders$99,009 Hispanic or Latino race householdersMedian 2022 house value $245,431 White Non-Hispanic householders$334,890 Black or African American householders$188,178 American Indian or Alaska Native householders $370,884 Asian householders$288,582 Some other race householders$222,488 Two or more races householders$254,693 Hispanic or Latino householders
Median age by race in Romeoville
41.2 Median age for White residents38.2 44.5 35.0 Median age for Black or African American residents35.8 37.8 44.5 Median age for American Indian / Alaska Native residents25.0 54.0 42.9 Median age for Asian residents40.6 43.4 -593,236,714.4 Median age for Native Hawaiian / Pacific Islander residents-658,536,584.7 -576,015,108.0 31.5 Median age for Other race residents33.9 26.8 25.4 Median age for Two or more races residents26.2 27.3 43.0 Median age for White alone residents39.2 46.0 31.4 Median age for Hispanic or Latino residents31.2 31.4
Owner/renter occupied households by race in Romeoville
House owners and renters - White residents 6,141 85.2% Owner occupied1,063 14.8% Renter occupiedHouse owners and renters - Black or African American residents 1,249 77.4% Owner occupied364 22.6% Renter occupiedHouse owners and renters - American Indian / Alaska Native residents 71 71.8% Owner occupied28 28.2% Renter occupiedHouse owners and renters - Asian residents 803 93.8% Owner occupied53 6.2% Renter occupiedHouse owners and renters - Other race residents 1,289 90.1% Owner occupied141 9.9% Renter occupiedHouse owners and renters - Two or more races residents 1,479 84.4% Owner occupied274 15.6% Renter occupiedHouse owners and renters - White alone residents 5,330 84.8% Owner occupied957 15.2% Renter occupiedHouse owners and renters - Hispanic or Latino residents 3,049 85.1% Owner occupied532 14.9% Renter occupied
Language usage in Romeoville
English speakers - Total 58.9% of residents of Romeoville speak English at home.
27.0% of residents speak Spanish at home 6,167 60.8% Speak English very well3,969 39.2% Speak English less than very well15.6% of residents speak other language at home 3,728 63.4% Speak English very well2,149 36.6% Speak English less than very well
English speakers - Born in the United States 77.7% of residents of Romeoville speak English at home.
18.1% of residents speak Spanish at home 393 58.2% Speak English very well282 41.8% Speak English less than very well4.6% of residents speak other language at home 116 68.2% Speak English very well54 31.8% Speak English less than very well
English speakers - Native, born elsewhere 30.4% of residents of Romeoville speak English at home.
44.0% of residents speak Spanish at home 284 71.5% Speak English very well113 28.5% Speak English less than very well5.9% of residents speak other language at home 39 73.6% Speak English very well14 26.4% Speak English less than very well
English speakers - Foreign-born 7.8% of residents of Romeoville speak English at home.
45.5% of residents speak Spanish at home 1,456 34.6% Speak English very well2,758 65.4% Speak English less than very well45.9% of residents speak other language at home 2,324 54.7% Speak English very well1,928 45.3% Speak English less than very well
White (Caucasian) - Speak only English Native:
87.2% (14,620)Foreign-born:
9.0% (242)
White (Caucasian) - Speak another language Native:
10.3% (1,723)Foreign-born:
89.4% (2,393)
Black or African American - Speak only English Native:
91.6% (3,392)Foreign-born:
18.8% (139)
Black or African American - Speak another language Native:
9.7% (358)Foreign-born:
84.7% (627)
American Indian / Alaska Native - Speak another language Native:
99.3% (305)Foreign-born:
100.0% (229)
Asian - Speak only English Native:
50.4% (567)Foreign-born:
9.6% (186)
Asian - Speak another language Native:
49.6% (558)Foreign-born:
90.5% (1,745)
Other race - Speak only English Native:
10.1% (357)Foreign-born:
1.1% (16)
Other race - Speak another language Native:
88.0% (3,117)Foreign-born:
98.1% (1,410)
Two or more races - Speak only English Native:
63.8% (2,766)Foreign-born:
5.3% (133)
Two or more races - Speak another language Native:
37.6% (1,628)Foreign-born:
94.5% (2,364)
White alone - Speak only English Native:
95.5% (13,531)Foreign-born:
11.2% (253)
White alone - Speak another language Native:
4.6% (653)Foreign-born:
89.4% (2,023)
Hispanic or Latino - Speak only English Native:
34.2% (3,071)Foreign-born:
2.6% (117)
Hispanic or Latino - Speak another language Native:
65.0% (5,834)Foreign-born:
97.3% (4,310)
Foreign-born residents in Romeoville 8,508 residents are foreign born (10.5% Latin America , 4.7% Asia , 3.3% Europe , 2.5% Africa ).
This city:
21.2%Illinois:
14.1%
Marital status for residents in Romeoville Marital status - White (Caucasian) population 15 years and over
Males 38.9% Never married52.6% Now married0.6% Separated2.0% Widowed5.9% DivorcedFemales 30.5% Never married48.2% Now married0.4% Separated9.1% Widowed11.8% DivorcedWomen who gave birth in the past 12 months Now married:
85.1% (203)Unmarried:
14.9% (36)
Women who did not give birth in the past 12 months Now married:
40.4% (1,968)Unmarried:
59.6% (2,901)
Marital status - Black or African American population 15 years and over
Males 40.2% Never married47.4% Now married3.7% Separated0.6% Widowed8.2% DivorcedFemales 40.1% Never married29.3% Now married8.3% Separated8.7% Widowed13.5% DivorcedWomen who gave birth in the past 12 months Now married:
0.0% (0)Unmarried:
100.0% (75)
Women who did not give birth in the past 12 months Now married:
37.7% (526)Unmarried:
62.3% (868)
Marital status - American Indian / Alaska Native population 15 years and over
Males 48.7% Never married46.5% Now married0.0% Separated0.0% Widowed4.8% DivorcedFemales 21.8% Never married60.6% Now married0.0% Separated6.5% Widowed11.1% DivorcedWomen who did not give birth in the past 12 months Now married:
47.0% (105)Unmarried:
53.0% (118)
Marital status - Asian population 15 years and over
Males 42.4% Never married52.6% Now married1.3% Separated0.0% Widowed3.7% DivorcedFemales 26.6% Never married60.5% Now married0.0% Separated7.5% Widowed5.4% DivorcedWomen who did not give birth in the past 12 months Now married:
56.7% (508)Unmarried:
43.3% (388)
Marital status - Other race population 15 years and over
Males 50.1% Never married39.4% Now married3.0% Separated0.0% Widowed7.4% DivorcedFemales 47.3% Never married43.8% Now married0.0% Separated2.8% Widowed6.1% DivorcedWomen who gave birth in the past 12 months Now married:
28.7% (31)Unmarried:
71.3% (78)
Women who did not give birth in the past 12 months Now married:
41.8% (501)Unmarried:
58.2% (699)
Marital status - Two or more races population 15 years and over
Males 43.8% Never married50.7% Now married0.0% Separated4.0% Widowed1.5% DivorcedFemales 36.7% Never married53.8% Now married2.7% Separated3.7% Widowed3.0% DivorcedWomen who gave birth in the past 12 months Now married:
96.3% (224)Unmarried:
3.7% (9)
Women who did not give birth in the past 12 months Now married:
45.5% (758)Unmarried:
54.5% (907)
Marital status - White alone, not Hispanic / Latino population 15 years and over
Males 39.0% Never married51.9% Now married0.3% Separated2.6% Widowed6.2% DivorcedFemales 30.2% Never married45.4% Now married0.1% Separated11.0% Widowed13.2% DivorcedWomen who gave birth in the past 12 months Now married:
87.2% (142)Unmarried:
12.8% (21)
Women who did not give birth in the past 12 months Now married:
39.1% (1,604)Unmarried:
60.9% (2,496)
Marital status - Hispanic or Latino population 15 years and over
Males 43.9% Never married48.8% Now married1.9% Separated1.3% Widowed4.2% DivorcedFemales 35.8% Never married56.0% Now married0.5% Separated2.5% Widowed5.2% DivorcedWomen who gave birth in the past 12 months Now married:
75.3% (277)Unmarried:
24.7% (91)
Women who did not give birth in the past 12 months Now married:
45.5% (1,493)Unmarried:
54.5% (1,791)
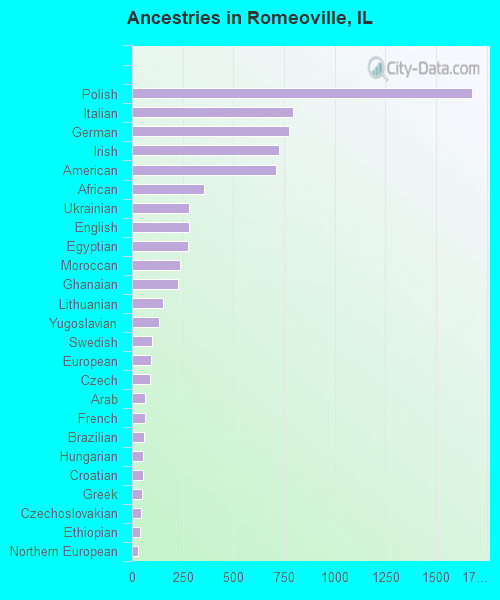
Ancestries in Romeoville
1,678 8.1% Polish793 3.8% Italian774 3.8% German727 3.5% Irish712 3.5% American355 1.7% African283 1.4% Ukrainian282 1.4% English277 1.3% Egyptian237 1.1% Moroccan227 1.1% Ghanaian153 0.7% Lithuanian131 0.6% Yugoslavian99 0.5% Swedish92 0.4% European87 0.4% Czech62 0.3% Arab62 0.3% French60 0.3% Brazilian56 0.3% Hungarian53 0.3% Croatian50 0.2% Greek46 0.2% Czechoslovakian41 0.2% Ethiopian30 0.1% Northern European27 0.1% Macedonian27 0.1% Haitian24 0.1% Canadian20 0.10% Liberian18 0.09% Slovene15 0.07% Nigerian14 0.07% Romanian13 0.06% Albanian12 0.06% Bulgarian10 0.05% Scotch-Irish10 0.05% Scottish10 0.05% Slovak10 0.05% Dutch8 0.04% Norwegian7 0.03% French Canadian5 0.02% British5 0.02% Jamaican4 0.02% Palestinian3 0.01% Estonian2 0.01% Serbian
Geographical mobility in Romeoville Same house 1 year ago 18,689 92.4% White (Caucasian)3,964 86.1% Black or African American820 99.7% American Indian / Alaska Native2,860 91.5% Asian4,887 89.4% Other race7,427 97.5% Two or more races15,339 92.0% White alone, not Hispanic / Latino13,555 93.5% Hispanic or LatinoMoved within same county 578 2.9% White / Caucasian240 5.2% Black or African American110 3.5% Asian422 7.7% Other race191 2.5% Two or more races407 2.4% White alone, not Hispanic / Latino746 5.1% Hispanic or LatinoMoved within same state 633 3.1% White / Caucasian250 5.4% Black or African American125 4.0% Asian87 1.6% Other race124 1.6% Two or more races603 3.6% White alone, not Hispanic / Latino213 1.5% Hispanic or LatinoMoved from different state 216 1.1% White / Caucasian57 1.2% Black or African American5 99.3% Native Hawaiian / Pacific Islander39 0.7% Other race11 0.1% Two or more races238 1.4% White alone, not Hispanic / Latino47 0.3% Hispanic or LatinoMoved from abroad 120 0.6% White88 1.9% Black or African American16 0.5% Asian38 0.7% Other race125 0.7% White alone, not Hispanic / Latino32 0.2% Hispanic or Latino
Children Nativity (place of birth) in Romeoville
Children under 6 years - Living with two parents Both parents native 1,196 100.0% NativeBoth parents foreign-born 308 70.0% Native132 30.0% Foreign-bornOne native, one foreign-born parent 396 100.0% NativeChildren under 6 years - Living with one parent Native parent 721 100.0% NativeForeign-born parent 239 93.7% Native16 6.3% Foreign-bornChildren 6 to 17 years - Living with two parents Both parents native 2,067 92.5% Native167 7.5% Foreign-bornBoth parents foreign-born 1,541 82.3% Native332 17.7% Foreign-bornOne native, one foreign-born parent 620 84.0% Native118 16.0% Foreign-bornChildren 6 to 17 years - Living with one parent Native parent 1,126 100.0% NativeForeign-born parent 227 55.8% Native180 44.2% Foreign-born
Place of birth for residents in Romeoville 4,262 Americas4,220 Latin America3,814 Central America1,894 Asia1,349 Europe1,172 Eastern Europe1,094 South Eastern Asia1,001 Africa561 Northern Africa493 South Central Asia382 Western Africa360 South America162 Eastern Asia132 Western Asia131 China118 Southern Europe46 Caribbean42 Northern America30 Northern Europe28 Western Europe13 Middle Africa3 Eastern Africa3,641 Mexico1,016 Philippines613 Poland284 Morocco276 Egypt233 India231 Pakistan228 Ecuador221 Ghana186 Ukraine132 Lithuania131 China129 Guatemala106 Italy66 Vietnam60 Jordan57 Liberia52 Hungary43 El Salvador42 Canada36 Kuwait32 Venezuela31 Korea28 Bangladesh28 Peru27 Bolivia26 Romania26 Haiti26 Chile23 England18 Nigeria18 United Arab Emirates17 Iraq15 Germany14 North Macedonia (Macedonia)14 Cuba14 Czechoslovakia12 Spain12 Bosnia and Herzegovina12 Moldova12 Thailand12 Bulgaria11 Democratic Republic of Congo (Zaire)9 France6 Jamaica5 United Kingdom4 Netherlands2 Sweden2 Cameroon2 Croatia2 Tanzania1 Uganda1 Israel
Grandparents responsible for own grandchildren in Romeoville
Grandparents (30 to 59 years) White / Caucasian 53 30.4% Responsible for grandchildren121 69.6% Not responsible for grandchildrenBlack or African American 69 93.7% Responsible for grandchildren5 6.3% Not responsible for grandchildrenAsian 39 58.6% Responsible for grandchildren28 41.4% Not responsible for grandchildrenOther race 218 100.0% Not responsible for grandchildrenTwo or more races 39 14.8% Responsible for grandchildren222 85.2% Not responsible for grandchildrenWhite alone, not Hispanic / Latino 72 32.4% Responsible for grandchildren151 67.6% Not responsible for grandchildrenHispanic or Latino 234 100.0% Not responsible for grandchildrenGrandparents (60 years and over) White / Caucasian 51 18.0% Responsible for grandchildren230 82.0% Not responsible for grandchildrenBlack or African American 35 100.0% Not responsible for grandchildrenAsian 259 100.0% Not responsible for grandchildrenTwo or more races 44 19.3% Responsible for grandchildren187 80.7% Not responsible for grandchildrenWhite alone, not Hispanic / Latino 55 21.3% Responsible for grandchildren205 78.7% Not responsible for grandchildrenHispanic or Latino 165 100.0% Not responsible for grandchildren