Races in Ronkonkoma, New York (NY) Detailed Stats
Data:
Races - White alone (%)
Races - White alone (% change since 2000)
Races - Black alone (%)
Races - Black alone (% change since 2000)
Races - American Indian alone (%)
Races - American Indian alone (% change since 2000)
Races - Asian alone (%)
Races - Asian alone (% change since 2000)
Races - Hispanic (%)
Races - Hispanic (% change since 2000)
Races - Native Hawaiian and Other Pacific Islander alone (%)
Races - Native Hawaiian and Other Pacific Islander alone (% change since 2000)
Races - Two or more races(%)
Races - Two or more races(% change since 2000)
Races - Other race alone (%)
Races - Other race alone (% change since 2000)
Racial diversity
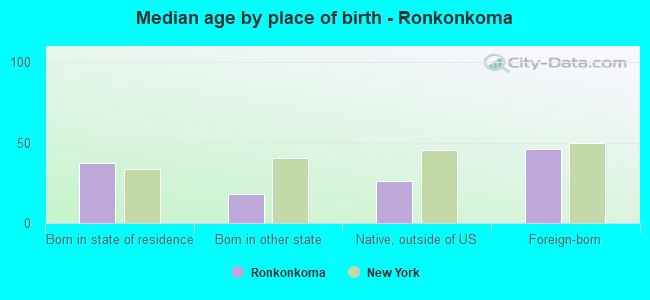
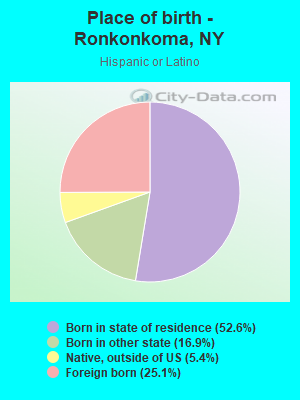
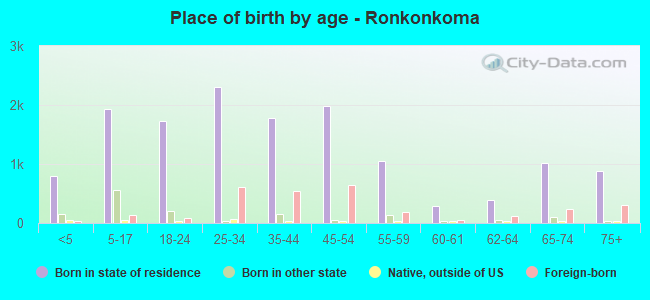
Place of birth - Born in state of residence (%)
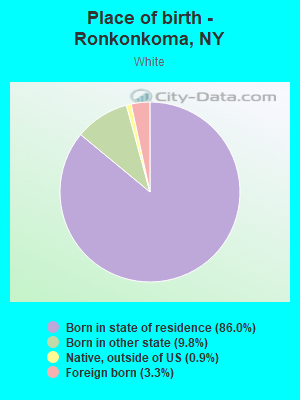
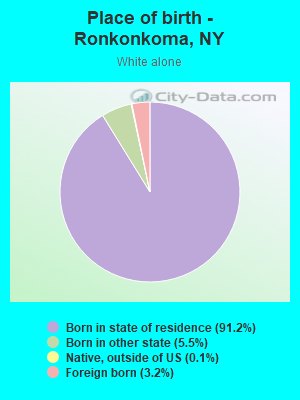
Place of birth - Born in state of residence (%) - White
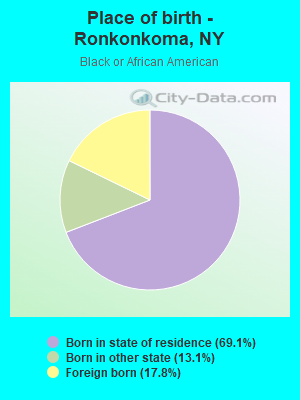
Place of birth - Born in state of residence (%) - Black or African American
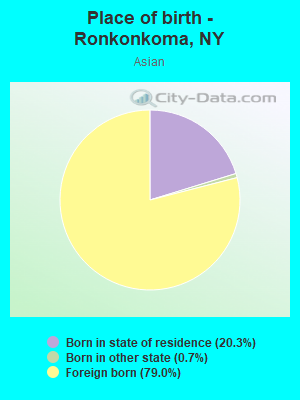
Place of birth - Born in state of residence (%) - Asian
Place of birth - Born in state of residence (%) - Hispanic or Latino
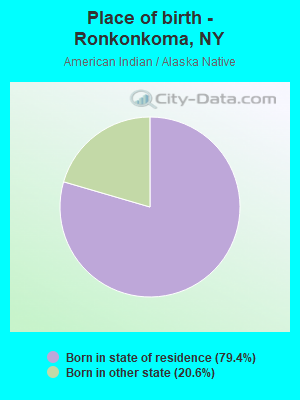
Place of birth - Born in state of residence (%) - American Indian and Alaska Native
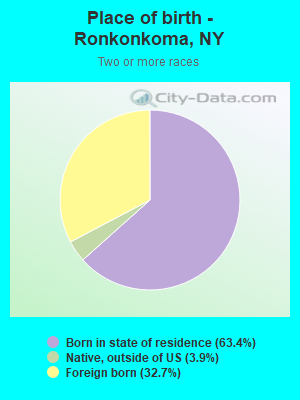
Place of birth - Born in state of residence (%) - Multirace
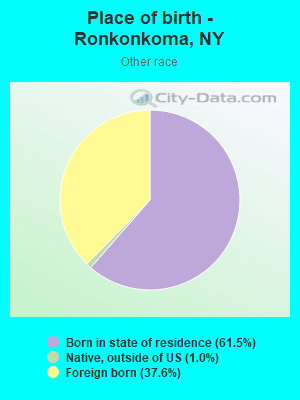
Place of birth - Born in state of residence (%) - Other Race
Place of birth - Born in other state (%)
Place of birth - Born in other state (%) - White
Place of birth - Born in other state (%) - Black or African American
Place of birth - Born in other state (%) - Asian
Place of birth - Born in other state (%) - Hispanic or Latino
Place of birth - Born in other state (%) - American Indian and Alaska Native
Place of birth - Born in other state (%) - Multirace
Place of birth - Born in other state (%) - Other Race
Place of birth - Native, outside of US (%)
Place of birth - Native, outside of US (%) - White
Place of birth - Native, outside of US (%) - Black or African American
Place of birth - Native, outside of US (%) - Asian
Place of birth - Native, outside of US (%) - Hispanic or Latino
Place of birth - Native, outside of US (%) - American Indian and Alaska Native
Place of birth - Native, outside of US (%) - Multirace
Place of birth - Native, outside of US (%) - Other Race
Place of birth - Foreign born (%)
Place of birth - Foreign born (%) - White
Place of birth - Foreign born (%) - Black or African American
Place of birth - Foreign born (%) - Asian
Place of birth - Foreign born (%) - Hispanic or Latino
Place of birth - Foreign born (%) - American Indian and Alaska Native
Place of birth - Foreign born (%) - Multirace
Place of birth - Foreign born (%) - Other Race
Residents speaking English at home (%)
Residents speaking English at home - Born in the United States (%)
Residents speaking English at home - Native, born elsewhere (%)
Residents speaking English at home - Foreign born (%)
Residents speaking Spanish at home (%)
Residents speaking Spanish at home - Born in the United States (%)
Residents speaking Spanish at home - Native, born elsewhere (%)
Residents speaking Spanish at home - Foreign born (%)
Residents speaking other language at home (%)
Residents speaking other language at home - Born in the United States (%)
Residents speaking other language at home - Native, born elsewhere (%)
Residents speaking other language at home - Foreign born (%)
Marital status - Never married (%)
Marital status - Now married (%)
Marital status - Separated (%)
Marital status - Widowed (%)
Marital status - Divorced (%)
Ancestries Reported - Arab (%)
Ancestries Reported - Czech (%)
Ancestries Reported - Danish (%)
Ancestries Reported - Dutch (%)
Ancestries Reported - English (%)
Ancestries Reported - French (%)
Ancestries Reported - French Canadian (%)
Ancestries Reported - German (%)
Ancestries Reported - Greek (%)
Ancestries Reported - Hungarian (%)
Ancestries Reported - Irish (%)
Ancestries Reported - Italian (%)
Ancestries Reported - Lithuanian (%)
Ancestries Reported - Norwegian (%)
Ancestries Reported - Polish (%)
Ancestries Reported - Portuguese (%)
Ancestries Reported - Russian (%)
Ancestries Reported - Scotch-Irish (%)
Ancestries Reported - Scottish (%)
Ancestries Reported - Slovak (%)
Ancestries Reported - Subsaharan African (%)
Ancestries Reported - Swedish (%)
Ancestries Reported - Swiss (%)
Ancestries Reported - Ukrainian (%)
Ancestries Reported - United States (%)
Ancestries Reported - Welsh (%)
Ancestries Reported - West Indian (%)
Ancestries Reported - Other (%)
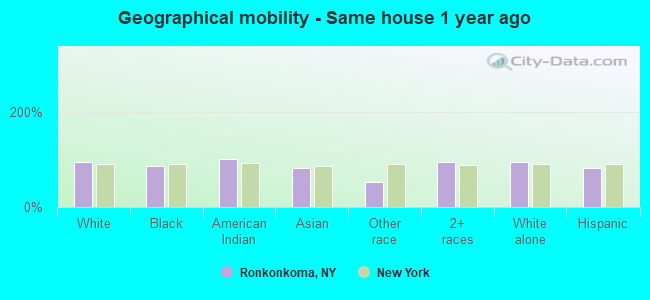
Geographical mobility - Same house 1 year ago (%)
Geographical mobility - Same house 1 year ago (%) - White
Geographical mobility - Same house 1 year ago (%) - Black or African American
Geographical mobility - Same house 1 year ago (%) - Asian
Geographical mobility - Same house 1 year ago (%) - Hispanic or Latino
Geographical mobility - Same house 1 year ago (%) - American Indian and Alaska Native
Geographical mobility - Same house 1 year ago (%) - Multirace
Geographical mobility - Same house 1 year ago (%) - Other Race
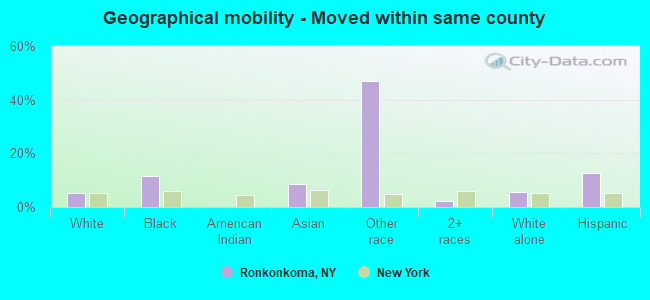
Geographical mobility - Moved within same county (%)
Geographical mobility - Moved within same county (%) - White
Geographical mobility - Moved within same county (%) - Black or African American
Geographical mobility - Moved within same county (%) - Asian
Geographical mobility - Moved within same county (%) - Hispanic or Latino
Geographical mobility - Moved within same county (%) - American Indian and Alaska Native
Geographical mobility - Moved within same county (%) - Multirace
Geographical mobility - Moved within same county (%) - Other Race
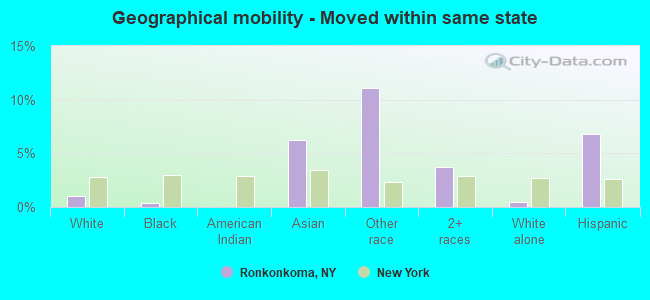
Geographical mobility - Moved from different county within same state (%)
Geographical mobility - Moved from different county within same state (%) - White
Geographical mobility - Moved from different county within same state (%) - Black or African American
Geographical mobility - Moved from different county within same state (%) - Asian
Geographical mobility - Moved from different county within same state (%) - Hispanic or Latino
Geographical mobility - Moved from different county within same state (%) - American Indian and Alaska Native
Geographical mobility - Moved from different county within same state (%) - Multirace
Geographical mobility - Moved from different county within same state (%) - Other Race
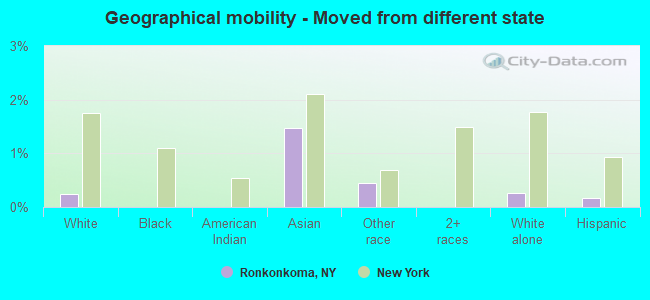
Geographical mobility - Moved from different state (%)
Geographical mobility - Moved from different state (%) - White
Geographical mobility - Moved from different state (%) - Black or African American
Geographical mobility - Moved from different state (%) - Asian
Geographical mobility - Moved from different state (%) - Hispanic or Latino
Geographical mobility - Moved from different state (%) - American Indian and Alaska Native
Geographical mobility - Moved from different state (%) - Multirace
Geographical mobility - Moved from different state (%) - Other Race
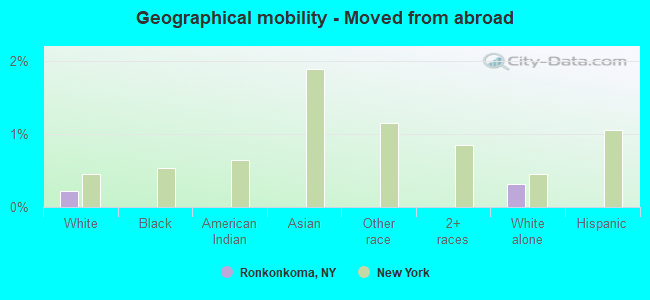
Geographical mobility - Moved from abroad (%)
Geographical mobility - Moved from abroad (%) - White
Geographical mobility - Moved from abroad (%) - Black or African American
Geographical mobility - Moved from abroad (%) - Asian
Geographical mobility - Moved from abroad (%) - Hispanic or Latino
Geographical mobility - Moved from abroad (%) - American Indian and Alaska Native
Geographical mobility - Moved from abroad (%) - Multirace
Geographical mobility - Moved from abroad (%) - Other Race
Place of birth for the foreign-born population - Ireland (%)
Place of birth for the foreign-born population - Denmark (%)
Place of birth for the foreign-born population - Norway (%)
Place of birth for the foreign-born population - Sweden (%)
Place of birth for the foreign-born population - United Kingdom (%)
Place of birth for the foreign-born population - England (%)
Place of birth for the foreign-born population - Scotland (%)
Place of birth for the foreign-born population - Other Northern Europe (%)
Place of birth for the foreign-born population - Austria (%)
Place of birth for the foreign-born population - Belgium (%)
Place of birth for the foreign-born population - France (%)
Place of birth for the foreign-born population - Germany (%)
Place of birth for the foreign-born population - Netherlands (%)
Place of birth for the foreign-born population - Switzerland (%)
Place of birth for the foreign-born population - Other Western Europe (%)
Place of birth for the foreign-born population - Greece (%)
Place of birth for the foreign-born population - Italy (%)
Place of birth for the foreign-born population - Portugal (%)
Place of birth for the foreign-born population - Spain (%)
Place of birth for the foreign-born population - Other Southern Europe (%)
Place of birth for the foreign-born population - Albania (%)
Place of birth for the foreign-born population - Belarus (%)
Place of birth for the foreign-born population - Bosnia and Herzegovina (%)
Place of birth for the foreign-born population - Bulgaria (%)
Place of birth for the foreign-born population - Croatia (%)
Place of birth for the foreign-born population - Czechoslovakia (%)
Place of birth for the foreign-born population - Hungary (%)
Place of birth for the foreign-born population - Latvia (%)
Place of birth for the foreign-born population - Lithuania (%)
Place of birth for the foreign-born population - North Macedonia (Macedonia) (%)
Place of birth for the foreign-born population - Moldova (%)
Place of birth for the foreign-born population - Poland (%)
Place of birth for the foreign-born population - Romania (%)
Place of birth for the foreign-born population - Russia (%)
Place of birth for the foreign-born population - Serbia (%)
Place of birth for the foreign-born population - Ukraine (%)
Place of birth for the foreign-born population - Other Eastern Europe (%)
Place of birth for the foreign-born population - China (%)
Place of birth for the foreign-born population - Hong Kong (%)
Place of birth for the foreign-born population - Taiwan (%)
Place of birth for the foreign-born population - Japan (%)
Place of birth for the foreign-born population - Korea (%)
Place of birth for the foreign-born population - Other Eastern Asia (%)
Place of birth for the foreign-born population - Afghanistan (%)
Place of birth for the foreign-born population - Bangladesh (%)
Place of birth for the foreign-born population - India (%)
Place of birth for the foreign-born population - Iran (%)
Place of birth for the foreign-born population - Kazakhstan (%)
Place of birth for the foreign-born population - Nepal (%)
Place of birth for the foreign-born population - Pakistan (%)
Place of birth for the foreign-born population - Sri Lanka (%)
Place of birth for the foreign-born population - Uzbekistan (%)
Place of birth for the foreign-born population - Other South Central Asia (%)
Place of birth for the foreign-born population - Burma (%)
Place of birth for the foreign-born population - Cambodia (%)
Place of birth for the foreign-born population - Indonesia (%)
Place of birth for the foreign-born population - Laos (%)
Place of birth for the foreign-born population - Malaysia (%)
Place of birth for the foreign-born population - Philippines (%)
Place of birth for the foreign-born population - Singapore (%)
Place of birth for the foreign-born population - Thailand (%)
Place of birth for the foreign-born population - Vietnam (%)
Place of birth for the foreign-born population - Other South Eastern Asia (%)
Place of birth for the foreign-born population - Armenia (%)
Place of birth for the foreign-born population - Iraq (%)
Place of birth for the foreign-born population - Israel (%)
Place of birth for the foreign-born population - Jordan (%)
Place of birth for the foreign-born population - Kuwait (%)
Place of birth for the foreign-born population - Lebanon (%)
Place of birth for the foreign-born population - Saudi Arabia (%)
Place of birth for the foreign-born population - Syria (%)
Place of birth for the foreign-born population - Turkey (%)
Place of birth for the foreign-born population - Yemen (%)
Place of birth for the foreign-born population - Other Western Asia (%)
Place of birth for the foreign-born population - Eritrea (%)
Place of birth for the foreign-born population - Ethiopia (%)
Place of birth for the foreign-born population - Kenya (%)
Place of birth for the foreign-born population - Somalia (%)
Place of birth for the foreign-born population - Uganda (%)
Place of birth for the foreign-born population - Zimbabwe (%)
Place of birth for the foreign-born population - Other Eastern Africa (%)
Place of birth for the foreign-born population - Cameroon (%)
Place of birth for the foreign-born population - Congo (%)
Place of birth for the foreign-born population - Democratic Republic of Congo (Zaire) (%)
Place of birth for the foreign-born population - Other Middle Africa (%)
Place of birth for the foreign-born population - Egypt (%)
Place of birth for the foreign-born population - Morocco (%)
Place of birth for the foreign-born population - Sudan (%)
Place of birth for the foreign-born population - Other Northern Africa (%)
Place of birth for the foreign-born population - South Africa (%)
Place of birth for the foreign-born population - Other Southern Africa (%)
Place of birth for the foreign-born population - Cabo Verde (%)
Place of birth for the foreign-born population - Ghana (%)
Place of birth for the foreign-born population - Liberia (%)
Place of birth for the foreign-born population - Nigeria (%)
Place of birth for the foreign-born population - Senegal (%)
Place of birth for the foreign-born population - Sierra Leone (%)
Place of birth for the foreign-born population - Other Western Africa (%)
Place of birth for the foreign-born population - Australia (%)
Place of birth for the foreign-born population - New Zealand (%)
Place of birth for the foreign-born population - Fiji (%)
Place of birth for the foreign-born population - Micronesia (%)
Place of birth for the foreign-born population - Bahamas (%)
Place of birth for the foreign-born population - Barbados (%)
Place of birth for the foreign-born population - Cuba (%)
Place of birth for the foreign-born population - Dominica (%)
Place of birth for the foreign-born population - Dominican Republic (%)
Place of birth for the foreign-born population - Grenada (%)
Place of birth for the foreign-born population - Haiti (%)
Place of birth for the foreign-born population - Jamaica (%)
Place of birth for the foreign-born population - St. Vincent and the Grenadines (%)
Place of birth for the foreign-born population - Trinidad and Tobago (%)
Place of birth for the foreign-born population - West Indies (%)
Place of birth for the foreign-born population - Other Caribbean (%)
Place of birth for the foreign-born population - Belize (%)
Place of birth for the foreign-born population - Costa Rica (%)
Place of birth for the foreign-born population - El Salvador (%)
Place of birth for the foreign-born population - Guatemala (%)
Place of birth for the foreign-born population - Honduras (%)
Place of birth for the foreign-born population - Mexico (%)
Place of birth for the foreign-born population - Nicaragua (%)
Place of birth for the foreign-born population - Panama (%)
Place of birth for the foreign-born population - Other Central America (%)
Place of birth for the foreign-born population - Argentina (%)
Place of birth for the foreign-born population - Bolivia (%)
Place of birth for the foreign-born population - Brazil (%)
Place of birth for the foreign-born population - Chile (%)
Place of birth for the foreign-born population - Colombia (%)
Place of birth for the foreign-born population - Ecuador (%)
Place of birth for the foreign-born population - Guyana (%)
Place of birth for the foreign-born population - Peru (%)
Place of birth for the foreign-born population - Uruguay (%)
Place of birth for the foreign-born population - Venezuela (%)
Place of birth for the foreign-born population - Other South America (%)
Place of birth for the foreign-born population - Canada (%)
Place of birth for the foreign-born population - Other Northern America (%)
Place of birth for the foreign-born population - Other (%)
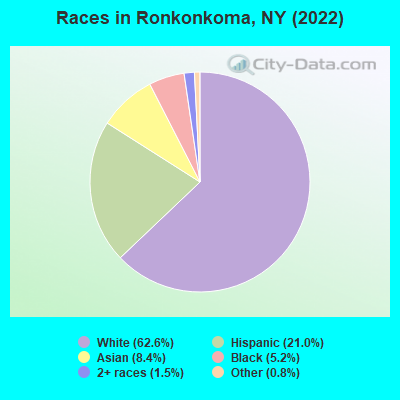
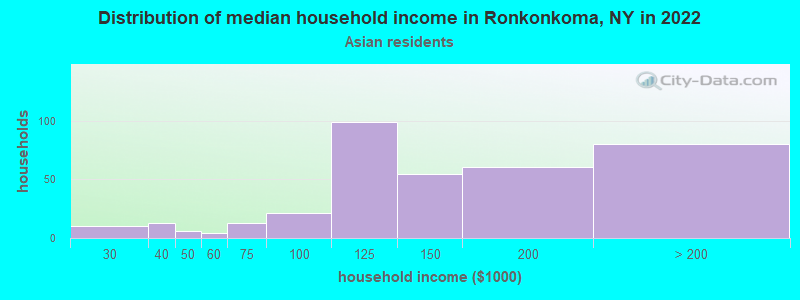
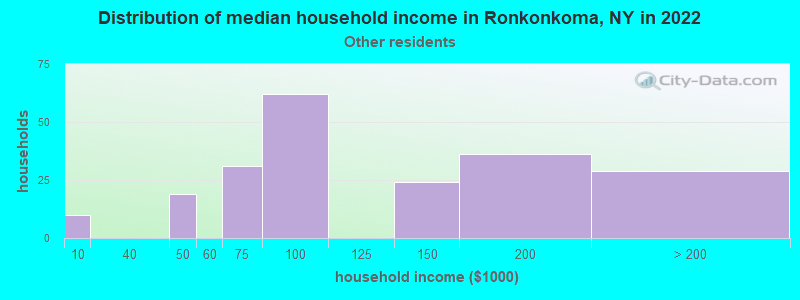
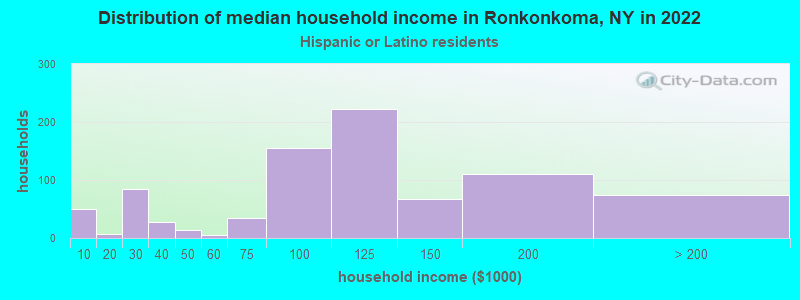
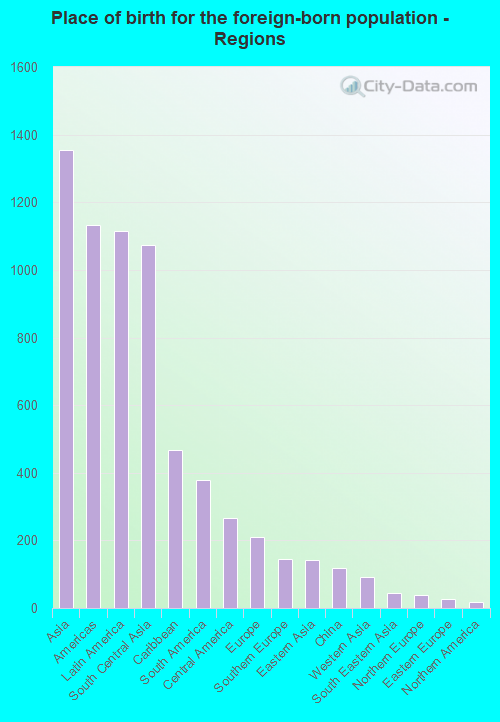
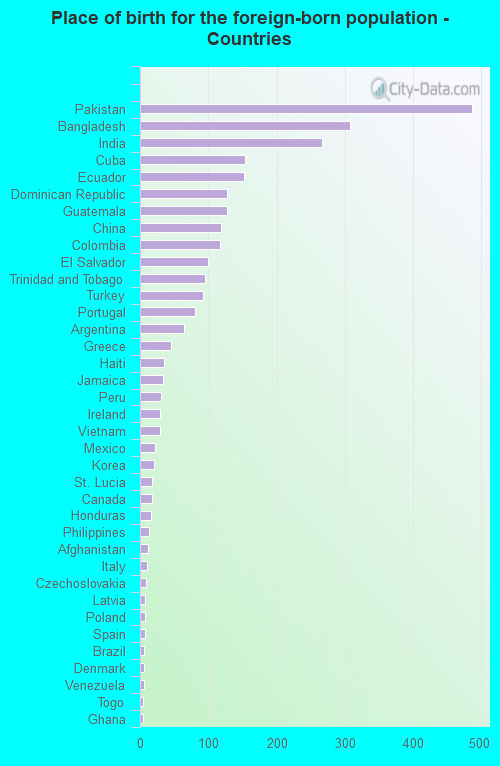
According to 2022 data, the most numerous races in Ronkonkoma, NY are White alone (11,795 residents), Hispanic (3,957 residents), and Black alone (976 residents). 78.6% of Ronkonkoma residents speak English at home. 14.4% of Ronkonkoma, NY residents are foreign-born (7.3% born in Asia, 6.0% born in Latin America), which is 53.0% less than the foreign-born rate of 22.0% across the entire state of New York.
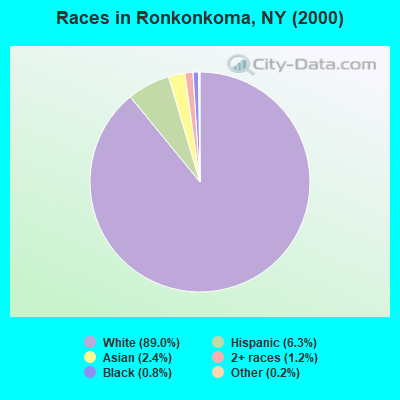
Race distribution in Ronkonkoma
2000 2022
11,760,981 62.0% White alone 2,867,583 15.1% Hispanic 2,812,623 14.8% Black alone 1,035,926 5.5% Asian alone 366,116 1.9% Two or more races 75,499 0.4% Other race alone 52,499 0.3% American Indian alone 5,230 0.03% Native Hawaiian and Other
10,408,933 52.9% White alone 3,867,299 19.7% Hispanic 2,633,840 13.4% Black alone 1,776,286 9.0% Asian alone 732,670 3.7% Two or more races 216,110 1.1% Other race alone 35,082 0.2% American Indian alone 6,931 0.04% Native Hawaiian and Other
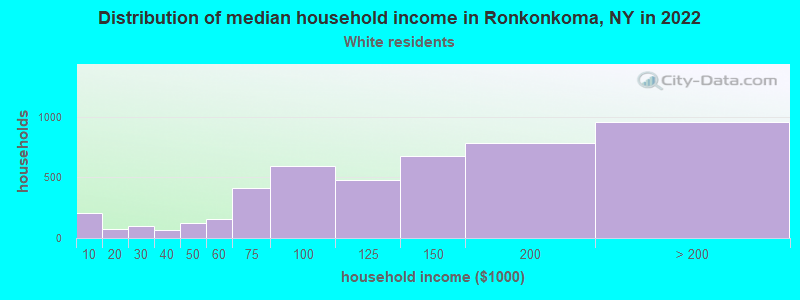
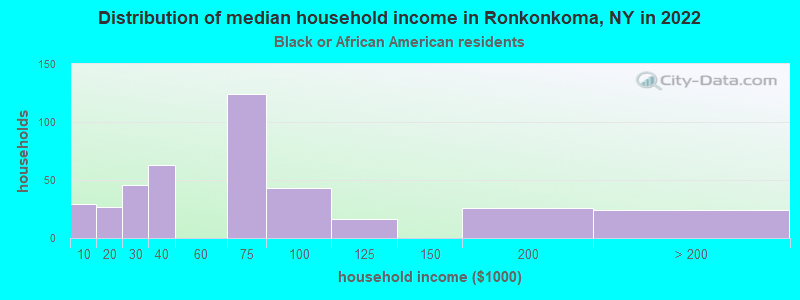
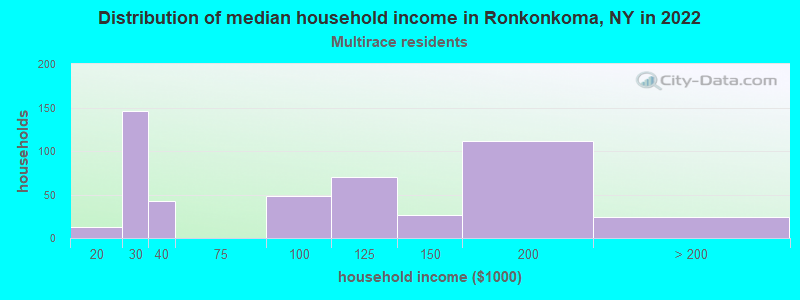
Income and house value in Ronkonkoma Median household income in 2022 $131,211 White non-Hispanic householders$69,210 Black householders$124,362 Asian householders$96,910 Some other race householders$109,035 Hispanic or Latino race householdersMedian 2022 house value $491,071 White Non-Hispanic householders$485,395 Black or African American householders$224,028 American Indian or Alaska Native householders $560,072 Asian householders$474,642 Some other race householders$459,707 Two or more races householders$507,499 Hispanic or Latino householders
Median age by race in Ronkonkoma
40.7 Median age for White residents38.1 44.4 36.1 Median age for Black or African American residents31.4 36.3 -748,832,865.7 Median age for American Indian / Alaska Native residents-807,017,543.1 -513,692,161.9 32.1 Median age for Asian residents39.0 29.0 -742,816,091.2 Median age for Native Hawaiian / Pacific Islander residents-831,187,409.8 -771,300,447.7 30.9 Median age for Other race residents34.9 27.4 43.0 Median age for Two or more races residents44.6 41.7 43.5 Median age for White alone residents42.1 46.3 26.4 Median age for Hispanic or Latino residents22.3 31.8
Owner/renter occupied households by race in Ronkonkoma
House owners and renters - White residents 3,852 82.8% Owner occupied800 17.2% Renter occupiedHouse owners and renters - Black or African American residents 144 35.9% Owner occupied257 64.1% Renter occupiedHouse owners and renters - American Indian / Alaska Native residents 2 100.0% Owner occupiedHouse owners and renters - Asian residents 293 81.6% Owner occupied66 18.4% Renter occupiedHouse owners and renters - Other race residents 165 73.5% Owner occupied60 26.5% Renter occupiedHouse owners and renters - Two or more races residents 454 86.0% Owner occupied74 14.0% Renter occupiedHouse owners and renters - White alone residents 3,635 81.7% Owner occupied815 18.3% Renter occupiedHouse owners and renters - Hispanic or Latino residents 710 81.9% Owner occupied157 18.1% Renter occupied
Language usage in Ronkonkoma
English speakers - Total 78.6% of residents of Ronkonkoma speak English at home.
8.9% of residents speak Spanish at home 1,251 79.4% Speak English very well325 20.6% Speak English less than very well12.0% of residents speak other language at home 1,493 69.8% Speak English very well645 30.2% Speak English less than very well
English speakers - Born in the United States 90.6% of residents of Ronkonkoma speak English at home.
4.4% of residents speak Spanish at home 56 100.0% Speak English very well5.4% of residents speak other language at home 58 85.3% Speak English very well10 14.7% Speak English less than very well
English speakers - Native, born elsewhere 15.0% of residents of Ronkonkoma speak English at home.
74.0% of residents speak Spanish at home 124 83.8% Speak English very well24 16.2% Speak English less than very well
English speakers - Foreign-born 13.9% of residents of Ronkonkoma speak English at home.
28.9% of residents speak Spanish at home 598 70.7% Speak English very well248 29.3% Speak English less than very well53.8% of residents speak other language at home 965 61.2% Speak English very well611 38.8% Speak English less than very well
White (Caucasian) - Speak only English Native:
96.9% (11,536)Foreign-born:
34.6% (150)
White (Caucasian) - Speak another language Native:
3.6% (434)Foreign-born:
66.9% (290)
Black or African American - Speak only English Native:
92.8% (751)Foreign-born:
69.1% (122)
Black or African American - Speak another language Native:
5.7% (46)Foreign-born:
33.8% (60)
Asian - Speak only English Native:
19.9% (42)Foreign-born:
2.5% (30)
Asian - Speak another language Native:
84.7% (177)Foreign-born:
100.0% (1,210)
Other race - Speak only English Native:
59.6% (407)Foreign-born:
12.0% (59)
Other race - Speak another language Native:
42.7% (292)Foreign-born:
87.0% (426)
Two or more races - Speak only English Native:
79.0% (802)Foreign-born:
9.5% (52)
Two or more races - Speak another language Native:
21.5% (219)Foreign-born:
90.9% (495)
White alone - Speak only English Native:
96.6% (10,670)Foreign-born:
28.3% (108)
White alone - Speak another language Native:
3.4% (373)Foreign-born:
71.7% (273)
Hispanic or Latino - Speak only English Native:
75.1% (1,779)Foreign-born:
9.1% (89)
Hispanic or Latino - Speak another language Native:
26.5% (629)Foreign-born:
90.7% (879)
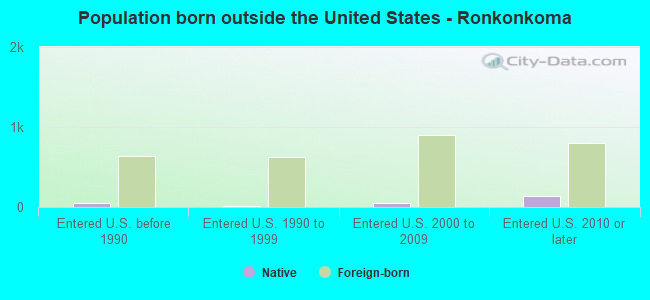
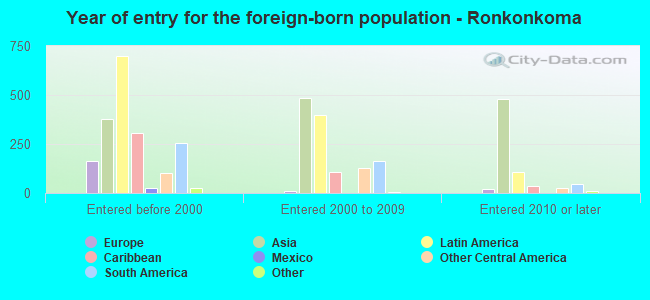
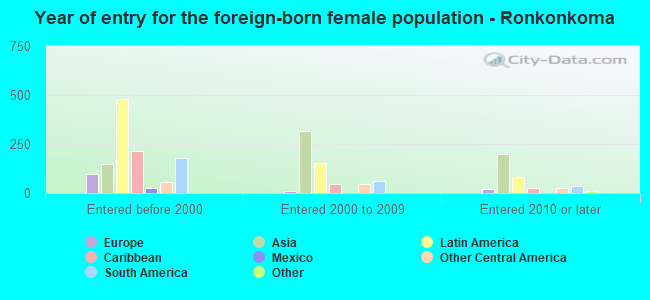
Foreign-born residents in Ronkonkoma 2,711 residents are foreign born (7.3% Asia , 6.0% Latin America ).
This city:
14.4%New York:
22.6%
Marital status for residents in Ronkonkoma Marital status - White (Caucasian) population 15 years and over
Males 36.5% Never married52.7% Now married0.9% Separated2.3% Widowed7.6% DivorcedFemales 31.6% Never married50.5% Now married0.9% Separated6.4% Widowed10.6% DivorcedWomen who gave birth in the past 12 months Now married:
76.2% (108)Unmarried:
23.8% (34)
Women who did not give birth in the past 12 months Now married:
40.2% (1,148)Unmarried:
59.8% (1,708)
Marital status - Black or African American population 15 years and over
Males 37.1% Never married48.8% Now married0.0% Separated3.1% Widowed11.0% DivorcedFemales 37.3% Never married23.6% Now married7.2% Separated21.8% Widowed10.1% DivorcedWomen who gave birth in the past 12 months Now married:
0.0% (0)Unmarried:
99.3% (1)
Women who did not give birth in the past 12 months Now married:
45.6% (102)Unmarried:
54.4% (122)
Marital status - Asian population 15 years and over
Males 29.3% Never married63.9% Now married6.3% Separated0.0% Widowed0.5% DivorcedFemales 8.0% Never married85.7% Now married0.0% Separated6.3% Widowed0.0% DivorcedWomen who gave birth in the past 12 months Now married:
100.0% (44)Unmarried:
0.0% (0)
Women who did not give birth in the past 12 months Now married:
90.0% (429)Unmarried:
10.0% (48)
Marital status - Other race population 15 years and over
Males 43.7% Never married49.3% Now married2.6% Separated2.0% Widowed2.3% DivorcedFemales 36.0% Never married46.8% Now married0.0% Separated17.2% Widowed0.0% DivorcedWomen who gave birth in the past 12 months Now married:
70.8% (25)Unmarried:
29.2% (10)
Women who did not give birth in the past 12 months Now married:
59.3% (163)Unmarried:
40.7% (112)
Marital status - Two or more races population 15 years and over
Males 38.1% Never married61.0% Now married0.0% Separated0.0% Widowed1.0% DivorcedFemales 36.3% Never married25.2% Now married0.4% Separated38.1% Widowed0.0% DivorcedWomen who did not give birth in the past 12 months Now married:
31.1% (104)Unmarried:
68.9% (230)
Marital status - White alone, not Hispanic / Latino population 15 years and over
Males 36.0% Never married52.6% Now married0.5% Separated2.5% Widowed8.3% DivorcedFemales 31.4% Never married50.4% Now married0.6% Separated6.6% Widowed11.0% DivorcedWomen who gave birth in the past 12 months Now married:
75.0% (110)Unmarried:
25.0% (37)
Women who did not give birth in the past 12 months Now married:
38.4% (1,058)Unmarried:
61.6% (1,700)
Marital status - Hispanic or Latino population 15 years and over
Males 40.0% Never married56.0% Now married2.5% Separated0.5% Widowed0.9% DivorcedFemales 32.3% Never married43.3% Now married1.7% Separated20.1% Widowed2.5% DivorcedWomen who gave birth in the past 12 months Now married:
78.1% (26)Unmarried:
21.9% (7)
Women who did not give birth in the past 12 months Now married:
53.0% (388)Unmarried:
47.0% (344)
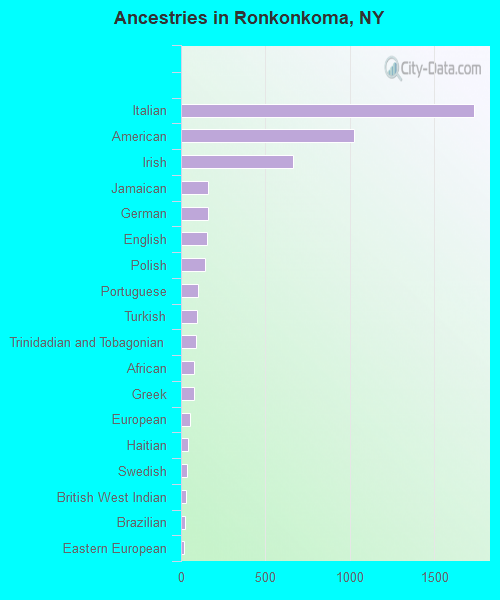
Ancestries in Ronkonkoma
1,737 21.1% Italian1,024 12.5% American666 8.1% Irish162 2.0% Jamaican157 1.9% German154 1.9% English142 1.7% Polish100 1.2% Portuguese92 1.1% Turkish89 1.1% Trinidadian and Tobagonian79 1.0% African76 0.9% Greek56 0.7% European40 0.5% Haitian33 0.4% Swedish27 0.3% British West Indian23 0.3% Brazilian20 0.2% Eastern European14 0.2% Ghanaian10 0.1% Romanian8 0.10% Hungarian7 0.09% Scottish6 0.07% Czech5 0.06% Czechoslovakian5 0.06% French5 0.06% French Canadian5 0.06% Iranian5 0.06% Norwegian4 0.05% Danish4 0.05% Russian
Geographical mobility in Ronkonkoma Same house 1 year ago 11,954 93.5% White (Caucasian)863 85.4% Black or African American15 100.0% American Indian / Alaska Native1,281 82.4% Asian664 51.6% Other race1,577 93.7% Two or more races10,958 93.7% White alone, not Hispanic / Latino3,191 81.4% Hispanic or LatinoMoved within same county 653 5.1% White / Caucasian117 11.6% Black or African American131 8.4% Asian603 46.8% Other race38 2.3% Two or more races637 5.4% White alone, not Hispanic / Latino501 12.8% Hispanic or LatinoMoved within same state 125 1.0% White / Caucasian4 0.4% Black or African American98 6.3% Asian143 11.1% Other race62 3.7% Two or more races55 0.5% White alone, not Hispanic / Latino268 6.8% Hispanic or LatinoMoved from different state 30 0.2% White / Caucasian23 1.5% Asian6 0.4% Other race30 0.3% White alone, not Hispanic / Latino6 0.2% Hispanic or LatinoMoved from abroad 28 0.2% White37 0.3% White alone, not Hispanic / Latino
Children Nativity (place of birth) in Ronkonkoma
Children under 6 years - Living with two parents Both parents native 718 98.7% Native9 1.3% Foreign-bornBoth parents foreign-born 216 94.2% Native13 5.8% Foreign-bornOne native, one foreign-born parent 65 100.0% NativeChildren under 6 years - Living with one parent Native parent 55 100.0% NativeForeign-born parent 116 100.0% NativeChildren 6 to 17 years - Living with two parents Both parents native 1,165 97.3% Native32 2.7% Foreign-bornBoth parents foreign-born 220 87.3% Native32 12.7% Foreign-bornOne native, one foreign-born parent 159 100.0% NativeChildren 6 to 17 years - Living with one parent Native parent 653 100.0% NativeForeign-born parent 110 51.8% Native103 48.2% Foreign-born
Grandparents responsible for own grandchildren in Ronkonkoma
Grandparents (30 to 59 years) White / Caucasian 15 58.5% Responsible for grandchildren10 41.5% Not responsible for grandchildrenOther race 12 100.0% Not responsible for grandchildrenTwo or more races 32 100.0% Not responsible for grandchildrenHispanic or Latino 17 37.4% Responsible for grandchildren28 62.6% Not responsible for grandchildrenGrandparents (60 years and over) White / Caucasian 15 13.5% Responsible for grandchildren96 86.5% Not responsible for grandchildrenOther race 31 100.0% Not responsible for grandchildrenTwo or more races 12 100.0% Not responsible for grandchildrenHispanic or Latino 6 20.2% Responsible for grandchildren23 79.8% Not responsible for grandchildren