Races in Roosevelt, Utah (UT) Detailed Stats
Data:
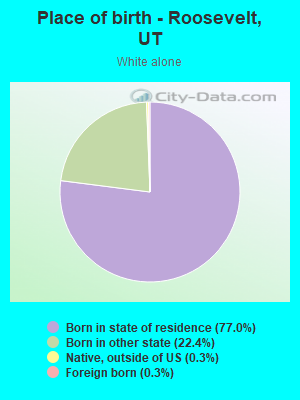
Races - White alone (%)
Races - White alone (% change since 2000)
Races - Black alone (%)
Races - Black alone (% change since 2000)
Races - American Indian alone (%)
Races - American Indian alone (% change since 2000)
Races - Asian alone (%)
Races - Asian alone (% change since 2000)
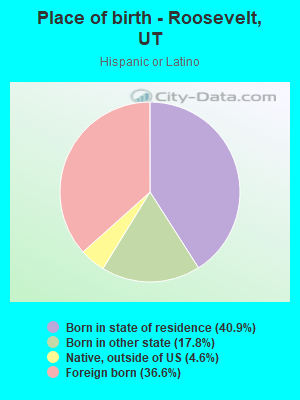
Races - Hispanic (%)
Races - Hispanic (% change since 2000)
Races - Native Hawaiian and Other Pacific Islander alone (%)
Races - Native Hawaiian and Other Pacific Islander alone (% change since 2000)
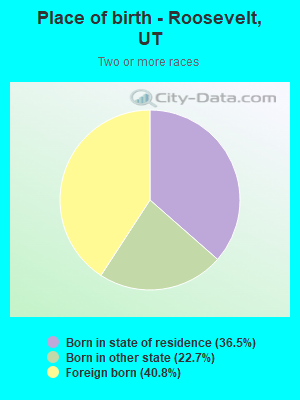
Races - Two or more races(%)
Races - Two or more races(% change since 2000)
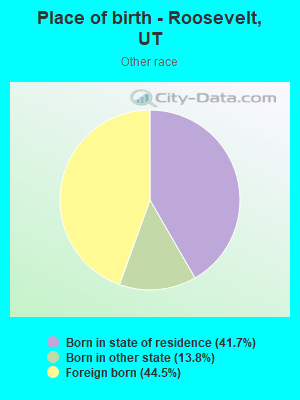
Races - Other race alone (%)
Races - Other race alone (% change since 2000)
Racial diversity
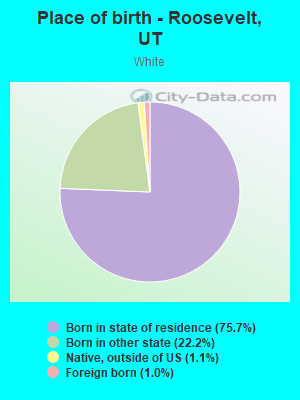
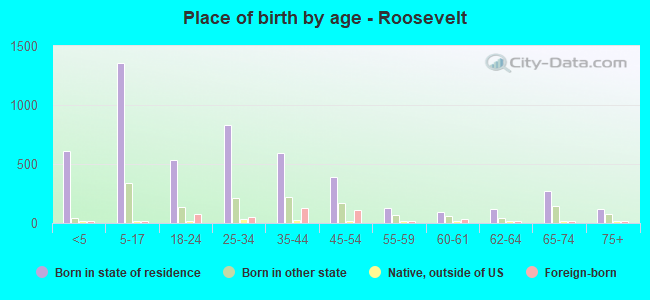
Place of birth - Born in state of residence (%)
Place of birth - Born in state of residence (%) - White
Place of birth - Born in state of residence (%) - Black or African American
Place of birth - Born in state of residence (%) - Asian
Place of birth - Born in state of residence (%) - Hispanic or Latino
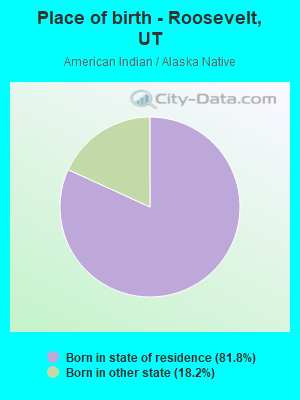
Place of birth - Born in state of residence (%) - American Indian and Alaska Native
Place of birth - Born in state of residence (%) - Multirace
Place of birth - Born in state of residence (%) - Other Race
Place of birth - Born in other state (%)
Place of birth - Born in other state (%) - White
Place of birth - Born in other state (%) - Black or African American
Place of birth - Born in other state (%) - Asian
Place of birth - Born in other state (%) - Hispanic or Latino
Place of birth - Born in other state (%) - American Indian and Alaska Native
Place of birth - Born in other state (%) - Multirace
Place of birth - Born in other state (%) - Other Race
Place of birth - Native, outside of US (%)
Place of birth - Native, outside of US (%) - White
Place of birth - Native, outside of US (%) - Black or African American
Place of birth - Native, outside of US (%) - Asian
Place of birth - Native, outside of US (%) - Hispanic or Latino
Place of birth - Native, outside of US (%) - American Indian and Alaska Native
Place of birth - Native, outside of US (%) - Multirace
Place of birth - Native, outside of US (%) - Other Race
Place of birth - Foreign born (%)
Place of birth - Foreign born (%) - White
Place of birth - Foreign born (%) - Black or African American
Place of birth - Foreign born (%) - Asian
Place of birth - Foreign born (%) - Hispanic or Latino
Place of birth - Foreign born (%) - American Indian and Alaska Native
Place of birth - Foreign born (%) - Multirace
Place of birth - Foreign born (%) - Other Race
Residents speaking English at home (%)
Residents speaking English at home - Born in the United States (%)
Residents speaking English at home - Native, born elsewhere (%)
Residents speaking English at home - Foreign born (%)
Residents speaking Spanish at home (%)
Residents speaking Spanish at home - Born in the United States (%)
Residents speaking Spanish at home - Native, born elsewhere (%)
Residents speaking Spanish at home - Foreign born (%)
Residents speaking other language at home (%)
Residents speaking other language at home - Born in the United States (%)
Residents speaking other language at home - Native, born elsewhere (%)
Residents speaking other language at home - Foreign born (%)
Marital status - Never married (%)
Marital status - Now married (%)
Marital status - Separated (%)
Marital status - Widowed (%)
Marital status - Divorced (%)
Ancestries Reported - Arab (%)
Ancestries Reported - Czech (%)
Ancestries Reported - Danish (%)
Ancestries Reported - Dutch (%)
Ancestries Reported - English (%)
Ancestries Reported - French (%)
Ancestries Reported - French Canadian (%)
Ancestries Reported - German (%)
Ancestries Reported - Greek (%)
Ancestries Reported - Hungarian (%)
Ancestries Reported - Irish (%)
Ancestries Reported - Italian (%)
Ancestries Reported - Lithuanian (%)
Ancestries Reported - Norwegian (%)
Ancestries Reported - Polish (%)
Ancestries Reported - Portuguese (%)
Ancestries Reported - Russian (%)
Ancestries Reported - Scotch-Irish (%)
Ancestries Reported - Scottish (%)
Ancestries Reported - Slovak (%)
Ancestries Reported - Subsaharan African (%)
Ancestries Reported - Swedish (%)
Ancestries Reported - Swiss (%)
Ancestries Reported - Ukrainian (%)
Ancestries Reported - United States (%)
Ancestries Reported - Welsh (%)
Ancestries Reported - West Indian (%)
Ancestries Reported - Other (%)
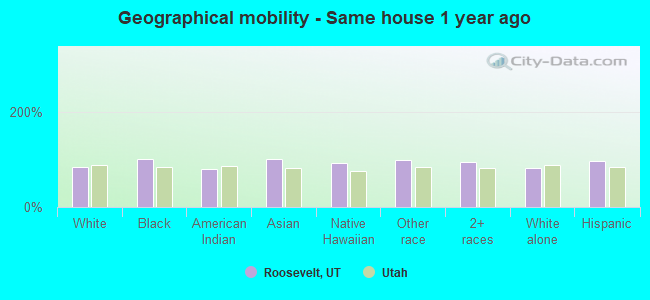
Geographical mobility - Same house 1 year ago (%)
Geographical mobility - Same house 1 year ago (%) - White
Geographical mobility - Same house 1 year ago (%) - Black or African American
Geographical mobility - Same house 1 year ago (%) - Asian
Geographical mobility - Same house 1 year ago (%) - Hispanic or Latino
Geographical mobility - Same house 1 year ago (%) - American Indian and Alaska Native
Geographical mobility - Same house 1 year ago (%) - Multirace
Geographical mobility - Same house 1 year ago (%) - Other Race
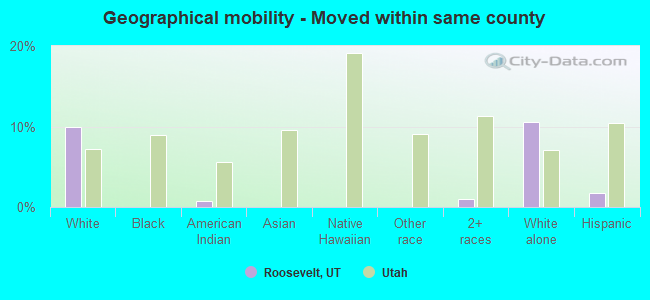
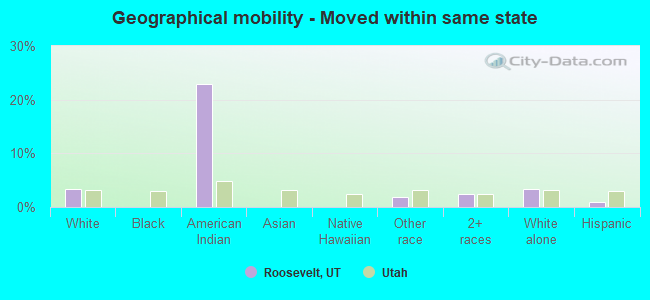
Geographical mobility - Moved within same county (%)
Geographical mobility - Moved within same county (%) - White
Geographical mobility - Moved within same county (%) - Black or African American
Geographical mobility - Moved within same county (%) - Asian
Geographical mobility - Moved within same county (%) - Hispanic or Latino
Geographical mobility - Moved within same county (%) - American Indian and Alaska Native
Geographical mobility - Moved within same county (%) - Multirace
Geographical mobility - Moved within same county (%) - Other Race
Geographical mobility - Moved from different county within same state (%)
Geographical mobility - Moved from different county within same state (%) - White
Geographical mobility - Moved from different county within same state (%) - Black or African American
Geographical mobility - Moved from different county within same state (%) - Asian
Geographical mobility - Moved from different county within same state (%) - Hispanic or Latino
Geographical mobility - Moved from different county within same state (%) - American Indian and Alaska Native
Geographical mobility - Moved from different county within same state (%) - Multirace
Geographical mobility - Moved from different county within same state (%) - Other Race
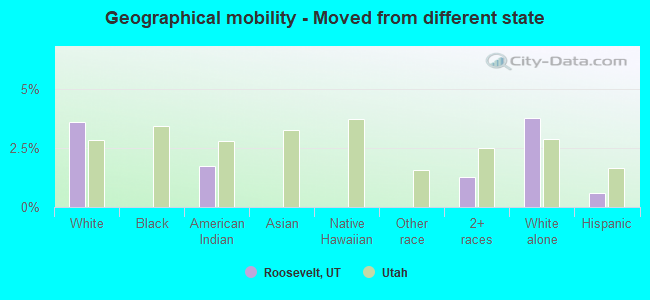
Geographical mobility - Moved from different state (%)
Geographical mobility - Moved from different state (%) - White
Geographical mobility - Moved from different state (%) - Black or African American
Geographical mobility - Moved from different state (%) - Asian
Geographical mobility - Moved from different state (%) - Hispanic or Latino
Geographical mobility - Moved from different state (%) - American Indian and Alaska Native
Geographical mobility - Moved from different state (%) - Multirace
Geographical mobility - Moved from different state (%) - Other Race
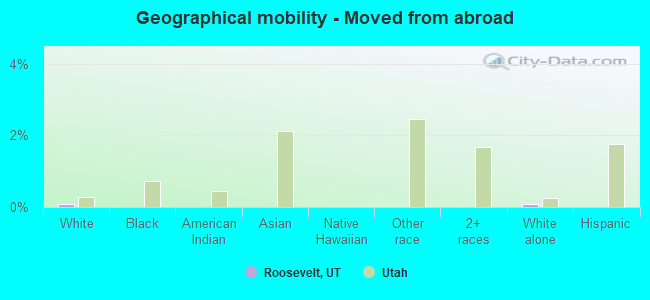
Geographical mobility - Moved from abroad (%)
Geographical mobility - Moved from abroad (%) - White
Geographical mobility - Moved from abroad (%) - Black or African American
Geographical mobility - Moved from abroad (%) - Asian
Geographical mobility - Moved from abroad (%) - Hispanic or Latino
Geographical mobility - Moved from abroad (%) - American Indian and Alaska Native
Geographical mobility - Moved from abroad (%) - Multirace
Geographical mobility - Moved from abroad (%) - Other Race
Place of birth for the foreign-born population - Ireland (%)
Place of birth for the foreign-born population - Denmark (%)
Place of birth for the foreign-born population - Norway (%)
Place of birth for the foreign-born population - Sweden (%)
Place of birth for the foreign-born population - United Kingdom (%)
Place of birth for the foreign-born population - England (%)
Place of birth for the foreign-born population - Scotland (%)
Place of birth for the foreign-born population - Other Northern Europe (%)
Place of birth for the foreign-born population - Austria (%)
Place of birth for the foreign-born population - Belgium (%)
Place of birth for the foreign-born population - France (%)
Place of birth for the foreign-born population - Germany (%)
Place of birth for the foreign-born population - Netherlands (%)
Place of birth for the foreign-born population - Switzerland (%)
Place of birth for the foreign-born population - Other Western Europe (%)
Place of birth for the foreign-born population - Greece (%)
Place of birth for the foreign-born population - Italy (%)
Place of birth for the foreign-born population - Portugal (%)
Place of birth for the foreign-born population - Spain (%)
Place of birth for the foreign-born population - Other Southern Europe (%)
Place of birth for the foreign-born population - Albania (%)
Place of birth for the foreign-born population - Belarus (%)
Place of birth for the foreign-born population - Bosnia and Herzegovina (%)
Place of birth for the foreign-born population - Bulgaria (%)
Place of birth for the foreign-born population - Croatia (%)
Place of birth for the foreign-born population - Czechoslovakia (%)
Place of birth for the foreign-born population - Hungary (%)
Place of birth for the foreign-born population - Latvia (%)
Place of birth for the foreign-born population - Lithuania (%)
Place of birth for the foreign-born population - North Macedonia (Macedonia) (%)
Place of birth for the foreign-born population - Moldova (%)
Place of birth for the foreign-born population - Poland (%)
Place of birth for the foreign-born population - Romania (%)
Place of birth for the foreign-born population - Russia (%)
Place of birth for the foreign-born population - Serbia (%)
Place of birth for the foreign-born population - Ukraine (%)
Place of birth for the foreign-born population - Other Eastern Europe (%)
Place of birth for the foreign-born population - China (%)
Place of birth for the foreign-born population - Hong Kong (%)
Place of birth for the foreign-born population - Taiwan (%)
Place of birth for the foreign-born population - Japan (%)
Place of birth for the foreign-born population - Korea (%)
Place of birth for the foreign-born population - Other Eastern Asia (%)
Place of birth for the foreign-born population - Afghanistan (%)
Place of birth for the foreign-born population - Bangladesh (%)
Place of birth for the foreign-born population - India (%)
Place of birth for the foreign-born population - Iran (%)
Place of birth for the foreign-born population - Kazakhstan (%)
Place of birth for the foreign-born population - Nepal (%)
Place of birth for the foreign-born population - Pakistan (%)
Place of birth for the foreign-born population - Sri Lanka (%)
Place of birth for the foreign-born population - Uzbekistan (%)
Place of birth for the foreign-born population - Other South Central Asia (%)
Place of birth for the foreign-born population - Burma (%)
Place of birth for the foreign-born population - Cambodia (%)
Place of birth for the foreign-born population - Indonesia (%)
Place of birth for the foreign-born population - Laos (%)
Place of birth for the foreign-born population - Malaysia (%)
Place of birth for the foreign-born population - Philippines (%)
Place of birth for the foreign-born population - Singapore (%)
Place of birth for the foreign-born population - Thailand (%)
Place of birth for the foreign-born population - Vietnam (%)
Place of birth for the foreign-born population - Other South Eastern Asia (%)
Place of birth for the foreign-born population - Armenia (%)
Place of birth for the foreign-born population - Iraq (%)
Place of birth for the foreign-born population - Israel (%)
Place of birth for the foreign-born population - Jordan (%)
Place of birth for the foreign-born population - Kuwait (%)
Place of birth for the foreign-born population - Lebanon (%)
Place of birth for the foreign-born population - Saudi Arabia (%)
Place of birth for the foreign-born population - Syria (%)
Place of birth for the foreign-born population - Turkey (%)
Place of birth for the foreign-born population - Yemen (%)
Place of birth for the foreign-born population - Other Western Asia (%)
Place of birth for the foreign-born population - Eritrea (%)
Place of birth for the foreign-born population - Ethiopia (%)
Place of birth for the foreign-born population - Kenya (%)
Place of birth for the foreign-born population - Somalia (%)
Place of birth for the foreign-born population - Uganda (%)
Place of birth for the foreign-born population - Zimbabwe (%)
Place of birth for the foreign-born population - Other Eastern Africa (%)
Place of birth for the foreign-born population - Cameroon (%)
Place of birth for the foreign-born population - Congo (%)
Place of birth for the foreign-born population - Democratic Republic of Congo (Zaire) (%)
Place of birth for the foreign-born population - Other Middle Africa (%)
Place of birth for the foreign-born population - Egypt (%)
Place of birth for the foreign-born population - Morocco (%)
Place of birth for the foreign-born population - Sudan (%)
Place of birth for the foreign-born population - Other Northern Africa (%)
Place of birth for the foreign-born population - South Africa (%)
Place of birth for the foreign-born population - Other Southern Africa (%)
Place of birth for the foreign-born population - Cabo Verde (%)
Place of birth for the foreign-born population - Ghana (%)
Place of birth for the foreign-born population - Liberia (%)
Place of birth for the foreign-born population - Nigeria (%)
Place of birth for the foreign-born population - Senegal (%)
Place of birth for the foreign-born population - Sierra Leone (%)
Place of birth for the foreign-born population - Other Western Africa (%)
Place of birth for the foreign-born population - Australia (%)
Place of birth for the foreign-born population - New Zealand (%)
Place of birth for the foreign-born population - Fiji (%)
Place of birth for the foreign-born population - Micronesia (%)
Place of birth for the foreign-born population - Bahamas (%)
Place of birth for the foreign-born population - Barbados (%)
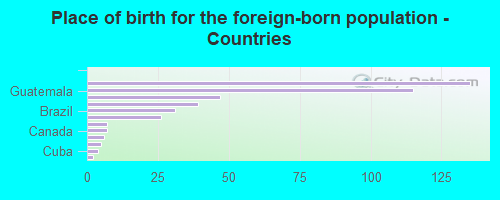
Place of birth for the foreign-born population - Cuba (%)
Place of birth for the foreign-born population - Dominica (%)
Place of birth for the foreign-born population - Dominican Republic (%)
Place of birth for the foreign-born population - Grenada (%)
Place of birth for the foreign-born population - Haiti (%)
Place of birth for the foreign-born population - Jamaica (%)
Place of birth for the foreign-born population - St. Vincent and the Grenadines (%)
Place of birth for the foreign-born population - Trinidad and Tobago (%)
Place of birth for the foreign-born population - West Indies (%)
Place of birth for the foreign-born population - Other Caribbean (%)
Place of birth for the foreign-born population - Belize (%)
Place of birth for the foreign-born population - Costa Rica (%)
Place of birth for the foreign-born population - El Salvador (%)
Place of birth for the foreign-born population - Guatemala (%)
Place of birth for the foreign-born population - Honduras (%)
Place of birth for the foreign-born population - Mexico (%)
Place of birth for the foreign-born population - Nicaragua (%)
Place of birth for the foreign-born population - Panama (%)
Place of birth for the foreign-born population - Other Central America (%)
Place of birth for the foreign-born population - Argentina (%)
Place of birth for the foreign-born population - Bolivia (%)
Place of birth for the foreign-born population - Brazil (%)
Place of birth for the foreign-born population - Chile (%)
Place of birth for the foreign-born population - Colombia (%)
Place of birth for the foreign-born population - Ecuador (%)
Place of birth for the foreign-born population - Guyana (%)
Place of birth for the foreign-born population - Peru (%)
Place of birth for the foreign-born population - Uruguay (%)
Place of birth for the foreign-born population - Venezuela (%)
Place of birth for the foreign-born population - Other South America (%)
Place of birth for the foreign-born population - Canada (%)
Place of birth for the foreign-born population - Other Northern America (%)
Place of birth for the foreign-born population - Other (%)
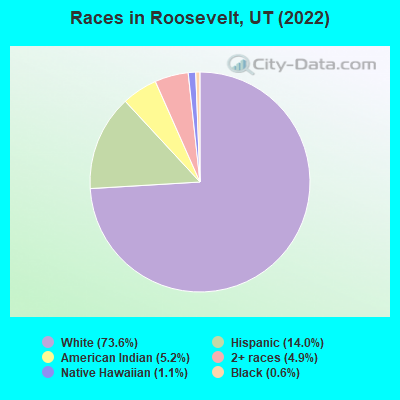
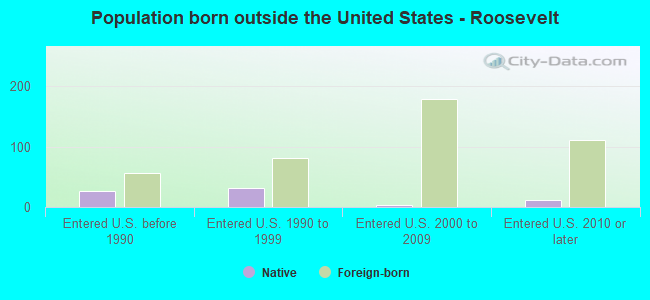
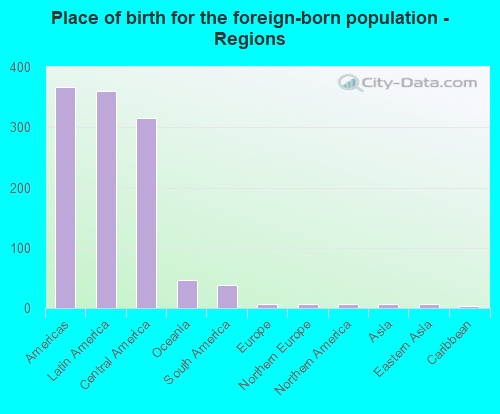
According to 2022 data, the most numerous races in Roosevelt, UT are White alone (5,214 residents), Hispanic (995 residents), and Two or more races (345 residents). 89.0% of Roosevelt residents speak English at home. 6.0% of Roosevelt, UT residents are foreign-born (4.9% born in Latin America, 0.6% born in Oceania), which is 32.5% less than the foreign-born rate of 8.0% across the entire state of Utah.
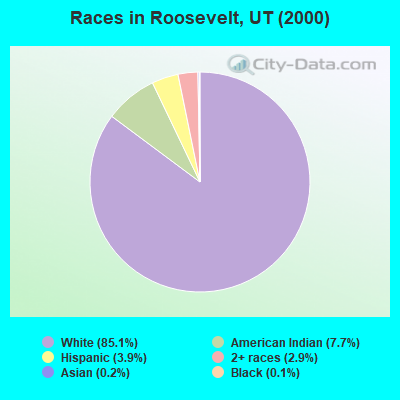
Race distribution in Roosevelt
2000 2022
1,904,265 85.3% White alone 201,559 9.0% Hispanic 36,483 1.6% Asian alone 31,308 1.4% Two or more races 26,663 1.2% American Indian alone 14,806 0.7% Native Hawaiian and Other 16,137 0.7% Black alone 1,948 0.09% Other race alone
2,557,466 75.6% White alone 512,086 15.1% Hispanic 119,308 3.5% Two or more races 82,388 2.4% Asian alone 36,978 1.1% Native Hawaiian and Other 34,873 1.0% Black alone 22,803 0.7% American Indian alone 14,898 0.4% Other race alone
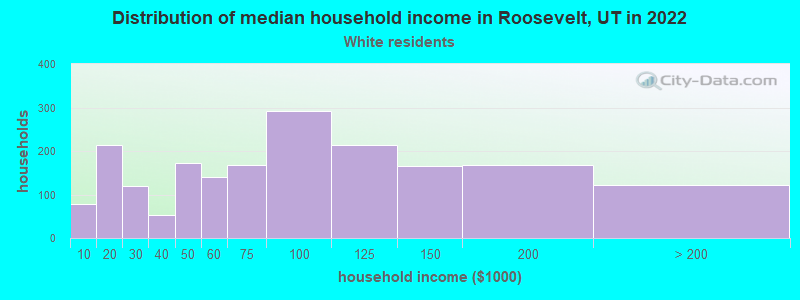
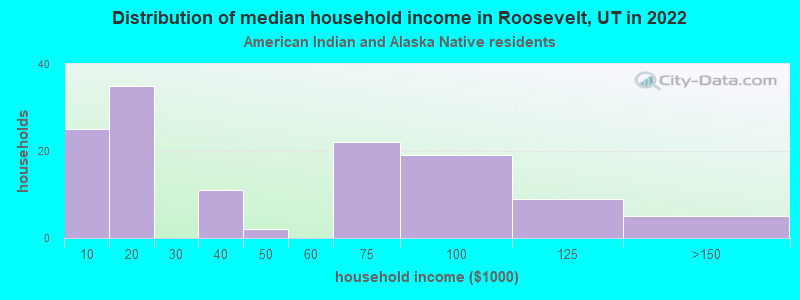
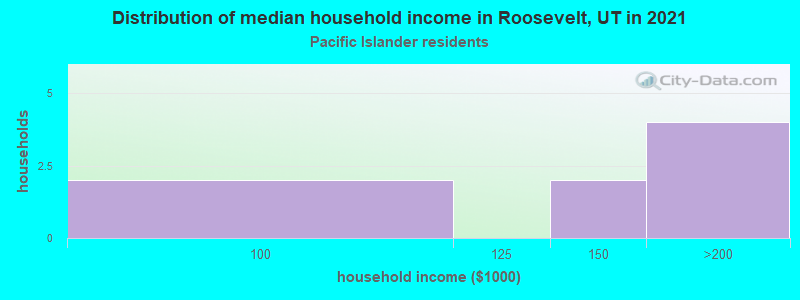
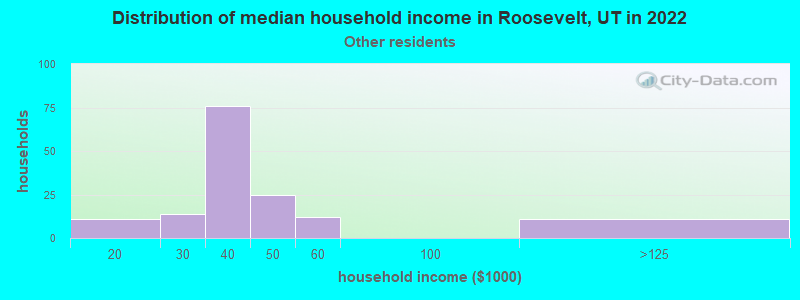
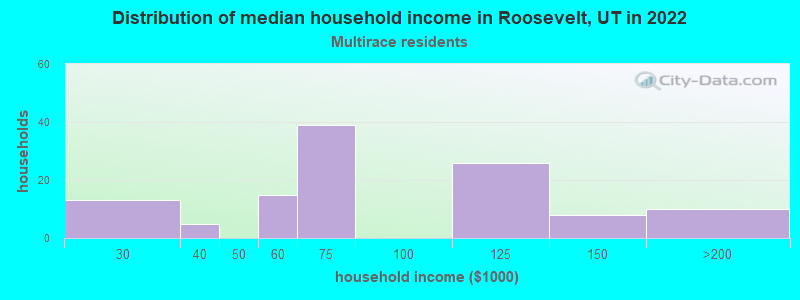
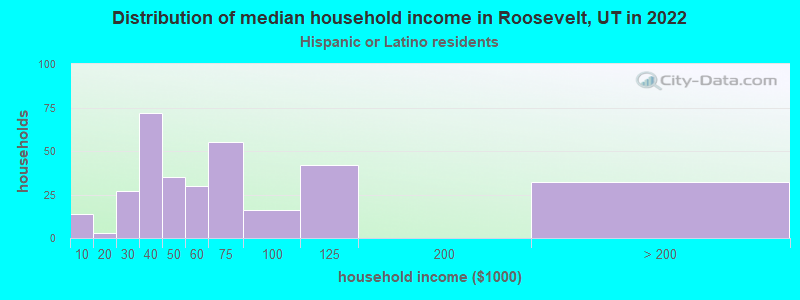
Income and house value in Roosevelt Median household income in 2022 $75,200 White non-Hispanic householders$40,472 Some other race householders$65,357 Two or more races householders$53,235 Hispanic or Latino race householdersMedian 2022 house value $306,316 White Non-Hispanic householders$285,298 American Indian or Alaska Native householders$243,262 Some other race householders$311,376 Two or more races householders$243,262 Hispanic or Latino householders
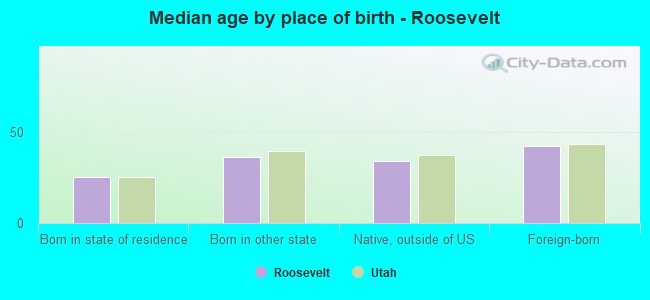
Median age by race in Roosevelt
30.5 Median age for White residents32.1 29.3 -640,726,328.8 Median age for Black or African American residents-620,437,955.6 -686,357,242.6 24.9 Median age for American Indian / Alaska Native residents30.8 21.1 -682,306,939.7 Median age for Asian residents-685,128,204.4 -679,775,280.2 33.0 Median age for Native Hawaiian / Pacific Islander residents24.5 35.4 26.7 Median age for Other race residents26.4 19.3 22.9 Median age for Two or more races residents15.8 32.9 31.2 Median age for White alone residents32.1 30.2 26.7 Median age for Hispanic or Latino residents28.1 19.1
Owner/renter occupied households by race in Roosevelt
House owners and renters - White residents 1,331 69.0% Owner occupied598 31.0% Renter occupiedHouse owners and renters - Black or African American residents 19 100.0% Renter occupiedHouse owners and renters - American Indian / Alaska Native residents 61 43.7% Owner occupied79 56.3% Renter occupiedHouse owners and renters - Native Hawaiian / Pacific Islander residents 11 100.0% Owner occupiedHouse owners and renters - Other race residents 109 65.5% Owner occupied57 34.5% Renter occupiedHouse owners and renters - Two or more races residents 56 53.6% Owner occupied49 46.4% Renter occupiedHouse owners and renters - White alone residents 1,245 67.8% Owner occupied592 32.2% Renter occupiedHouse owners and renters - Hispanic or Latino residents 212 66.1% Owner occupied109 33.9% Renter occupied
Language usage in Roosevelt
English speakers - Total 89.0% of residents of Roosevelt speak English at home.
9.7% of residents speak Spanish at home 327 52.5% Speak English very well296 47.5% Speak English less than very well1.2% of residents speak other language at home 77 98.7% Speak English very well1 1.3% Speak English less than very well
English speakers - Born in the United States 93.2% of residents of Roosevelt speak English at home.
5.7% of residents speak Spanish at home 74 88.1% Speak English very well10 11.9% Speak English less than very well0.9% of residents speak other language at home 14 100.0% Speak English very well
English speakers - Native, born elsewhere 26.1% of residents of Roosevelt speak English at home.
65.2% of residents speak Spanish at home 45 100.0% Speak English less than very well
English speakers - Foreign-born 15.9% of residents of Roosevelt speak English at home.
77.3% of residents speak Spanish at home 131 39.6% Speak English very well200 60.4% Speak English less than very well5.6% of residents speak other language at home 24 100.0% Speak English very well
White (Caucasian) - Speak only English Native:
98.0% (4,894)Foreign-born:
31.9% (18)
White (Caucasian) - Speak another language Native:
2.4% (120)Foreign-born:
66.2% (37)
Other race - Speak another language Native:
80.3% (134)Foreign-born:
97.1% (164)
Two or more races - Speak only English Native:
84.4% (300)Foreign-born:
17.8% (50)
Two or more races - Speak another language Native:
14.9% (53)Foreign-born:
78.1% (221)
White alone - Speak only English Native:
99.3% (4,759)Foreign-born:
100.0% (14)
Hispanic or Latino - Speak only English Native:
46.3% (226)Foreign-born:
1.6% (6)
Hispanic or Latino - Speak another language Native:
53.4% (261)Foreign-born:
98.0% (355)
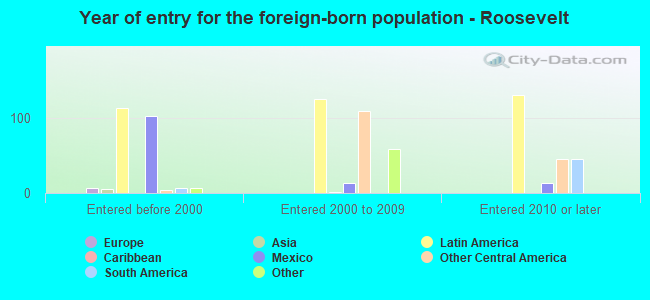
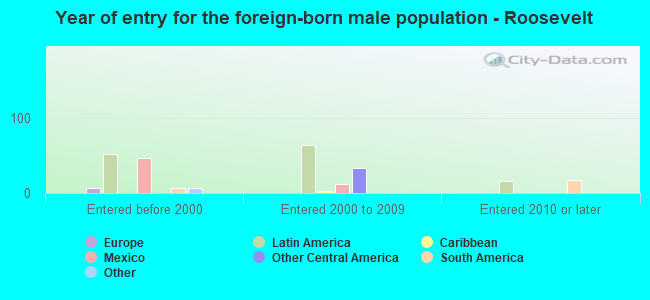
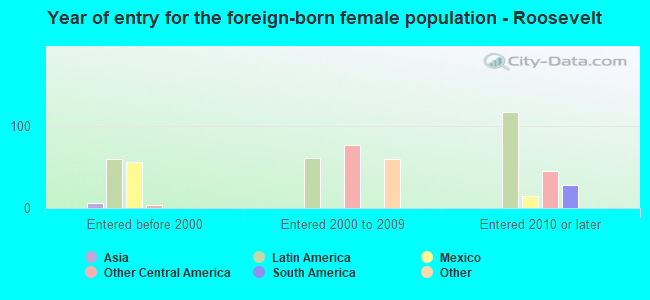
Foreign-born residents in Roosevelt 428 residents are foreign born (4.9% Latin America , 0.6% Oceania ).
Marital status for residents in Roosevelt Marital status - White (Caucasian) population 15 years and over
Males 30.2% Never married55.8% Now married2.2% Separated2.2% Widowed9.7% DivorcedFemales 20.3% Never married59.5% Now married1.3% Separated7.8% Widowed11.1% DivorcedWomen who gave birth in the past 12 months Now married:
82.1% (101)Unmarried:
17.9% (22)
Women who did not give birth in the past 12 months Now married:
61.7% (716)Unmarried:
38.3% (443)
Marital status - American Indian / Alaska Native population 15 years and over
Males 51.5% Never married34.8% Now married0.0% Separated0.0% Widowed13.6% DivorcedFemales 60.2% Never married13.0% Now married0.0% Separated0.0% Widowed26.8% DivorcedWomen who gave birth in the past 12 months Now married:
27.5% (12)Unmarried:
72.5% (31)
Women who did not give birth in the past 12 months Now married:
0.0% (0)Unmarried:
100.0% (70)
Marital status - Native Hawaiian / Pacific Islander population 15 years and over
Males 44.4% Never married55.6% Now married0.0% Separated0.0% Widowed0.0% DivorcedFemales 34.4% Never married25.0% Now married21.9% Separated0.0% Widowed18.8% DivorcedWomen who did not give birth in the past 12 months Now married:
45.0% (11)Unmarried:
55.0% (14)
Marital status - Other race population 15 years and over
Males 62.5% Never married37.5% Now married0.0% Separated0.0% Widowed0.0% DivorcedFemales 51.9% Never married48.1% Now married0.0% Separated0.0% Widowed0.0% DivorcedWomen who did not give birth in the past 12 months Now married:
48.1% (60)Unmarried:
51.9% (64)
Marital status - Two or more races population 15 years and over
Males 29.4% Never married64.7% Now married0.0% Separated0.0% Widowed5.9% DivorcedFemales 16.8% Never married77.2% Now married0.0% Separated0.0% Widowed6.0% DivorcedWomen who gave birth in the past 12 months Now married:
100.0% (19)Unmarried:
0.0% (0)
Women who did not give birth in the past 12 months Now married:
78.1% (133)Unmarried:
21.9% (37)
Marital status - White alone, not Hispanic / Latino population 15 years and over
Males 30.4% Never married55.6% Now married2.3% Separated1.5% Widowed10.3% DivorcedFemales 20.9% Never married58.9% Now married0.8% Separated7.6% Widowed11.7% DivorcedWomen who gave birth in the past 12 months Now married:
80.4% (92)Unmarried:
19.6% (23)
Women who did not give birth in the past 12 months Now married:
60.4% (680)Unmarried:
39.6% (446)
Marital status - Hispanic or Latino population 15 years and over
Males 43.4% Never married51.8% Now married0.0% Separated4.8% Widowed0.0% DivorcedFemales 27.0% Never married61.9% Now married3.3% Separated4.1% Widowed3.7% DivorcedWomen who gave birth in the past 12 months Now married:
100.0% (12)Unmarried:
0.0% (0)
Women who did not give birth in the past 12 months Now married:
65.7% (148)Unmarried:
34.3% (77)
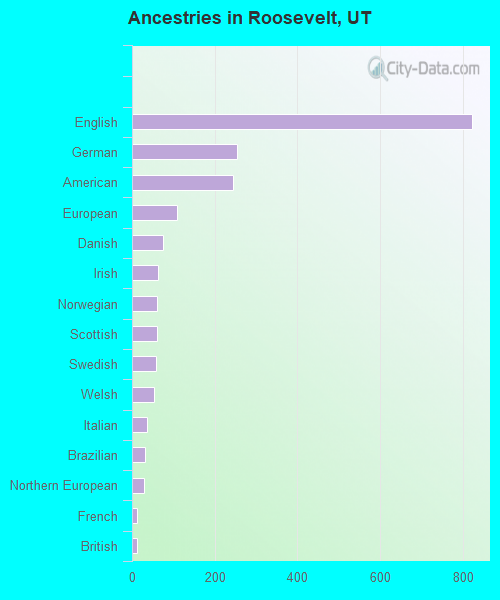
Ancestries in Roosevelt
822 25.6% English254 7.9% German244 7.6% American109 3.4% European74 2.3% Danish62 1.9% Irish60 1.9% Norwegian60 1.9% Scottish58 1.8% Swedish54 1.7% Welsh37 1.2% Italian32 1.0% Brazilian30 0.9% Northern European13 0.4% French12 0.4% British6 0.2% Scandinavian5 0.2% French Canadian5 0.2% Hungarian5 0.2% Scotch-Irish5 0.2% Swiss4 0.1% Polish
Children Nativity (place of birth) in Roosevelt
Children under 6 years - Living with two parents Both parents native 643 100.0% NativeBoth parents foreign-born 20 100.0% NativeOne native, one foreign-born parent 40 100.0% NativeChildren under 6 years - Living with one parent Native parent 111 100.0% NativeChildren 6 to 17 years - Living with two parents Both parents native 1,151 100.0% NativeBoth parents foreign-born 33 80.5% Native8 19.5% Foreign-bornOne native, one foreign-born parent 11 100.0% NativeChildren 6 to 17 years - Living with one parent Native parent 244 100.0% NativeForeign-born parent 10 50.7% Native9 49.3% Foreign-born
Grandparents responsible for own grandchildren in Roosevelt
Grandparents (30 to 59 years) White / Caucasian 92 100.0% Not responsible for grandchildrenAmerican Indian / Alaska Native 4 100.0% Not responsible for grandchildrenWhite alone, not Hispanic / Latino 97 100.0% Not responsible for grandchildrenGrandparents (60 years and over) White / Caucasian 6 20.5% Responsible for grandchildren24 79.5% Not responsible for grandchildrenWhite alone, not Hispanic / Latino 6 19.9% Responsible for grandchildren25 80.1% Not responsible for grandchildren