Races in Roscoe, Illinois (IL) Detailed Stats
Data:
Races - White alone (%)
Races - White alone (% change since 2000)
Races - Black alone (%)
Races - Black alone (% change since 2000)
Races - American Indian alone (%)
Races - American Indian alone (% change since 2000)
Races - Asian alone (%)
Races - Asian alone (% change since 2000)
Races - Hispanic (%)
Races - Hispanic (% change since 2000)
Races - Native Hawaiian and Other Pacific Islander alone (%)
Races - Native Hawaiian and Other Pacific Islander alone (% change since 2000)
Races - Two or more races(%)
Races - Two or more races(% change since 2000)
Races - Other race alone (%)
Races - Other race alone (% change since 2000)
Racial diversity
Place of birth - Born in state of residence (%)
Place of birth - Born in state of residence (%) - White
Place of birth - Born in state of residence (%) - Black or African American
Place of birth - Born in state of residence (%) - Asian
Place of birth - Born in state of residence (%) - Hispanic or Latino
Place of birth - Born in state of residence (%) - American Indian and Alaska Native
Place of birth - Born in state of residence (%) - Multirace
Place of birth - Born in state of residence (%) - Other Race
Place of birth - Born in other state (%)
Place of birth - Born in other state (%) - White
Place of birth - Born in other state (%) - Black or African American
Place of birth - Born in other state (%) - Asian
Place of birth - Born in other state (%) - Hispanic or Latino
Place of birth - Born in other state (%) - American Indian and Alaska Native
Place of birth - Born in other state (%) - Multirace
Place of birth - Born in other state (%) - Other Race
Place of birth - Native, outside of US (%)
Place of birth - Native, outside of US (%) - White
Place of birth - Native, outside of US (%) - Black or African American
Place of birth - Native, outside of US (%) - Asian
Place of birth - Native, outside of US (%) - Hispanic or Latino
Place of birth - Native, outside of US (%) - American Indian and Alaska Native
Place of birth - Native, outside of US (%) - Multirace
Place of birth - Native, outside of US (%) - Other Race
Place of birth - Foreign born (%)
Place of birth - Foreign born (%) - White
Place of birth - Foreign born (%) - Black or African American
Place of birth - Foreign born (%) - Asian
Place of birth - Foreign born (%) - Hispanic or Latino
Place of birth - Foreign born (%) - American Indian and Alaska Native
Place of birth - Foreign born (%) - Multirace
Place of birth - Foreign born (%) - Other Race
Residents speaking English at home (%)
Residents speaking English at home - Born in the United States (%)
Residents speaking English at home - Native, born elsewhere (%)
Residents speaking English at home - Foreign born (%)
Residents speaking Spanish at home (%)
Residents speaking Spanish at home - Born in the United States (%)
Residents speaking Spanish at home - Native, born elsewhere (%)
Residents speaking Spanish at home - Foreign born (%)
Residents speaking other language at home (%)
Residents speaking other language at home - Born in the United States (%)
Residents speaking other language at home - Native, born elsewhere (%)
Residents speaking other language at home - Foreign born (%)
Marital status - Never married (%)
Marital status - Now married (%)
Marital status - Separated (%)
Marital status - Widowed (%)
Marital status - Divorced (%)
Ancestries Reported - Arab (%)
Ancestries Reported - Czech (%)
Ancestries Reported - Danish (%)
Ancestries Reported - Dutch (%)
Ancestries Reported - English (%)
Ancestries Reported - French (%)
Ancestries Reported - French Canadian (%)
Ancestries Reported - German (%)
Ancestries Reported - Greek (%)
Ancestries Reported - Hungarian (%)
Ancestries Reported - Irish (%)
Ancestries Reported - Italian (%)
Ancestries Reported - Lithuanian (%)
Ancestries Reported - Norwegian (%)
Ancestries Reported - Polish (%)
Ancestries Reported - Portuguese (%)
Ancestries Reported - Russian (%)
Ancestries Reported - Scotch-Irish (%)
Ancestries Reported - Scottish (%)
Ancestries Reported - Slovak (%)
Ancestries Reported - Subsaharan African (%)
Ancestries Reported - Swedish (%)
Ancestries Reported - Swiss (%)
Ancestries Reported - Ukrainian (%)
Ancestries Reported - United States (%)
Ancestries Reported - Welsh (%)
Ancestries Reported - West Indian (%)
Ancestries Reported - Other (%)
Geographical mobility - Same house 1 year ago (%)
Geographical mobility - Same house 1 year ago (%) - White
Geographical mobility - Same house 1 year ago (%) - Black or African American
Geographical mobility - Same house 1 year ago (%) - Asian
Geographical mobility - Same house 1 year ago (%) - Hispanic or Latino
Geographical mobility - Same house 1 year ago (%) - American Indian and Alaska Native
Geographical mobility - Same house 1 year ago (%) - Multirace
Geographical mobility - Same house 1 year ago (%) - Other Race
Geographical mobility - Moved within same county (%)
Geographical mobility - Moved within same county (%) - White
Geographical mobility - Moved within same county (%) - Black or African American
Geographical mobility - Moved within same county (%) - Asian
Geographical mobility - Moved within same county (%) - Hispanic or Latino
Geographical mobility - Moved within same county (%) - American Indian and Alaska Native
Geographical mobility - Moved within same county (%) - Multirace
Geographical mobility - Moved within same county (%) - Other Race
Geographical mobility - Moved from different county within same state (%)
Geographical mobility - Moved from different county within same state (%) - White
Geographical mobility - Moved from different county within same state (%) - Black or African American
Geographical mobility - Moved from different county within same state (%) - Asian
Geographical mobility - Moved from different county within same state (%) - Hispanic or Latino
Geographical mobility - Moved from different county within same state (%) - American Indian and Alaska Native
Geographical mobility - Moved from different county within same state (%) - Multirace
Geographical mobility - Moved from different county within same state (%) - Other Race
Geographical mobility - Moved from different state (%)
Geographical mobility - Moved from different state (%) - White
Geographical mobility - Moved from different state (%) - Black or African American
Geographical mobility - Moved from different state (%) - Asian
Geographical mobility - Moved from different state (%) - Hispanic or Latino
Geographical mobility - Moved from different state (%) - American Indian and Alaska Native
Geographical mobility - Moved from different state (%) - Multirace
Geographical mobility - Moved from different state (%) - Other Race
Geographical mobility - Moved from abroad (%)
Geographical mobility - Moved from abroad (%) - White
Geographical mobility - Moved from abroad (%) - Black or African American
Geographical mobility - Moved from abroad (%) - Asian
Geographical mobility - Moved from abroad (%) - Hispanic or Latino
Geographical mobility - Moved from abroad (%) - American Indian and Alaska Native
Geographical mobility - Moved from abroad (%) - Multirace
Geographical mobility - Moved from abroad (%) - Other Race
Place of birth for the foreign-born population - Ireland (%)
Place of birth for the foreign-born population - Denmark (%)
Place of birth for the foreign-born population - Norway (%)
Place of birth for the foreign-born population - Sweden (%)
Place of birth for the foreign-born population - United Kingdom (%)
Place of birth for the foreign-born population - England (%)
Place of birth for the foreign-born population - Scotland (%)
Place of birth for the foreign-born population - Other Northern Europe (%)
Place of birth for the foreign-born population - Austria (%)
Place of birth for the foreign-born population - Belgium (%)
Place of birth for the foreign-born population - France (%)
Place of birth for the foreign-born population - Germany (%)
Place of birth for the foreign-born population - Netherlands (%)
Place of birth for the foreign-born population - Switzerland (%)
Place of birth for the foreign-born population - Other Western Europe (%)
Place of birth for the foreign-born population - Greece (%)
Place of birth for the foreign-born population - Italy (%)
Place of birth for the foreign-born population - Portugal (%)
Place of birth for the foreign-born population - Spain (%)
Place of birth for the foreign-born population - Other Southern Europe (%)
Place of birth for the foreign-born population - Albania (%)
Place of birth for the foreign-born population - Belarus (%)
Place of birth for the foreign-born population - Bosnia and Herzegovina (%)
Place of birth for the foreign-born population - Bulgaria (%)
Place of birth for the foreign-born population - Croatia (%)
Place of birth for the foreign-born population - Czechoslovakia (%)
Place of birth for the foreign-born population - Hungary (%)
Place of birth for the foreign-born population - Latvia (%)
Place of birth for the foreign-born population - Lithuania (%)
Place of birth for the foreign-born population - North Macedonia (Macedonia) (%)
Place of birth for the foreign-born population - Moldova (%)
Place of birth for the foreign-born population - Poland (%)
Place of birth for the foreign-born population - Romania (%)
Place of birth for the foreign-born population - Russia (%)
Place of birth for the foreign-born population - Serbia (%)
Place of birth for the foreign-born population - Ukraine (%)
Place of birth for the foreign-born population - Other Eastern Europe (%)
Place of birth for the foreign-born population - China (%)
Place of birth for the foreign-born population - Hong Kong (%)
Place of birth for the foreign-born population - Taiwan (%)
Place of birth for the foreign-born population - Japan (%)
Place of birth for the foreign-born population - Korea (%)
Place of birth for the foreign-born population - Other Eastern Asia (%)
Place of birth for the foreign-born population - Afghanistan (%)
Place of birth for the foreign-born population - Bangladesh (%)
Place of birth for the foreign-born population - India (%)
Place of birth for the foreign-born population - Iran (%)
Place of birth for the foreign-born population - Kazakhstan (%)
Place of birth for the foreign-born population - Nepal (%)
Place of birth for the foreign-born population - Pakistan (%)
Place of birth for the foreign-born population - Sri Lanka (%)
Place of birth for the foreign-born population - Uzbekistan (%)
Place of birth for the foreign-born population - Other South Central Asia (%)
Place of birth for the foreign-born population - Burma (%)
Place of birth for the foreign-born population - Cambodia (%)
Place of birth for the foreign-born population - Indonesia (%)
Place of birth for the foreign-born population - Laos (%)
Place of birth for the foreign-born population - Malaysia (%)
Place of birth for the foreign-born population - Philippines (%)
Place of birth for the foreign-born population - Singapore (%)
Place of birth for the foreign-born population - Thailand (%)
Place of birth for the foreign-born population - Vietnam (%)
Place of birth for the foreign-born population - Other South Eastern Asia (%)
Place of birth for the foreign-born population - Armenia (%)
Place of birth for the foreign-born population - Iraq (%)
Place of birth for the foreign-born population - Israel (%)
Place of birth for the foreign-born population - Jordan (%)
Place of birth for the foreign-born population - Kuwait (%)
Place of birth for the foreign-born population - Lebanon (%)
Place of birth for the foreign-born population - Saudi Arabia (%)
Place of birth for the foreign-born population - Syria (%)
Place of birth for the foreign-born population - Turkey (%)
Place of birth for the foreign-born population - Yemen (%)
Place of birth for the foreign-born population - Other Western Asia (%)
Place of birth for the foreign-born population - Eritrea (%)
Place of birth for the foreign-born population - Ethiopia (%)
Place of birth for the foreign-born population - Kenya (%)
Place of birth for the foreign-born population - Somalia (%)
Place of birth for the foreign-born population - Uganda (%)
Place of birth for the foreign-born population - Zimbabwe (%)
Place of birth for the foreign-born population - Other Eastern Africa (%)
Place of birth for the foreign-born population - Cameroon (%)
Place of birth for the foreign-born population - Congo (%)
Place of birth for the foreign-born population - Democratic Republic of Congo (Zaire) (%)
Place of birth for the foreign-born population - Other Middle Africa (%)
Place of birth for the foreign-born population - Egypt (%)
Place of birth for the foreign-born population - Morocco (%)
Place of birth for the foreign-born population - Sudan (%)
Place of birth for the foreign-born population - Other Northern Africa (%)
Place of birth for the foreign-born population - South Africa (%)
Place of birth for the foreign-born population - Other Southern Africa (%)
Place of birth for the foreign-born population - Cabo Verde (%)
Place of birth for the foreign-born population - Ghana (%)
Place of birth for the foreign-born population - Liberia (%)
Place of birth for the foreign-born population - Nigeria (%)
Place of birth for the foreign-born population - Senegal (%)
Place of birth for the foreign-born population - Sierra Leone (%)
Place of birth for the foreign-born population - Other Western Africa (%)
Place of birth for the foreign-born population - Australia (%)
Place of birth for the foreign-born population - New Zealand (%)
Place of birth for the foreign-born population - Fiji (%)
Place of birth for the foreign-born population - Micronesia (%)
Place of birth for the foreign-born population - Bahamas (%)
Place of birth for the foreign-born population - Barbados (%)
Place of birth for the foreign-born population - Cuba (%)
Place of birth for the foreign-born population - Dominica (%)
Place of birth for the foreign-born population - Dominican Republic (%)
Place of birth for the foreign-born population - Grenada (%)
Place of birth for the foreign-born population - Haiti (%)
Place of birth for the foreign-born population - Jamaica (%)
Place of birth for the foreign-born population - St. Vincent and the Grenadines (%)
Place of birth for the foreign-born population - Trinidad and Tobago (%)
Place of birth for the foreign-born population - West Indies (%)
Place of birth for the foreign-born population - Other Caribbean (%)
Place of birth for the foreign-born population - Belize (%)
Place of birth for the foreign-born population - Costa Rica (%)
Place of birth for the foreign-born population - El Salvador (%)
Place of birth for the foreign-born population - Guatemala (%)
Place of birth for the foreign-born population - Honduras (%)
Place of birth for the foreign-born population - Mexico (%)
Place of birth for the foreign-born population - Nicaragua (%)
Place of birth for the foreign-born population - Panama (%)
Place of birth for the foreign-born population - Other Central America (%)
Place of birth for the foreign-born population - Argentina (%)
Place of birth for the foreign-born population - Bolivia (%)
Place of birth for the foreign-born population - Brazil (%)
Place of birth for the foreign-born population - Chile (%)
Place of birth for the foreign-born population - Colombia (%)
Place of birth for the foreign-born population - Ecuador (%)
Place of birth for the foreign-born population - Guyana (%)
Place of birth for the foreign-born population - Peru (%)
Place of birth for the foreign-born population - Uruguay (%)
Place of birth for the foreign-born population - Venezuela (%)
Place of birth for the foreign-born population - Other South America (%)
Place of birth for the foreign-born population - Canada (%)
Place of birth for the foreign-born population - Other Northern America (%)
Place of birth for the foreign-born population - Other (%)
Latest news about races in Roscoe, IL collected exclusively by city-data.com from local newspapers, TV, and radio stations
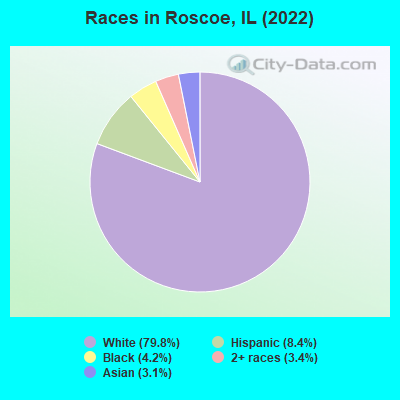
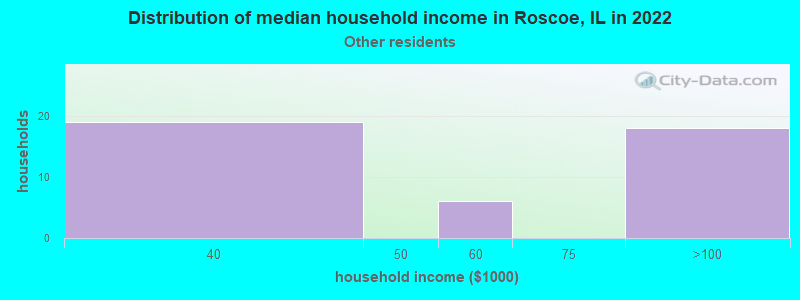
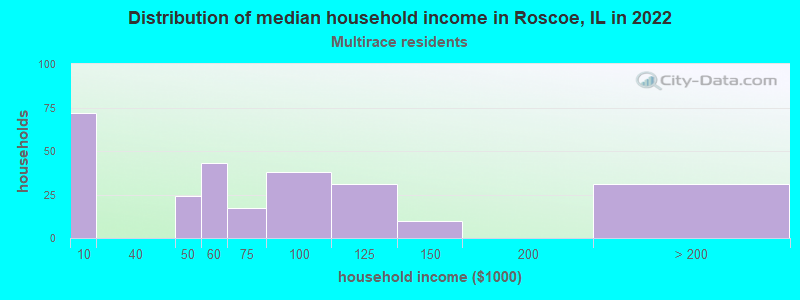
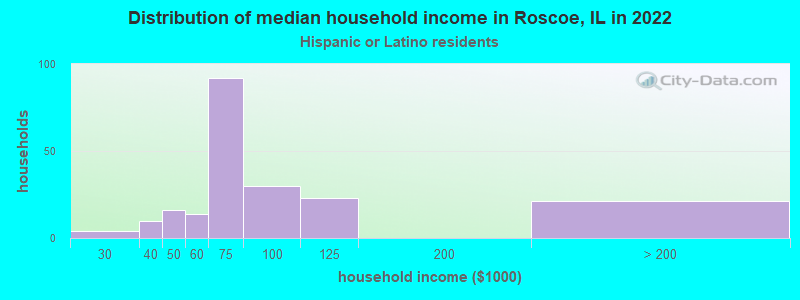
According to 2022 data, the most numerous races in Roscoe, IL are White alone (8,810 residents), Hispanic (926 residents), and Black alone (465 residents). 91.0% of Roscoe residents speak English at home. 6.8% of Roscoe, IL residents are foreign-born (2.7% born in Europe, 1.9% born in Asia, 1.4% born in Latin America), which is 104.4% less than the foreign-born rate of 14.0% across the entire state of Illinois.
Race distribution in Roscoe
2000 2022
8,424,140 67.8% White alone 1,856,152 14.9% Black alone 1,530,262 12.3% Hispanic 419,916 3.4% Asian alone 153,996 1.2% Two or more races 13,479 0.1% Other race alone 18,232 0.1% American Indian alone 3,116 0.03% Native Hawaiian and Other
7,356,301 58.5% White alone 2,299,726 18.3% Hispanic 1,660,423 13.2% Black alone 747,296 5.9% Asian alone 458,599 3.6% Two or more races 45,386 0.4% Other race alone 10,405 0.08% American Indian alone 3,896 0.03% Native Hawaiian and Other
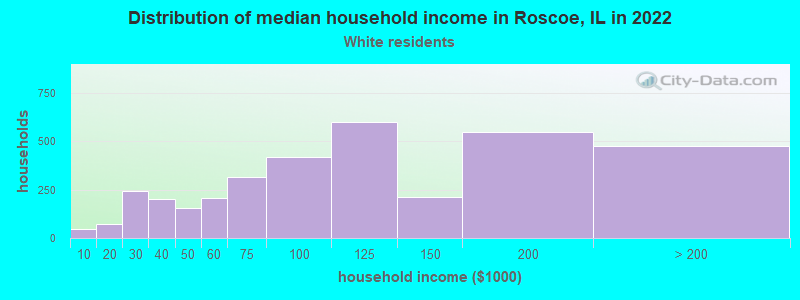
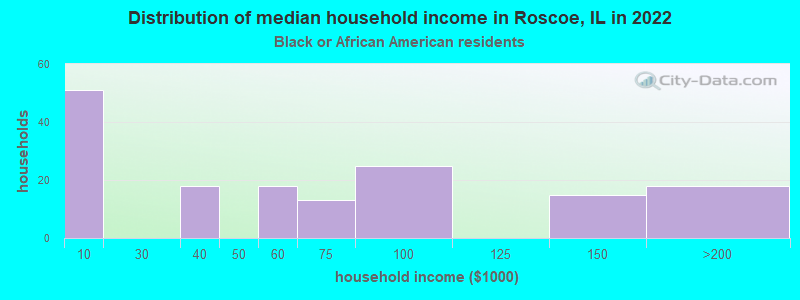
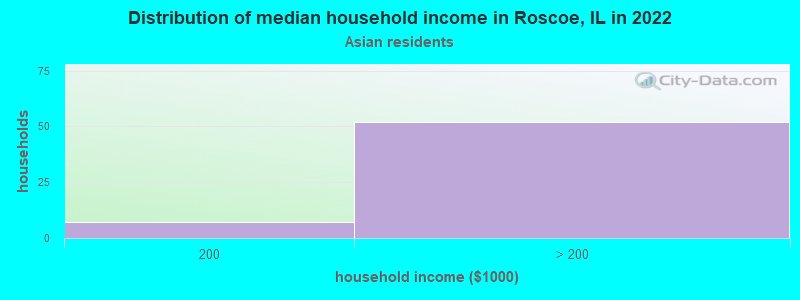
Income and house value in Roscoe Median household income in 2022 $101,462 White non-Hispanic householders$60,739 Black householders$189,897 Asian householders$65,152 Two or more races householders$83,772 Hispanic or Latino race householdersMedian 2022 house value $239,008 White Non-Hispanic householders$325,283 Black or African American householders $275,239 Asian householders$194,369 Some other race householders$275,239 Two or more races householders$203,977 Hispanic or Latino householders
Median age by race in Roscoe
37.7 Median age for White residents38.4 37.9 33.2 Median age for Black or African American residents44.6 34.6 -671,485,943.1 Median age for American Indian / Alaska Native residents-367,313,915.5 -798,727,127.3 48.1 Median age for Asian residents46.8 47.0 -410,158,729.7 Median age for Native Hawaiian / Pacific Islander residents-580,818,242.2 -576,015,108.0 64.0 Median age for Other race residents49.9 -614,173,227.7 24.5 Median age for Two or more races residents19.3 25.2 36.9 Median age for White alone residents36.9 37.2 23.0 Median age for Hispanic or Latino residents32.7 20.8
Owner/renter occupied households by race in Roscoe
House owners and renters - White residents 2,494 72.6% Owner occupied942 27.4% Renter occupiedHouse owners and renters - Black or African American residents 122 71.8% Owner occupied48 28.2% Renter occupiedHouse owners and renters - Asian residents 33 100.0% Owner occupiedHouse owners and renters - Other race residents 60 100.0% Owner occupiedHouse owners and renters - Two or more races residents 298 94.6% Owner occupied17 5.4% Renter occupiedHouse owners and renters - White alone residents 2,521 72.8% Owner occupied943 27.2% Renter occupiedHouse owners and renters - Hispanic or Latino residents 158 73.5% Owner occupied57 26.5% Renter occupied
Language usage in Roscoe
English speakers - Total 91.0% of residents of Roscoe speak English at home.
3.6% of residents speak Spanish at home 307 84.3% Speak English very well57 15.7% Speak English less than very well5.0% of residents speak other language at home 361 72.5% Speak English very well137 27.5% Speak English less than very well
English speakers - Born in the United States 96.1% of residents of Roscoe speak English at home.
2.2% of residents speak Spanish at home 55 100.0% Speak English very well0.6% of residents speak other language at home 16 100.0% Speak English very well
English speakers - Native, born elsewhere 34.8% of residents of Roscoe speak English at home.
14.0% of residents speak Spanish at home 16 64.0% Speak English very well9 36.0% Speak English less than very well13.5% of residents speak other language at home 24 100.0% Speak English very well
English speakers - Foreign-born 25.0% of residents of Roscoe speak English at home.
15.3% of residents speak Spanish at home 79 77.5% Speak English very well23 22.5% Speak English less than very well54.6% of residents speak other language at home 241 66.4% Speak English very well122 33.6% Speak English less than very well
White (Caucasian) - Speak only English Native:
100.0% (7,716)Foreign-born:
45.4% (79)
White (Caucasian) - Speak another language Native:
1.1% (87)Foreign-born:
55.4% (96)
Black or African American - Speak only English Native:
94.8% (314)Foreign-born:
42.1% (30)
Black or African American - Speak another language Native:
8.0% (26)Foreign-born:
48.9% (35)
Asian - Speak only English Native:
92.5% (91)Foreign-born:
3.6% (7)
Asian - Speak another language Native:
17.1% (17)Foreign-born:
98.3% (204)
Other race - Speak another language Native:
21.0% (16)Foreign-born:
100.0% (17)
Two or more races - Speak only English Native:
69.1% (733)Foreign-born:
26.9% (13)
Two or more races - Speak another language Native:
31.7% (337)Foreign-born:
75.2% (37)
White alone - Speak only English Native:
98.3% (7,706)Foreign-born:
38.1% (73)
White alone - Speak another language Native:
1.5% (118)Foreign-born:
56.1% (107)
Hispanic or Latino - Speak only English Native:
62.8% (403)Foreign-born:
33.2% (47)
Hispanic or Latino - Speak another language Native:
36.0% (231)Foreign-born:
70.2% (100)
Foreign-born residents in Roscoe 756 residents are foreign born (2.7% Europe , 1.9% Asia , 1.4% Latin America ).
This city:
6.8%Illinois:
14.1%
Marital status for residents in Roscoe Marital status - White (Caucasian) population 15 years and over
Males 22.0% Never married62.8% Now married0.0% Separated2.1% Widowed13.1% DivorcedFemales 21.5% Never married60.0% Now married0.4% Separated5.7% Widowed12.4% DivorcedWomen who gave birth in the past 12 months Now married:
87.3% (144)Unmarried:
12.7% (21)
Women who did not give birth in the past 12 months Now married:
59.7% (1,107)Unmarried:
40.3% (749)
Marital status - Black or African American population 15 years and over
Males 36.7% Never married63.3% Now married0.0% Separated0.0% Widowed0.0% DivorcedFemales 57.7% Never married42.3% Now married0.0% Separated0.0% Widowed0.0% DivorcedWomen who did not give birth in the past 12 months Now married:
12.7% (12)Unmarried:
87.3% (82)
Marital status - Asian population 15 years and over
Males 19.9% Never married80.1% Now married0.0% Separated0.0% Widowed0.0% DivorcedFemales 0.0% Never married78.4% Now married0.0% Separated21.6% Widowed0.0% DivorcedWomen who did not give birth in the past 12 months Now married:
100.0% (67)Unmarried:
0.0% (0)
Marital status - Other race population 15 years and over
Males 0.0% Never married100.0% Now married0.0% Separated0.0% Widowed0.0% DivorcedFemales 0.0% Never married100.0% Now married0.0% Separated0.0% Widowed0.0% DivorcedMarital status - Two or more races population 15 years and over
Males 44.8% Never married53.2% Now married2.0% Separated0.0% Widowed0.0% DivorcedFemales 26.8% Never married55.9% Now married0.0% Separated4.5% Widowed12.7% DivorcedWomen who gave birth in the past 12 months Now married:
100.0% (36)Unmarried:
0.0% (0)
Women who did not give birth in the past 12 months Now married:
57.6% (173)Unmarried:
42.4% (127)
Marital status - White alone, not Hispanic / Latino population 15 years and over
Males 22.4% Never married62.1% Now married0.0% Separated1.9% Widowed13.6% DivorcedFemales 21.8% Never married59.3% Now married0.5% Separated5.8% Widowed12.6% DivorcedWomen who gave birth in the past 12 months Now married:
87.3% (153)Unmarried:
12.7% (22)
Women who did not give birth in the past 12 months Now married:
58.4% (1,111)Unmarried:
41.6% (791)
Marital status - Hispanic or Latino population 15 years and over
Males 31.1% Never married66.5% Now married0.0% Separated2.4% Widowed0.0% DivorcedFemales 21.6% Never married73.9% Now married0.0% Separated4.5% Widowed0.0% DivorcedWomen who gave birth in the past 12 months Now married:
100.0% (23)Unmarried:
0.0% (0)
Women who did not give birth in the past 12 months Now married:
69.6% (118)Unmarried:
30.4% (51)
Ancestries in Roscoe
587 13.9% German391 9.3% American285 6.7% Italian257 6.1% Swedish249 5.9% Irish218 5.2% Polish154 3.6% Albanian124 2.9% English118 2.8% Norwegian82 1.9% Nigerian72 1.7% Scottish64 1.5% Serbian50 1.2% Haitian49 1.2% Russian41 1.0% European39 0.9% Czech32 0.8% Danish32 0.8% French30 0.7% Belgian25 0.6% Scandinavian21 0.5% Lithuanian21 0.5% Scotch-Irish14 0.3% Eastern European9 0.2% Czechoslovakian9 0.2% Slovak7 0.2% Armenian5 0.1% Swiss4 0.09% British3 0.07% German Russian
Children Nativity (place of birth) in Roscoe
Children under 6 years - Living with two parents Both parents native 899 100.0% NativeBoth parents foreign-born 42 100.0% NativeOne native, one foreign-born parent 35 100.0% NativeChildren under 6 years - Living with one parent Native parent 241 100.0% NativeChildren 6 to 17 years - Living with two parents Both parents native 1,328 100.0% NativeBoth parents foreign-born 91 100.0% NativeOne native, one foreign-born parent 82 100.0% NativeChildren 6 to 17 years - Living with one parent Native parent 537 100.0% NativeForeign-born parent 22 63.6% Native13 36.4% Foreign-born
Grandparents responsible for own grandchildren in Roscoe
Grandparents (30 to 59 years) White / Caucasian 54 56.8% Responsible for grandchildren41 43.2% Not responsible for grandchildrenBlack or African American 30 100.0% Not responsible for grandchildrenTwo or more races 59 100.0% Responsible for grandchildrenWhite alone, not Hispanic / Latino 65 58.8% Responsible for grandchildren46 41.2% Not responsible for grandchildrenHispanic or Latino 39 100.0% Responsible for grandchildrenGrandparents (60 years and over) White / Caucasian 18 24.4% Responsible for grandchildren54 75.6% Not responsible for grandchildrenBlack or African American 33 100.0% Not responsible for grandchildrenWhite alone, not Hispanic / Latino 18 23.0% Responsible for grandchildren60 77.0% Not responsible for grandchildren