Races in Rosemount, Minnesota (MN) Detailed Stats
Data:
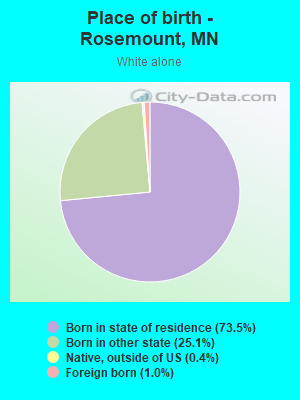
Races - White alone (%)
Races - White alone (% change since 2000)
Races - Black alone (%)
Races - Black alone (% change since 2000)
Races - American Indian alone (%)
Races - American Indian alone (% change since 2000)
Races - Asian alone (%)
Races - Asian alone (% change since 2000)
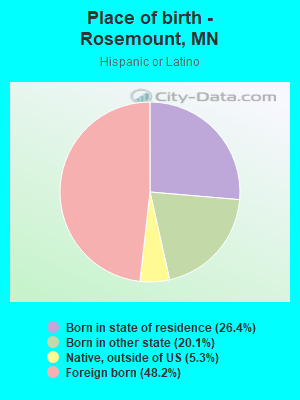
Races - Hispanic (%)
Races - Hispanic (% change since 2000)
Races - Native Hawaiian and Other Pacific Islander alone (%)
Races - Native Hawaiian and Other Pacific Islander alone (% change since 2000)
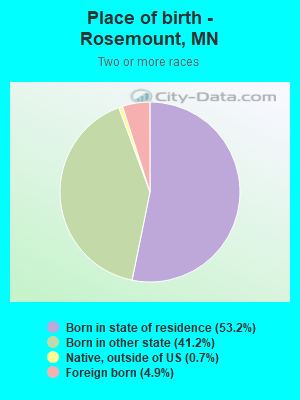
Races - Two or more races(%)
Races - Two or more races(% change since 2000)
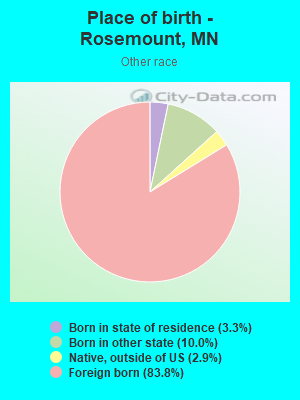
Races - Other race alone (%)
Races - Other race alone (% change since 2000)
Racial diversity
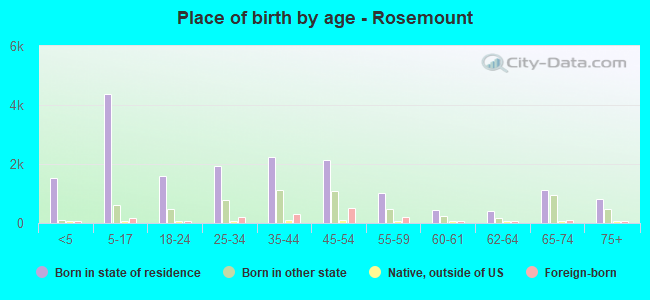
Place of birth - Born in state of residence (%)
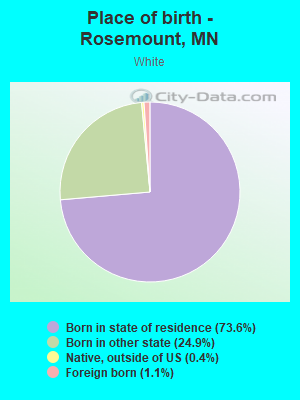
Place of birth - Born in state of residence (%) - White
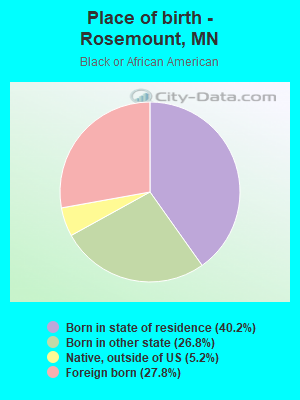
Place of birth - Born in state of residence (%) - Black or African American
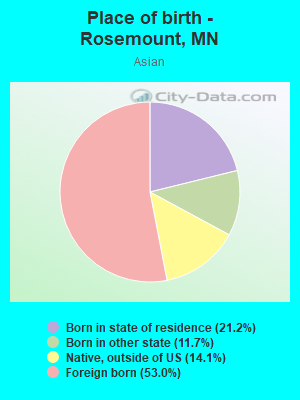
Place of birth - Born in state of residence (%) - Asian
Place of birth - Born in state of residence (%) - Hispanic or Latino
Place of birth - Born in state of residence (%) - American Indian and Alaska Native
Place of birth - Born in state of residence (%) - Multirace
Place of birth - Born in state of residence (%) - Other Race
Place of birth - Born in other state (%)
Place of birth - Born in other state (%) - White
Place of birth - Born in other state (%) - Black or African American
Place of birth - Born in other state (%) - Asian
Place of birth - Born in other state (%) - Hispanic or Latino
Place of birth - Born in other state (%) - American Indian and Alaska Native
Place of birth - Born in other state (%) - Multirace
Place of birth - Born in other state (%) - Other Race
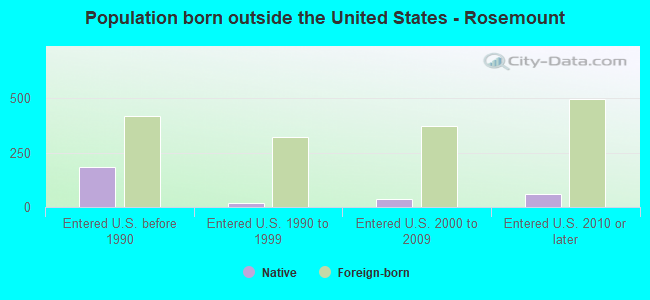
Place of birth - Native, outside of US (%)
Place of birth - Native, outside of US (%) - White
Place of birth - Native, outside of US (%) - Black or African American
Place of birth - Native, outside of US (%) - Asian
Place of birth - Native, outside of US (%) - Hispanic or Latino
Place of birth - Native, outside of US (%) - American Indian and Alaska Native
Place of birth - Native, outside of US (%) - Multirace
Place of birth - Native, outside of US (%) - Other Race
Place of birth - Foreign born (%)
Place of birth - Foreign born (%) - White
Place of birth - Foreign born (%) - Black or African American
Place of birth - Foreign born (%) - Asian
Place of birth - Foreign born (%) - Hispanic or Latino
Place of birth - Foreign born (%) - American Indian and Alaska Native
Place of birth - Foreign born (%) - Multirace
Place of birth - Foreign born (%) - Other Race
Residents speaking English at home (%)
Residents speaking English at home - Born in the United States (%)
Residents speaking English at home - Native, born elsewhere (%)
Residents speaking English at home - Foreign born (%)
Residents speaking Spanish at home (%)
Residents speaking Spanish at home - Born in the United States (%)
Residents speaking Spanish at home - Native, born elsewhere (%)
Residents speaking Spanish at home - Foreign born (%)
Residents speaking other language at home (%)
Residents speaking other language at home - Born in the United States (%)
Residents speaking other language at home - Native, born elsewhere (%)
Residents speaking other language at home - Foreign born (%)
Marital status - Never married (%)
Marital status - Now married (%)
Marital status - Separated (%)
Marital status - Widowed (%)
Marital status - Divorced (%)
Ancestries Reported - Arab (%)
Ancestries Reported - Czech (%)
Ancestries Reported - Danish (%)
Ancestries Reported - Dutch (%)
Ancestries Reported - English (%)
Ancestries Reported - French (%)
Ancestries Reported - French Canadian (%)
Ancestries Reported - German (%)
Ancestries Reported - Greek (%)
Ancestries Reported - Hungarian (%)
Ancestries Reported - Irish (%)
Ancestries Reported - Italian (%)
Ancestries Reported - Lithuanian (%)
Ancestries Reported - Norwegian (%)
Ancestries Reported - Polish (%)
Ancestries Reported - Portuguese (%)
Ancestries Reported - Russian (%)
Ancestries Reported - Scotch-Irish (%)
Ancestries Reported - Scottish (%)
Ancestries Reported - Slovak (%)
Ancestries Reported - Subsaharan African (%)
Ancestries Reported - Swedish (%)
Ancestries Reported - Swiss (%)
Ancestries Reported - Ukrainian (%)
Ancestries Reported - United States (%)
Ancestries Reported - Welsh (%)
Ancestries Reported - West Indian (%)
Ancestries Reported - Other (%)
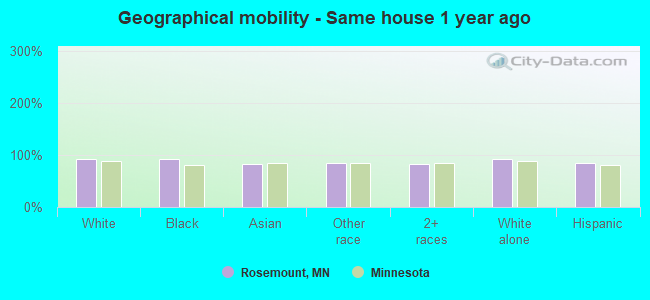
Geographical mobility - Same house 1 year ago (%)
Geographical mobility - Same house 1 year ago (%) - White
Geographical mobility - Same house 1 year ago (%) - Black or African American
Geographical mobility - Same house 1 year ago (%) - Asian
Geographical mobility - Same house 1 year ago (%) - Hispanic or Latino
Geographical mobility - Same house 1 year ago (%) - American Indian and Alaska Native
Geographical mobility - Same house 1 year ago (%) - Multirace
Geographical mobility - Same house 1 year ago (%) - Other Race
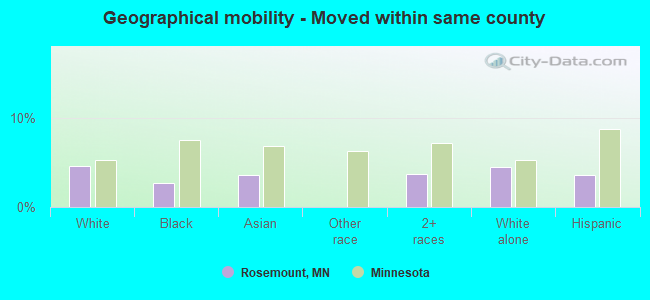
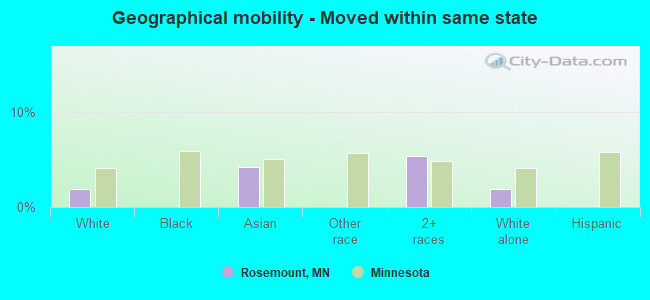
Geographical mobility - Moved within same county (%)
Geographical mobility - Moved within same county (%) - White
Geographical mobility - Moved within same county (%) - Black or African American
Geographical mobility - Moved within same county (%) - Asian
Geographical mobility - Moved within same county (%) - Hispanic or Latino
Geographical mobility - Moved within same county (%) - American Indian and Alaska Native
Geographical mobility - Moved within same county (%) - Multirace
Geographical mobility - Moved within same county (%) - Other Race
Geographical mobility - Moved from different county within same state (%)
Geographical mobility - Moved from different county within same state (%) - White
Geographical mobility - Moved from different county within same state (%) - Black or African American
Geographical mobility - Moved from different county within same state (%) - Asian
Geographical mobility - Moved from different county within same state (%) - Hispanic or Latino
Geographical mobility - Moved from different county within same state (%) - American Indian and Alaska Native
Geographical mobility - Moved from different county within same state (%) - Multirace
Geographical mobility - Moved from different county within same state (%) - Other Race
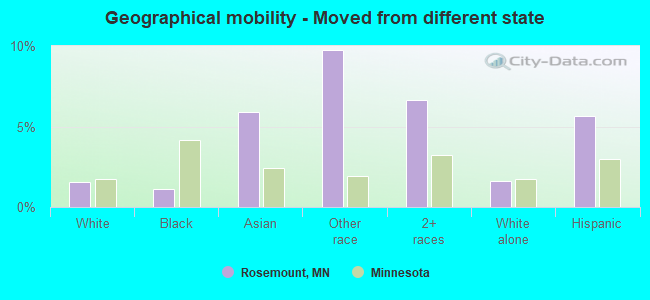
Geographical mobility - Moved from different state (%)
Geographical mobility - Moved from different state (%) - White
Geographical mobility - Moved from different state (%) - Black or African American
Geographical mobility - Moved from different state (%) - Asian
Geographical mobility - Moved from different state (%) - Hispanic or Latino
Geographical mobility - Moved from different state (%) - American Indian and Alaska Native
Geographical mobility - Moved from different state (%) - Multirace
Geographical mobility - Moved from different state (%) - Other Race
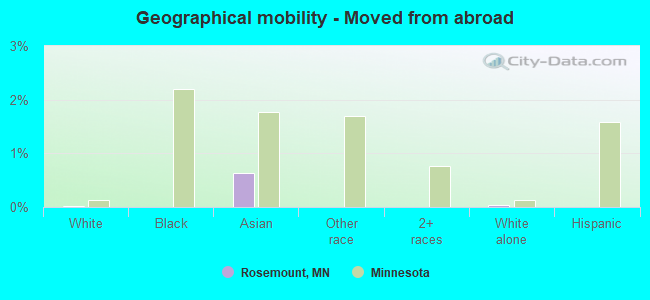
Geographical mobility - Moved from abroad (%)
Geographical mobility - Moved from abroad (%) - White
Geographical mobility - Moved from abroad (%) - Black or African American
Geographical mobility - Moved from abroad (%) - Asian
Geographical mobility - Moved from abroad (%) - Hispanic or Latino
Geographical mobility - Moved from abroad (%) - American Indian and Alaska Native
Geographical mobility - Moved from abroad (%) - Multirace
Geographical mobility - Moved from abroad (%) - Other Race
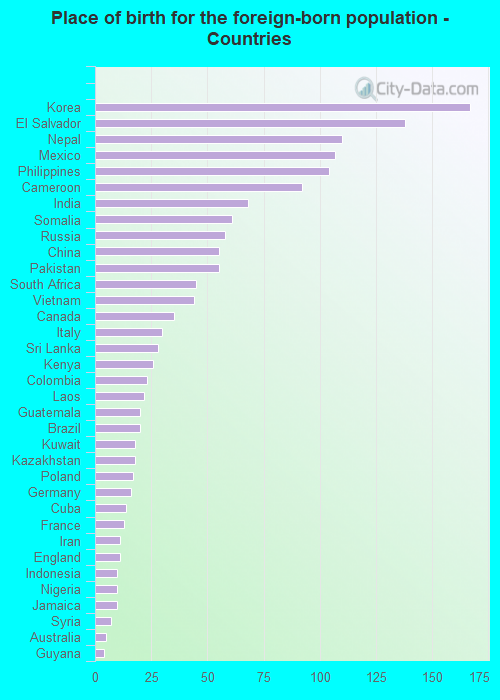
Place of birth for the foreign-born population - Ireland (%)
Place of birth for the foreign-born population - Denmark (%)
Place of birth for the foreign-born population - Norway (%)
Place of birth for the foreign-born population - Sweden (%)
Place of birth for the foreign-born population - United Kingdom (%)
Place of birth for the foreign-born population - England (%)
Place of birth for the foreign-born population - Scotland (%)
Place of birth for the foreign-born population - Other Northern Europe (%)
Place of birth for the foreign-born population - Austria (%)
Place of birth for the foreign-born population - Belgium (%)
Place of birth for the foreign-born population - France (%)
Place of birth for the foreign-born population - Germany (%)
Place of birth for the foreign-born population - Netherlands (%)
Place of birth for the foreign-born population - Switzerland (%)
Place of birth for the foreign-born population - Other Western Europe (%)
Place of birth for the foreign-born population - Greece (%)
Place of birth for the foreign-born population - Italy (%)
Place of birth for the foreign-born population - Portugal (%)
Place of birth for the foreign-born population - Spain (%)
Place of birth for the foreign-born population - Other Southern Europe (%)
Place of birth for the foreign-born population - Albania (%)
Place of birth for the foreign-born population - Belarus (%)
Place of birth for the foreign-born population - Bosnia and Herzegovina (%)
Place of birth for the foreign-born population - Bulgaria (%)
Place of birth for the foreign-born population - Croatia (%)
Place of birth for the foreign-born population - Czechoslovakia (%)
Place of birth for the foreign-born population - Hungary (%)
Place of birth for the foreign-born population - Latvia (%)
Place of birth for the foreign-born population - Lithuania (%)
Place of birth for the foreign-born population - North Macedonia (Macedonia) (%)
Place of birth for the foreign-born population - Moldova (%)
Place of birth for the foreign-born population - Poland (%)
Place of birth for the foreign-born population - Romania (%)
Place of birth for the foreign-born population - Russia (%)
Place of birth for the foreign-born population - Serbia (%)
Place of birth for the foreign-born population - Ukraine (%)
Place of birth for the foreign-born population - Other Eastern Europe (%)
Place of birth for the foreign-born population - China (%)
Place of birth for the foreign-born population - Hong Kong (%)
Place of birth for the foreign-born population - Taiwan (%)
Place of birth for the foreign-born population - Japan (%)
Place of birth for the foreign-born population - Korea (%)
Place of birth for the foreign-born population - Other Eastern Asia (%)
Place of birth for the foreign-born population - Afghanistan (%)
Place of birth for the foreign-born population - Bangladesh (%)
Place of birth for the foreign-born population - India (%)
Place of birth for the foreign-born population - Iran (%)
Place of birth for the foreign-born population - Kazakhstan (%)
Place of birth for the foreign-born population - Nepal (%)
Place of birth for the foreign-born population - Pakistan (%)
Place of birth for the foreign-born population - Sri Lanka (%)
Place of birth for the foreign-born population - Uzbekistan (%)
Place of birth for the foreign-born population - Other South Central Asia (%)
Place of birth for the foreign-born population - Burma (%)
Place of birth for the foreign-born population - Cambodia (%)
Place of birth for the foreign-born population - Indonesia (%)
Place of birth for the foreign-born population - Laos (%)
Place of birth for the foreign-born population - Malaysia (%)
Place of birth for the foreign-born population - Philippines (%)
Place of birth for the foreign-born population - Singapore (%)
Place of birth for the foreign-born population - Thailand (%)
Place of birth for the foreign-born population - Vietnam (%)
Place of birth for the foreign-born population - Other South Eastern Asia (%)
Place of birth for the foreign-born population - Armenia (%)
Place of birth for the foreign-born population - Iraq (%)
Place of birth for the foreign-born population - Israel (%)
Place of birth for the foreign-born population - Jordan (%)
Place of birth for the foreign-born population - Kuwait (%)
Place of birth for the foreign-born population - Lebanon (%)
Place of birth for the foreign-born population - Saudi Arabia (%)
Place of birth for the foreign-born population - Syria (%)
Place of birth for the foreign-born population - Turkey (%)
Place of birth for the foreign-born population - Yemen (%)
Place of birth for the foreign-born population - Other Western Asia (%)
Place of birth for the foreign-born population - Eritrea (%)
Place of birth for the foreign-born population - Ethiopia (%)
Place of birth for the foreign-born population - Kenya (%)
Place of birth for the foreign-born population - Somalia (%)
Place of birth for the foreign-born population - Uganda (%)
Place of birth for the foreign-born population - Zimbabwe (%)
Place of birth for the foreign-born population - Other Eastern Africa (%)
Place of birth for the foreign-born population - Cameroon (%)
Place of birth for the foreign-born population - Congo (%)
Place of birth for the foreign-born population - Democratic Republic of Congo (Zaire) (%)
Place of birth for the foreign-born population - Other Middle Africa (%)
Place of birth for the foreign-born population - Egypt (%)
Place of birth for the foreign-born population - Morocco (%)
Place of birth for the foreign-born population - Sudan (%)
Place of birth for the foreign-born population - Other Northern Africa (%)
Place of birth for the foreign-born population - South Africa (%)
Place of birth for the foreign-born population - Other Southern Africa (%)
Place of birth for the foreign-born population - Cabo Verde (%)
Place of birth for the foreign-born population - Ghana (%)
Place of birth for the foreign-born population - Liberia (%)
Place of birth for the foreign-born population - Nigeria (%)
Place of birth for the foreign-born population - Senegal (%)
Place of birth for the foreign-born population - Sierra Leone (%)
Place of birth for the foreign-born population - Other Western Africa (%)
Place of birth for the foreign-born population - Australia (%)
Place of birth for the foreign-born population - New Zealand (%)
Place of birth for the foreign-born population - Fiji (%)
Place of birth for the foreign-born population - Micronesia (%)
Place of birth for the foreign-born population - Bahamas (%)
Place of birth for the foreign-born population - Barbados (%)
Place of birth for the foreign-born population - Cuba (%)
Place of birth for the foreign-born population - Dominica (%)
Place of birth for the foreign-born population - Dominican Republic (%)
Place of birth for the foreign-born population - Grenada (%)
Place of birth for the foreign-born population - Haiti (%)
Place of birth for the foreign-born population - Jamaica (%)
Place of birth for the foreign-born population - St. Vincent and the Grenadines (%)
Place of birth for the foreign-born population - Trinidad and Tobago (%)
Place of birth for the foreign-born population - West Indies (%)
Place of birth for the foreign-born population - Other Caribbean (%)
Place of birth for the foreign-born population - Belize (%)
Place of birth for the foreign-born population - Costa Rica (%)
Place of birth for the foreign-born population - El Salvador (%)
Place of birth for the foreign-born population - Guatemala (%)
Place of birth for the foreign-born population - Honduras (%)
Place of birth for the foreign-born population - Mexico (%)
Place of birth for the foreign-born population - Nicaragua (%)
Place of birth for the foreign-born population - Panama (%)
Place of birth for the foreign-born population - Other Central America (%)
Place of birth for the foreign-born population - Argentina (%)
Place of birth for the foreign-born population - Bolivia (%)
Place of birth for the foreign-born population - Brazil (%)
Place of birth for the foreign-born population - Chile (%)
Place of birth for the foreign-born population - Colombia (%)
Place of birth for the foreign-born population - Ecuador (%)
Place of birth for the foreign-born population - Guyana (%)
Place of birth for the foreign-born population - Peru (%)
Place of birth for the foreign-born population - Uruguay (%)
Place of birth for the foreign-born population - Venezuela (%)
Place of birth for the foreign-born population - Other South America (%)
Place of birth for the foreign-born population - Canada (%)
Place of birth for the foreign-born population - Other Northern America (%)
Place of birth for the foreign-born population - Other (%)
Latest news about races in Rosemount, MN collected exclusively by city-data.com from local newspapers, TV, and radio stations
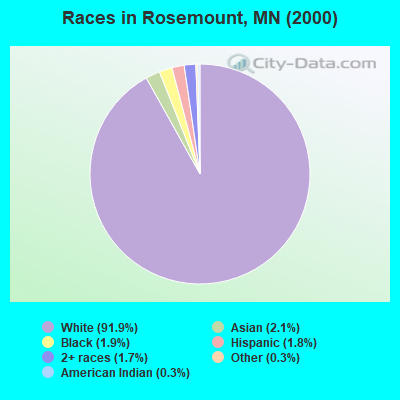
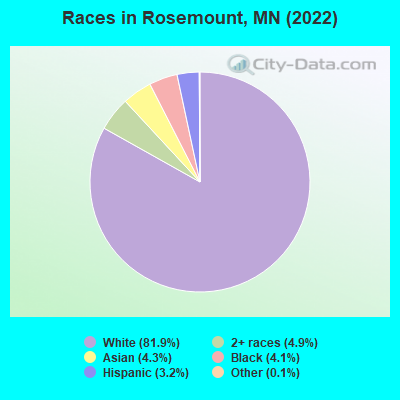
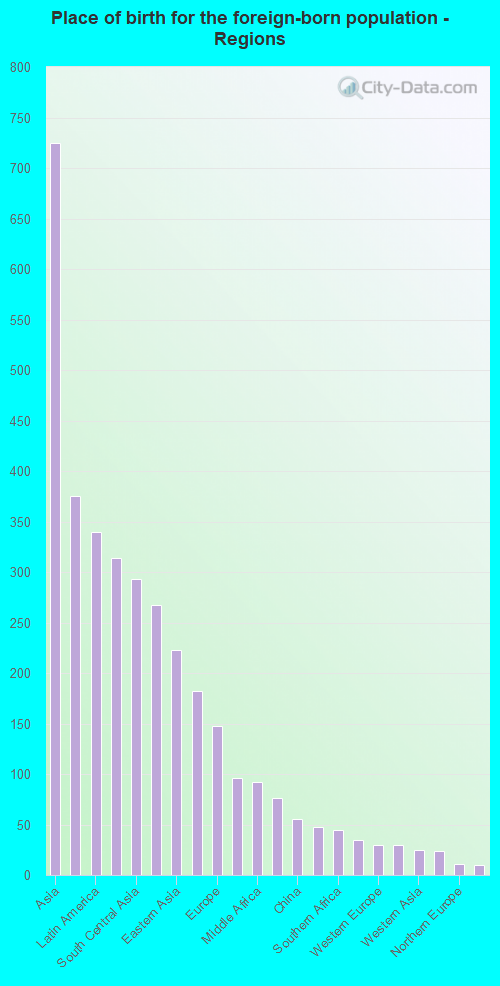
According to 2022 data, the most numerous races in Rosemount, MN are White alone (21,502 residents), Black alone (1,087 residents), and Hispanic (842 residents). 92.6% of Rosemount residents speak English at home. 6.0% of Rosemount, MN residents are foreign-born (2.7% born in Asia, 1.3% born in Latin America, 1.2% born in Africa), which is 33.8% less than the foreign-born rate of 8.0% across the entire state of Minnesota.
Race distribution in Rosemount
2000 2022
4,337,143 88.2% White alone 168,813 3.4% Black alone 143,382 2.9% Hispanic 141,083 2.9% Asian alone 70,304 1.4% Two or more races 52,009 1.1% American Indian alone 5,031 0.1% Other race alone 1,714 0.03% Native Hawaiian and Other
4,356,347 76.2% White alone 395,179 6.9% Black alone 333,830 5.8% Hispanic 294,800 5.2% Asian alone 259,649 4.5% Two or more races 42,125 0.7% American Indian alone 32,976 0.6% Other race alone 2,278 0.04% Native Hawaiian and Other
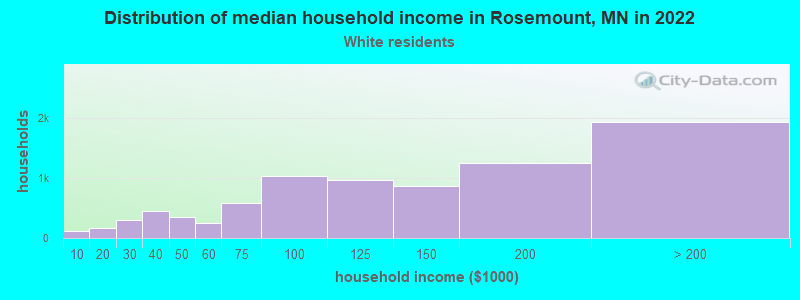
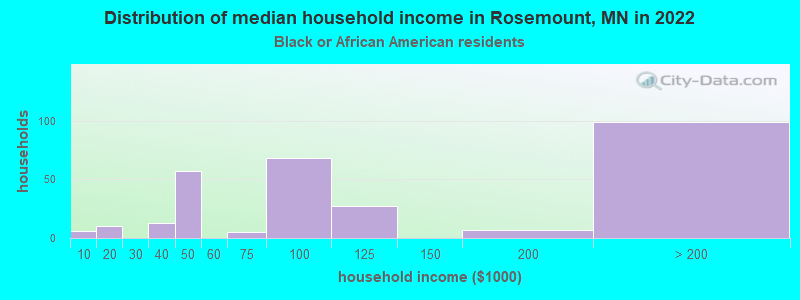
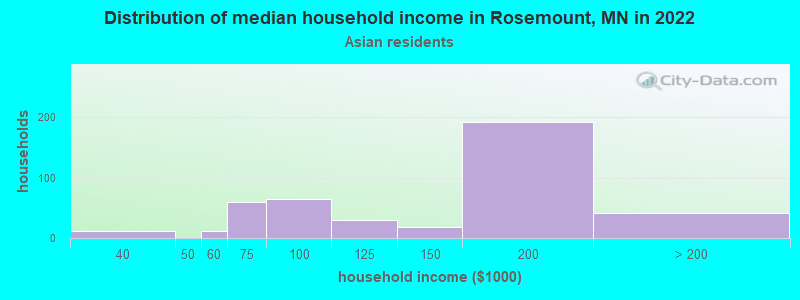
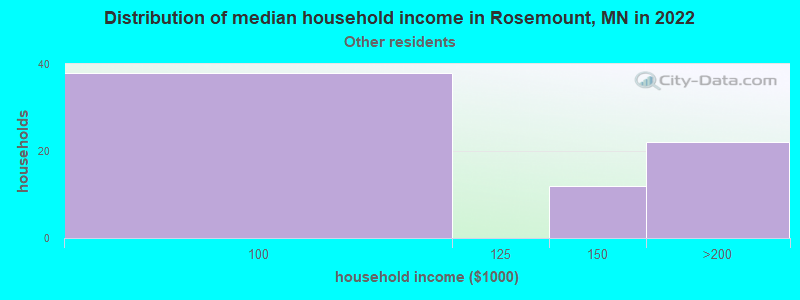
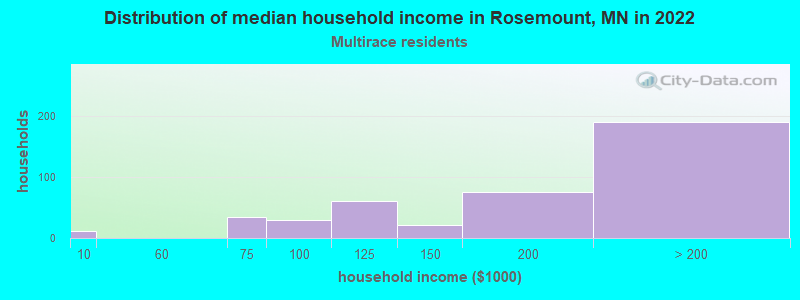
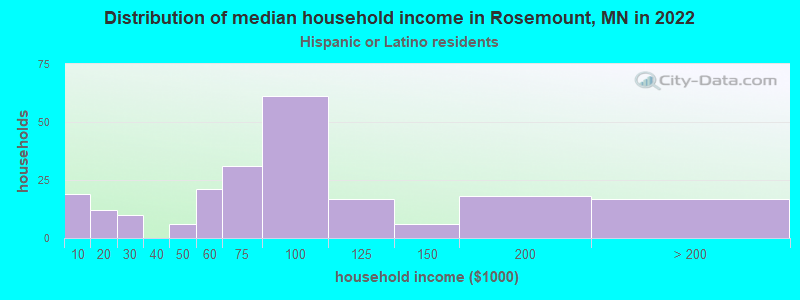
Income and house value in Rosemount Median household income in 2022 $123,537 White non-Hispanic householders$142,875 Asian householders$176,937 Two or more races householders$73,493 Hispanic or Latino race householdersMedian 2022 house value $406,653 White Non-Hispanic householders$433,267 Black or African American householders$540,519 Hispanic or Latino householders
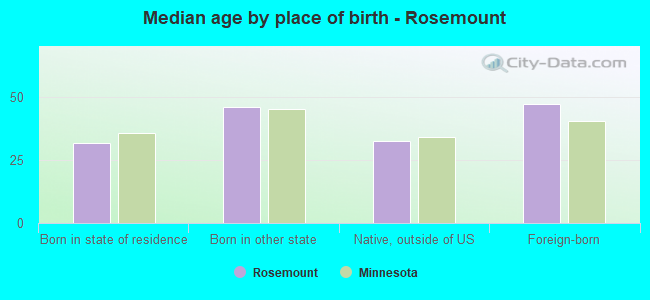
Median age by race in Rosemount
40.4 Median age for White residents40.1 40.7 28.9 Median age for Black or African American residents16.1 39.4 -650,847,457.0 Median age for American Indian / Alaska Native residents-664,429,529.5 -649,253,730.7 37.6 Median age for Asian residents26.0 42.9 -744,336,568.8 Median age for Native Hawaiian / Pacific Islander residents-856,799,036.4 -534,959,349.1 47.5 Median age for Other race residents53.7 48.6 20.8 Median age for Two or more races residents17.8 27.4 40.1 Median age for White alone residents39.8 40.5 38.2 Median age for Hispanic or Latino residents23.4 40.4
Owner/renter occupied households by race in Rosemount
House owners and renters - White residents 6,956 85.0% Owner occupied1,223 15.0% Renter occupiedHouse owners and renters - Black or African American residents 215 80.4% Owner occupied53 19.6% Renter occupiedHouse owners and renters - Asian residents 377 92.6% Owner occupied30 7.4% Renter occupiedHouse owners and renters - Other race residents 70 92.1% Owner occupied6 7.9% Renter occupiedHouse owners and renters - Two or more races residents 371 87.7% Owner occupied52 12.3% Renter occupiedHouse owners and renters - White alone residents 6,981 85.6% Owner occupied1,173 14.4% Renter occupiedHouse owners and renters - Hispanic or Latino residents 140 63.0% Owner occupied82 37.0% Renter occupied
Language usage in Rosemount
English speakers - Total 92.6% of residents of Rosemount speak English at home.
2.2% of residents speak Spanish at home 188 35.4% Speak English very well343 64.6% Speak English less than very well5.1% of residents speak other language at home 968 76.8% Speak English very well292 23.2% Speak English less than very well
English speakers - Born in the United States 98.2% of residents of Rosemount speak English at home.
1.0% of residents speak Spanish at home 57 90.5% Speak English very well6 9.5% Speak English less than very well0.8% of residents speak other language at home 50 100.0% Speak English very well
English speakers - Native, born elsewhere 61.5% of residents of Rosemount speak English at home.
4.5% of residents speak Spanish at home 14 100.0% Speak English very well40.8% of residents speak other language at home 126 100.0% Speak English very well
English speakers - Foreign-born 21.5% of residents of Rosemount speak English at home.
26.2% of residents speak Spanish at home 72 17.1% Speak English very well348 82.9% Speak English less than very well53.3% of residents speak other language at home 581 68.0% Speak English very well273 32.0% Speak English less than very well
White (Caucasian) - Speak only English Native:
99.8% (19,925)Foreign-born:
38.9% (85)
White (Caucasian) - Speak another language Native:
0.6% (128)Foreign-born:
59.6% (130)
Black or African American - Speak only English Native:
89.7% (639)Foreign-born:
27.5% (83)
Black or African American - Speak another language Native:
6.1% (44)Foreign-born:
72.0% (218)
Asian - Speak only English Native:
49.7% (229)Foreign-born:
21.9% (133)
Asian - Speak another language Native:
46.3% (213)Foreign-born:
78.1% (473)
Other race - Speak only English Native:
9.5% (7)Foreign-born:
10.6% (38)
Other race - Speak another language Native:
95.9% (72)Foreign-born:
88.9% (318)
Two or more races - Speak another language Native:
0.5% (7)Foreign-born:
100.0% (85)
White alone - Speak only English Native:
99.5% (19,945)Foreign-born:
43.0% (92)
White alone - Speak another language Native:
0.6% (129)Foreign-born:
56.3% (120)
Hispanic or Latino - Speak only English Native:
75.1% (278)Foreign-born:
4.5% (19)
Hispanic or Latino - Speak another language Native:
24.3% (90)Foreign-born:
97.0% (403)
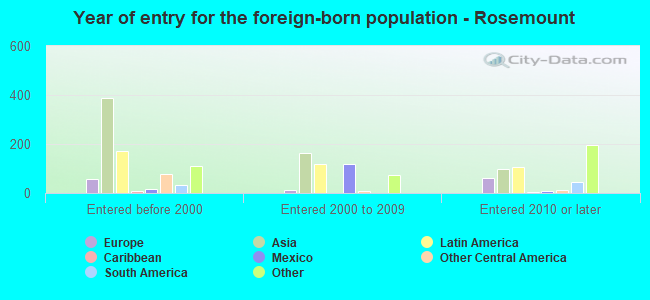
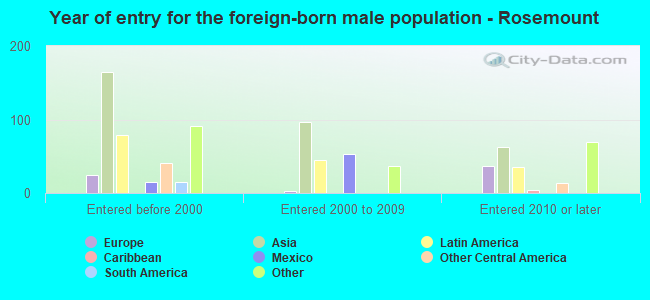
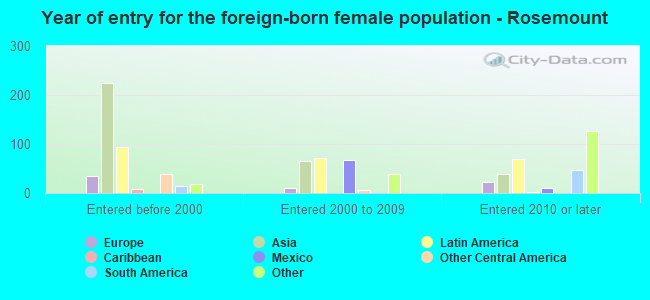
Foreign-born residents in Rosemount 1,569 residents are foreign born (2.7% Asia , 1.3% Latin America , 1.2% Africa ).
This city:
6.0%Minnesota:
8.5%
Marital status for residents in Rosemount Marital status - White (Caucasian) population 15 years and over
Males 25.2% Never married65.2% Now married0.4% Separated2.1% Widowed7.1% DivorcedFemales 22.5% Never married63.0% Now married0.0% Separated4.1% Widowed10.4% DivorcedWomen who gave birth in the past 12 months Now married:
88.5% (266)Unmarried:
11.5% (35)
Women who did not give birth in the past 12 months Now married:
54.7% (2,472)Unmarried:
45.3% (2,046)
Marital status - Black or African American population 15 years and over
Males 47.1% Never married48.8% Now married0.0% Separated0.0% Widowed4.1% DivorcedFemales 2.4% Never married89.0% Now married0.0% Separated0.0% Widowed8.6% DivorcedWomen who gave birth in the past 12 months Now married:
100.0% (36)Unmarried:
0.0% (0)
Women who did not give birth in the past 12 months Now married:
100.0% (161)Unmarried:
0.0% (0)
Marital status - Asian population 15 years and over
Males 28.5% Never married61.4% Now married8.7% Separated0.0% Widowed1.3% DivorcedFemales 27.0% Never married60.4% Now married0.0% Separated7.3% Widowed5.3% DivorcedWomen who did not give birth in the past 12 months Now married:
57.0% (227)Unmarried:
43.0% (171)
Marital status - Other race population 15 years and over
Males 32.1% Never married63.6% Now married0.0% Separated0.0% Widowed4.3% DivorcedFemales 47.1% Never married52.9% Now married0.0% Separated0.0% Widowed0.0% DivorcedWomen who did not give birth in the past 12 months Now married:
83.1% (108)Unmarried:
16.9% (22)
Marital status - Two or more races population 15 years and over
Males 58.1% Never married41.9% Now married0.0% Separated0.0% Widowed0.0% DivorcedFemales 44.1% Never married47.5% Now married0.0% Separated1.5% Widowed6.9% DivorcedWomen who gave birth in the past 12 months Now married:
13.6% (4)Unmarried:
86.4% (24)
Women who did not give birth in the past 12 months Now married:
43.1% (187)Unmarried:
56.9% (248)
Marital status - White alone, not Hispanic / Latino population 15 years and over
Males 25.2% Never married65.4% Now married0.4% Separated2.1% Widowed6.8% DivorcedFemales 22.2% Never married63.3% Now married0.0% Separated4.2% Widowed10.3% DivorcedWomen who gave birth in the past 12 months Now married:
88.5% (274)Unmarried:
11.5% (36)
Women who did not give birth in the past 12 months Now married:
55.2% (2,504)Unmarried:
44.8% (2,031)
Marital status - Hispanic or Latino population 15 years and over
Males 29.1% Never married55.9% Now married0.0% Separated0.0% Widowed15.0% DivorcedFemales 35.2% Never married51.8% Now married0.0% Separated0.0% Widowed13.0% DivorcedWomen who gave birth in the past 12 months Now married:
0.0% (0)Unmarried:
100.0% (12)
Women who did not give birth in the past 12 months Now married:
65.5% (178)Unmarried:
34.5% (94)
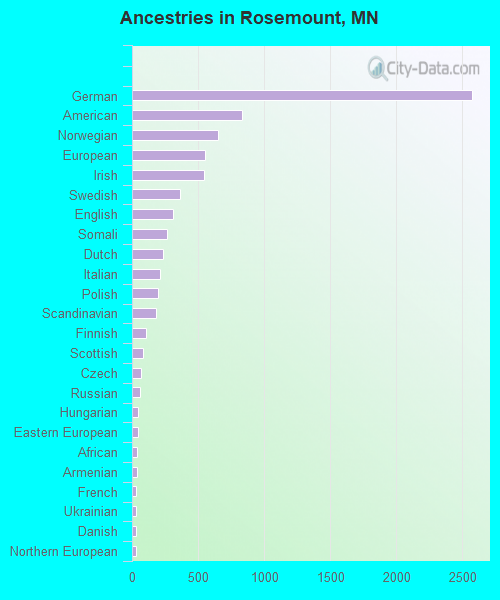
Ancestries in Rosemount
2,573 25.4% German829 8.2% American652 6.4% Norwegian555 5.5% European542 5.3% Irish365 3.6% Swedish310 3.1% English264 2.6% Somali233 2.3% Dutch209 2.1% Italian199 2.0% Polish182 1.8% Scandinavian105 1.0% Finnish81 0.8% Scottish65 0.6% Czech62 0.6% Russian46 0.5% Hungarian42 0.4% Eastern European41 0.4% African35 0.3% Armenian34 0.3% French34 0.3% Ukrainian28 0.3% Danish27 0.3% Northern European21 0.2% British20 0.2% Brazilian19 0.2% Palestinian17 0.2% Jamaican17 0.2% Welsh15 0.1% Iranian14 0.1% Scotch-Irish14 0.1% Nigerian14 0.1% Czechoslovakian13 0.1% Kenyan11 0.1% Canadian10 0.10% Slavic9 0.09% Greek7 0.07% Slovak7 0.07% Australian5 0.05% Belgian4 0.04% Slovene4 0.04% Austrian
Children Nativity (place of birth) in Rosemount
Children under 6 years - Living with two parents Both parents native 1,662 100.0% NativeBoth parents foreign-born 221 95.8% Native10 4.2% Foreign-bornOne native, one foreign-born parent 74 100.0% NativeChildren under 6 years - Living with one parent Native parent 116 100.0% NativeChildren 6 to 17 years - Living with two parents Both parents native 3,521 100.0% NativeBoth parents foreign-born 238 80.0% Native59 20.0% Foreign-bornOne native, one foreign-born parent 125 100.0% NativeChildren 6 to 17 years - Living with one parent Native parent 770 95.3% Native38 4.7% Foreign-bornForeign-born parent 58 63.1% Native34 36.9% Foreign-born
Grandparents responsible for own grandchildren in Rosemount
Grandparents (30 to 59 years) White / Caucasian 22 100.0% Not responsible for grandchildrenBlack or African American 6 10.3% Responsible for grandchildren51 89.7% Not responsible for grandchildrenWhite alone, not Hispanic / Latino 24 100.0% Not responsible for grandchildren
Grandparents (60 years and over) White / Caucasian 37 100.0% Not responsible for grandchildrenWhite alone, not Hispanic / Latino 38 100.0% Not responsible for grandchildren