Races in Rosenberg, Texas (TX) Detailed Stats
Data:
Races - White alone (%)
Races - White alone (% change since 2000)
Races - Black alone (%)
Races - Black alone (% change since 2000)
Races - American Indian alone (%)
Races - American Indian alone (% change since 2000)
Races - Asian alone (%)
Races - Asian alone (% change since 2000)
Races - Hispanic (%)
Races - Hispanic (% change since 2000)
Races - Native Hawaiian and Other Pacific Islander alone (%)
Races - Native Hawaiian and Other Pacific Islander alone (% change since 2000)
Races - Two or more races(%)
Races - Two or more races(% change since 2000)
Races - Other race alone (%)
Races - Other race alone (% change since 2000)
Racial diversity
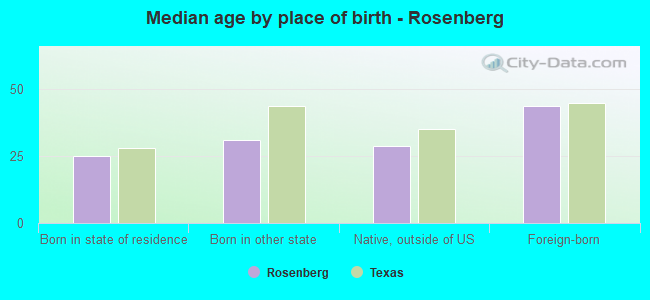
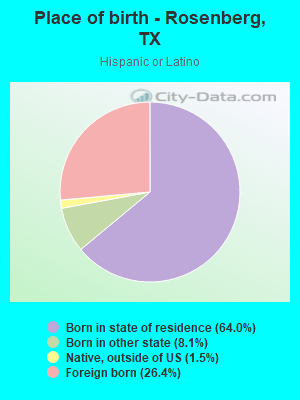
Place of birth - Born in state of residence (%)
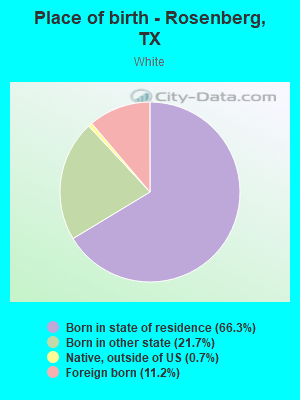
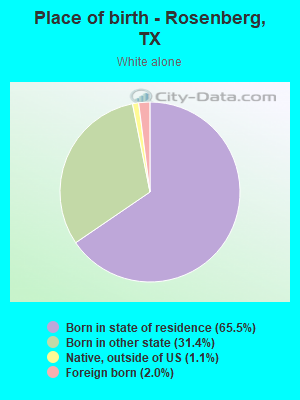
Place of birth - Born in state of residence (%) - White
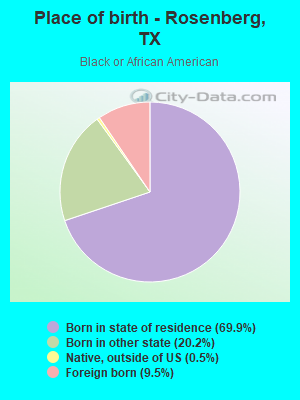
Place of birth - Born in state of residence (%) - Black or African American
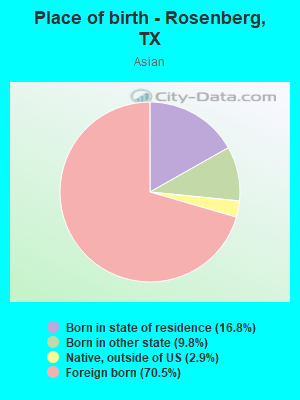
Place of birth - Born in state of residence (%) - Asian
Place of birth - Born in state of residence (%) - Hispanic or Latino
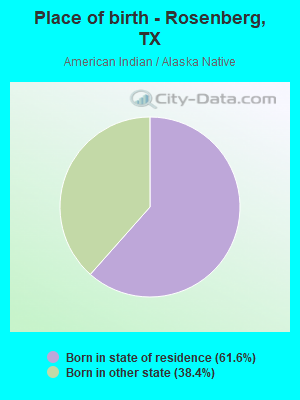
Place of birth - Born in state of residence (%) - American Indian and Alaska Native
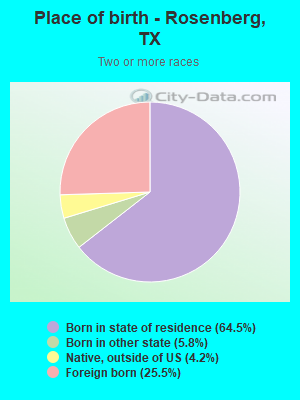
Place of birth - Born in state of residence (%) - Multirace
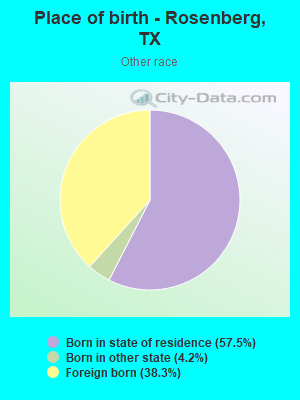
Place of birth - Born in state of residence (%) - Other Race
Place of birth - Born in other state (%)
Place of birth - Born in other state (%) - White
Place of birth - Born in other state (%) - Black or African American
Place of birth - Born in other state (%) - Asian
Place of birth - Born in other state (%) - Hispanic or Latino
Place of birth - Born in other state (%) - American Indian and Alaska Native
Place of birth - Born in other state (%) - Multirace
Place of birth - Born in other state (%) - Other Race
Place of birth - Native, outside of US (%)
Place of birth - Native, outside of US (%) - White
Place of birth - Native, outside of US (%) - Black or African American
Place of birth - Native, outside of US (%) - Asian
Place of birth - Native, outside of US (%) - Hispanic or Latino
Place of birth - Native, outside of US (%) - American Indian and Alaska Native
Place of birth - Native, outside of US (%) - Multirace
Place of birth - Native, outside of US (%) - Other Race
Place of birth - Foreign born (%)
Place of birth - Foreign born (%) - White
Place of birth - Foreign born (%) - Black or African American
Place of birth - Foreign born (%) - Asian
Place of birth - Foreign born (%) - Hispanic or Latino
Place of birth - Foreign born (%) - American Indian and Alaska Native
Place of birth - Foreign born (%) - Multirace
Place of birth - Foreign born (%) - Other Race
Residents speaking English at home (%)
Residents speaking English at home - Born in the United States (%)
Residents speaking English at home - Native, born elsewhere (%)
Residents speaking English at home - Foreign born (%)
Residents speaking Spanish at home (%)
Residents speaking Spanish at home - Born in the United States (%)
Residents speaking Spanish at home - Native, born elsewhere (%)
Residents speaking Spanish at home - Foreign born (%)
Residents speaking other language at home (%)
Residents speaking other language at home - Born in the United States (%)
Residents speaking other language at home - Native, born elsewhere (%)
Residents speaking other language at home - Foreign born (%)
Marital status - Never married (%)
Marital status - Now married (%)
Marital status - Separated (%)
Marital status - Widowed (%)
Marital status - Divorced (%)
Ancestries Reported - Arab (%)
Ancestries Reported - Czech (%)
Ancestries Reported - Danish (%)
Ancestries Reported - Dutch (%)
Ancestries Reported - English (%)
Ancestries Reported - French (%)
Ancestries Reported - French Canadian (%)
Ancestries Reported - German (%)
Ancestries Reported - Greek (%)
Ancestries Reported - Hungarian (%)
Ancestries Reported - Irish (%)
Ancestries Reported - Italian (%)
Ancestries Reported - Lithuanian (%)
Ancestries Reported - Norwegian (%)
Ancestries Reported - Polish (%)
Ancestries Reported - Portuguese (%)
Ancestries Reported - Russian (%)
Ancestries Reported - Scotch-Irish (%)
Ancestries Reported - Scottish (%)
Ancestries Reported - Slovak (%)
Ancestries Reported - Subsaharan African (%)
Ancestries Reported - Swedish (%)
Ancestries Reported - Swiss (%)
Ancestries Reported - Ukrainian (%)
Ancestries Reported - United States (%)
Ancestries Reported - Welsh (%)
Ancestries Reported - West Indian (%)
Ancestries Reported - Other (%)
Geographical mobility - Same house 1 year ago (%)
Geographical mobility - Same house 1 year ago (%) - White
Geographical mobility - Same house 1 year ago (%) - Black or African American
Geographical mobility - Same house 1 year ago (%) - Asian
Geographical mobility - Same house 1 year ago (%) - Hispanic or Latino
Geographical mobility - Same house 1 year ago (%) - American Indian and Alaska Native
Geographical mobility - Same house 1 year ago (%) - Multirace
Geographical mobility - Same house 1 year ago (%) - Other Race
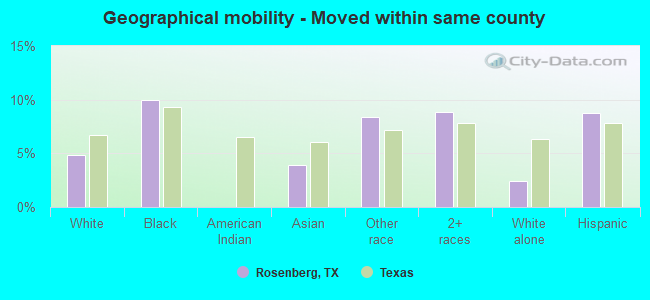
Geographical mobility - Moved within same county (%)
Geographical mobility - Moved within same county (%) - White
Geographical mobility - Moved within same county (%) - Black or African American
Geographical mobility - Moved within same county (%) - Asian
Geographical mobility - Moved within same county (%) - Hispanic or Latino
Geographical mobility - Moved within same county (%) - American Indian and Alaska Native
Geographical mobility - Moved within same county (%) - Multirace
Geographical mobility - Moved within same county (%) - Other Race
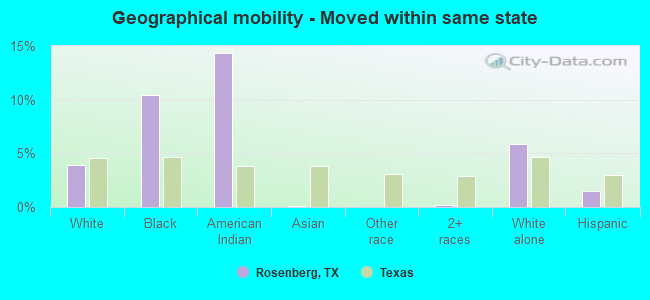
Geographical mobility - Moved from different county within same state (%)
Geographical mobility - Moved from different county within same state (%) - White
Geographical mobility - Moved from different county within same state (%) - Black or African American
Geographical mobility - Moved from different county within same state (%) - Asian
Geographical mobility - Moved from different county within same state (%) - Hispanic or Latino
Geographical mobility - Moved from different county within same state (%) - American Indian and Alaska Native
Geographical mobility - Moved from different county within same state (%) - Multirace
Geographical mobility - Moved from different county within same state (%) - Other Race
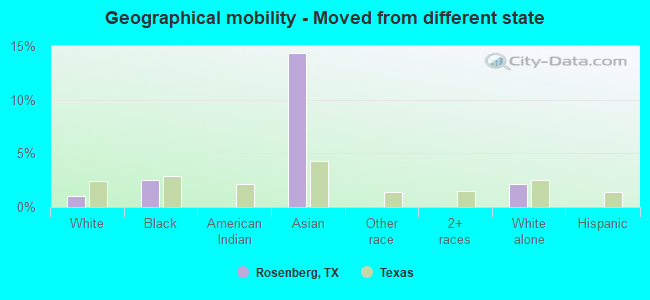
Geographical mobility - Moved from different state (%)
Geographical mobility - Moved from different state (%) - White
Geographical mobility - Moved from different state (%) - Black or African American
Geographical mobility - Moved from different state (%) - Asian
Geographical mobility - Moved from different state (%) - Hispanic or Latino
Geographical mobility - Moved from different state (%) - American Indian and Alaska Native
Geographical mobility - Moved from different state (%) - Multirace
Geographical mobility - Moved from different state (%) - Other Race
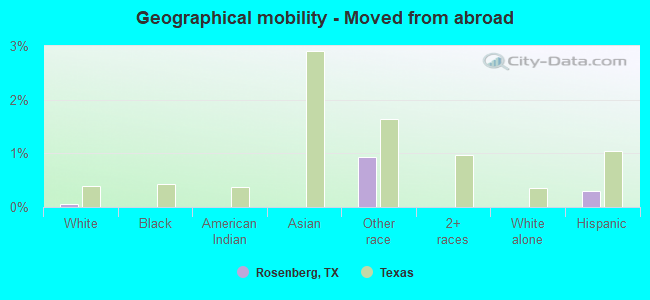
Geographical mobility - Moved from abroad (%)
Geographical mobility - Moved from abroad (%) - White
Geographical mobility - Moved from abroad (%) - Black or African American
Geographical mobility - Moved from abroad (%) - Asian
Geographical mobility - Moved from abroad (%) - Hispanic or Latino
Geographical mobility - Moved from abroad (%) - American Indian and Alaska Native
Geographical mobility - Moved from abroad (%) - Multirace
Geographical mobility - Moved from abroad (%) - Other Race
Place of birth for the foreign-born population - Ireland (%)
Place of birth for the foreign-born population - Denmark (%)
Place of birth for the foreign-born population - Norway (%)
Place of birth for the foreign-born population - Sweden (%)
Place of birth for the foreign-born population - United Kingdom (%)
Place of birth for the foreign-born population - England (%)
Place of birth for the foreign-born population - Scotland (%)
Place of birth for the foreign-born population - Other Northern Europe (%)
Place of birth for the foreign-born population - Austria (%)
Place of birth for the foreign-born population - Belgium (%)
Place of birth for the foreign-born population - France (%)
Place of birth for the foreign-born population - Germany (%)
Place of birth for the foreign-born population - Netherlands (%)
Place of birth for the foreign-born population - Switzerland (%)
Place of birth for the foreign-born population - Other Western Europe (%)
Place of birth for the foreign-born population - Greece (%)
Place of birth for the foreign-born population - Italy (%)
Place of birth for the foreign-born population - Portugal (%)
Place of birth for the foreign-born population - Spain (%)
Place of birth for the foreign-born population - Other Southern Europe (%)
Place of birth for the foreign-born population - Albania (%)
Place of birth for the foreign-born population - Belarus (%)
Place of birth for the foreign-born population - Bosnia and Herzegovina (%)
Place of birth for the foreign-born population - Bulgaria (%)
Place of birth for the foreign-born population - Croatia (%)
Place of birth for the foreign-born population - Czechoslovakia (%)
Place of birth for the foreign-born population - Hungary (%)
Place of birth for the foreign-born population - Latvia (%)
Place of birth for the foreign-born population - Lithuania (%)
Place of birth for the foreign-born population - North Macedonia (Macedonia) (%)
Place of birth for the foreign-born population - Moldova (%)
Place of birth for the foreign-born population - Poland (%)
Place of birth for the foreign-born population - Romania (%)
Place of birth for the foreign-born population - Russia (%)
Place of birth for the foreign-born population - Serbia (%)
Place of birth for the foreign-born population - Ukraine (%)
Place of birth for the foreign-born population - Other Eastern Europe (%)
Place of birth for the foreign-born population - China (%)
Place of birth for the foreign-born population - Hong Kong (%)
Place of birth for the foreign-born population - Taiwan (%)
Place of birth for the foreign-born population - Japan (%)
Place of birth for the foreign-born population - Korea (%)
Place of birth for the foreign-born population - Other Eastern Asia (%)
Place of birth for the foreign-born population - Afghanistan (%)
Place of birth for the foreign-born population - Bangladesh (%)
Place of birth for the foreign-born population - India (%)
Place of birth for the foreign-born population - Iran (%)
Place of birth for the foreign-born population - Kazakhstan (%)
Place of birth for the foreign-born population - Nepal (%)
Place of birth for the foreign-born population - Pakistan (%)
Place of birth for the foreign-born population - Sri Lanka (%)
Place of birth for the foreign-born population - Uzbekistan (%)
Place of birth for the foreign-born population - Other South Central Asia (%)
Place of birth for the foreign-born population - Burma (%)
Place of birth for the foreign-born population - Cambodia (%)
Place of birth for the foreign-born population - Indonesia (%)
Place of birth for the foreign-born population - Laos (%)
Place of birth for the foreign-born population - Malaysia (%)
Place of birth for the foreign-born population - Philippines (%)
Place of birth for the foreign-born population - Singapore (%)
Place of birth for the foreign-born population - Thailand (%)
Place of birth for the foreign-born population - Vietnam (%)
Place of birth for the foreign-born population - Other South Eastern Asia (%)
Place of birth for the foreign-born population - Armenia (%)
Place of birth for the foreign-born population - Iraq (%)
Place of birth for the foreign-born population - Israel (%)
Place of birth for the foreign-born population - Jordan (%)
Place of birth for the foreign-born population - Kuwait (%)
Place of birth for the foreign-born population - Lebanon (%)
Place of birth for the foreign-born population - Saudi Arabia (%)
Place of birth for the foreign-born population - Syria (%)
Place of birth for the foreign-born population - Turkey (%)
Place of birth for the foreign-born population - Yemen (%)
Place of birth for the foreign-born population - Other Western Asia (%)
Place of birth for the foreign-born population - Eritrea (%)
Place of birth for the foreign-born population - Ethiopia (%)
Place of birth for the foreign-born population - Kenya (%)
Place of birth for the foreign-born population - Somalia (%)
Place of birth for the foreign-born population - Uganda (%)
Place of birth for the foreign-born population - Zimbabwe (%)
Place of birth for the foreign-born population - Other Eastern Africa (%)
Place of birth for the foreign-born population - Cameroon (%)
Place of birth for the foreign-born population - Congo (%)
Place of birth for the foreign-born population - Democratic Republic of Congo (Zaire) (%)
Place of birth for the foreign-born population - Other Middle Africa (%)
Place of birth for the foreign-born population - Egypt (%)
Place of birth for the foreign-born population - Morocco (%)
Place of birth for the foreign-born population - Sudan (%)
Place of birth for the foreign-born population - Other Northern Africa (%)
Place of birth for the foreign-born population - South Africa (%)
Place of birth for the foreign-born population - Other Southern Africa (%)
Place of birth for the foreign-born population - Cabo Verde (%)
Place of birth for the foreign-born population - Ghana (%)
Place of birth for the foreign-born population - Liberia (%)
Place of birth for the foreign-born population - Nigeria (%)
Place of birth for the foreign-born population - Senegal (%)
Place of birth for the foreign-born population - Sierra Leone (%)
Place of birth for the foreign-born population - Other Western Africa (%)
Place of birth for the foreign-born population - Australia (%)
Place of birth for the foreign-born population - New Zealand (%)
Place of birth for the foreign-born population - Fiji (%)
Place of birth for the foreign-born population - Micronesia (%)
Place of birth for the foreign-born population - Bahamas (%)
Place of birth for the foreign-born population - Barbados (%)
Place of birth for the foreign-born population - Cuba (%)
Place of birth for the foreign-born population - Dominica (%)
Place of birth for the foreign-born population - Dominican Republic (%)
Place of birth for the foreign-born population - Grenada (%)
Place of birth for the foreign-born population - Haiti (%)
Place of birth for the foreign-born population - Jamaica (%)
Place of birth for the foreign-born population - St. Vincent and the Grenadines (%)
Place of birth for the foreign-born population - Trinidad and Tobago (%)
Place of birth for the foreign-born population - West Indies (%)
Place of birth for the foreign-born population - Other Caribbean (%)
Place of birth for the foreign-born population - Belize (%)
Place of birth for the foreign-born population - Costa Rica (%)
Place of birth for the foreign-born population - El Salvador (%)
Place of birth for the foreign-born population - Guatemala (%)
Place of birth for the foreign-born population - Honduras (%)
Place of birth for the foreign-born population - Mexico (%)
Place of birth for the foreign-born population - Nicaragua (%)
Place of birth for the foreign-born population - Panama (%)
Place of birth for the foreign-born population - Other Central America (%)
Place of birth for the foreign-born population - Argentina (%)
Place of birth for the foreign-born population - Bolivia (%)
Place of birth for the foreign-born population - Brazil (%)
Place of birth for the foreign-born population - Chile (%)
Place of birth for the foreign-born population - Colombia (%)
Place of birth for the foreign-born population - Ecuador (%)
Place of birth for the foreign-born population - Guyana (%)
Place of birth for the foreign-born population - Peru (%)
Place of birth for the foreign-born population - Uruguay (%)
Place of birth for the foreign-born population - Venezuela (%)
Place of birth for the foreign-born population - Other South America (%)
Place of birth for the foreign-born population - Canada (%)
Place of birth for the foreign-born population - Other Northern America (%)
Place of birth for the foreign-born population - Other (%)
Latest news about races in Rosenberg, TX collected exclusively by city-data.com from local newspapers, TV, and radio stations
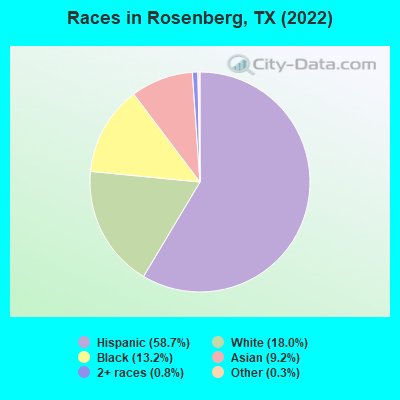
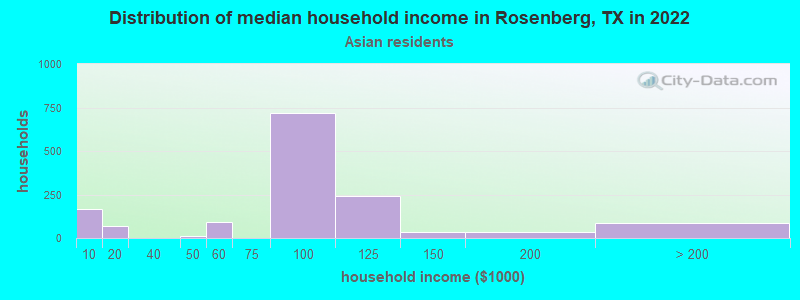
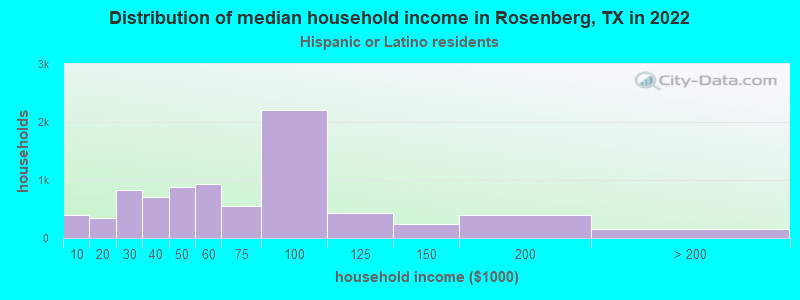
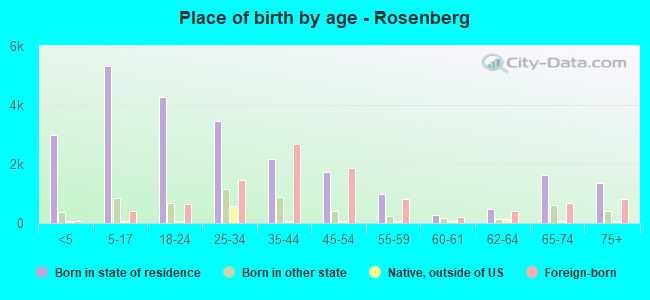
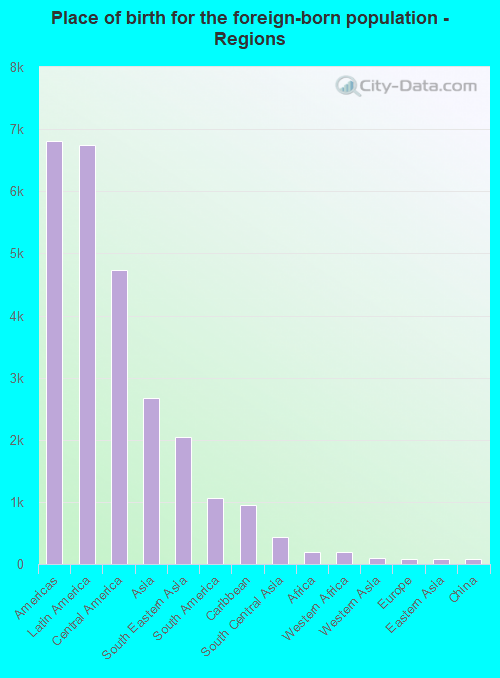
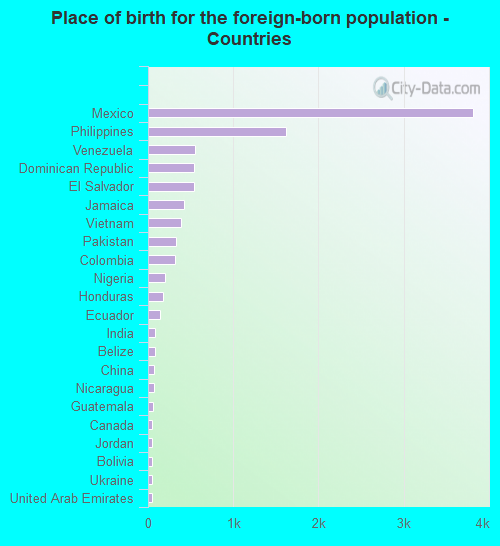
According to 2022 data, the most numerous races in Rosenberg, TX are Hispanic (24,284 residents), White alone (7,425 residents), and Black alone (5,451 residents). 52.1% of Rosenberg residents speak English at home. 23.6% of Rosenberg, TX residents are foreign-born (16.8% born in Latin America, 6.6% born in Asia), which is 27.8% greater than the foreign-born rate of 17.0% across the entire state of Texas.
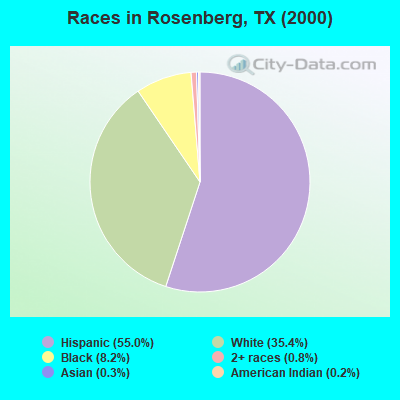
Race distribution in Rosenberg
2000 2022
10,933,313 52.4% White alone 6,669,666 32.0% Hispanic 2,364,255 11.3% Black alone 554,445 2.7% Asian alone 230,567 1.1% Two or more races 68,859 0.3% American Indian alone 19,958 0.10% Other race alone 10,757 0.05% Native Hawaiian and Other
12,070,642 40.2% Hispanic 11,683,430 38.9% White alone 3,508,706 11.7% Black alone 1,608,173 5.4% Asian alone 956,560 3.2% Two or more races 125,763 0.4% Other race alone 47,023 0.2% American Indian alone 29,275 0.10% Native Hawaiian and Other
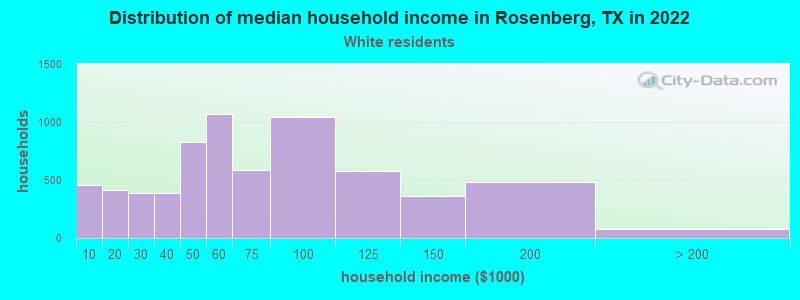
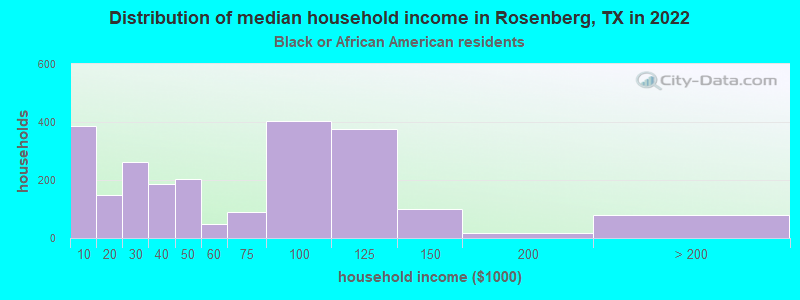
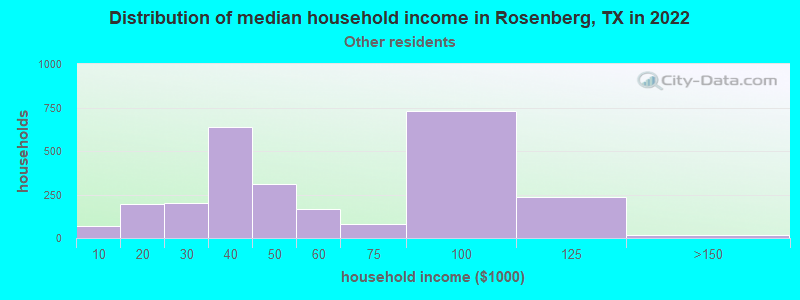
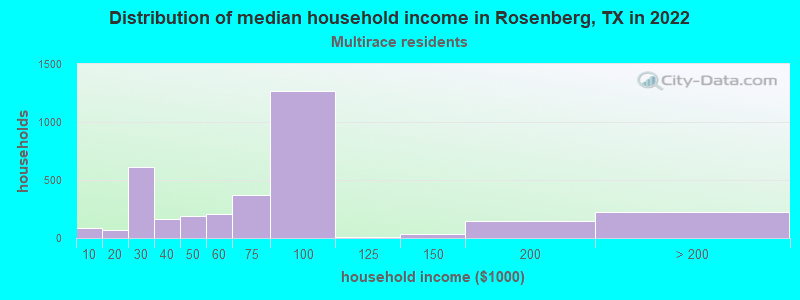
Income and house value in Rosenberg Median household income in 2022 $53,837 White non-Hispanic householders$74,249 Black householders$90,864 Asian householders$46,952 Some other race householders$73,355 Two or more races householders$60,175 Hispanic or Latino race householdersMedian 2022 house value $255,569 White Non-Hispanic householders$227,561 Black or African American householders$962,760 American Indian or Alaska Native householders $262,571 Asian householders$171,546 Some other race householders$227,561 Two or more races householders$202,354 Hispanic or Latino householders
Median age by race in Rosenberg
33.9 Median age for White residents34.4 33.7 30.7 Median age for Black or African American residents30.4 30.9 31.9 Median age for American Indian / Alaska Native residents-811,501,596.6 -762,172,283.9 41.6 Median age for Asian residents41.6 38.6 -581,560,283.1 Median age for Native Hawaiian / Pacific Islander residents-612,729,233.5 -577,777,777.2 31.7 Median age for Other race residents39.0 25.6 27.1 Median age for Two or more races residents30.0 24.7 42.5 Median age for White alone residents40.9 43.8 28.5 Median age for Hispanic or Latino residents30.4 25.5
Owner/renter occupied households by race in Rosenberg
House owners and renters - White residents 3,119 49.8% Owner occupied3,149 50.2% Renter occupiedHouse owners and renters - Black or African American residents 1,206 55.6% Owner occupied965 44.4% Renter occupiedHouse owners and renters - American Indian / Alaska Native residents 32 100.0% Owner occupiedHouse owners and renters - Asian residents 1,198 90.5% Owner occupied126 9.5% Renter occupiedHouse owners and renters - Other race residents 1,586 56.5% Owner occupied1,222 43.5% Renter occupiedHouse owners and renters - Two or more races residents 1,529 41.8% Owner occupied2,127 58.2% Renter occupiedHouse owners and renters - White alone residents 2,061 48.8% Owner occupied2,165 51.2% Renter occupiedHouse owners and renters - Hispanic or Latino residents 3,940 50.3% Owner occupied3,896 49.7% Renter occupied
Language usage in Rosenberg
English speakers - Total 52.1% of residents of Rosenberg speak English at home.
39.5% of residents speak Spanish at home 9,397 62.8% Speak English very well5,560 37.2% Speak English less than very well8.9% of residents speak other language at home 1,975 58.8% Speak English very well1,384 41.2% Speak English less than very well
English speakers - Born in the United States 72.7% of residents of Rosenberg speak English at home.
31.1% of residents speak Spanish at home 820 48.8% Speak English very well860 51.2% Speak English less than very well3.0% of residents speak other language at home 164 100.0% Speak English very well
English speakers - Native, born elsewhere 51.3% of residents of Rosenberg speak English at home.
25.8% of residents speak Spanish at home 102 62.2% Speak English very well62 37.8% Speak English less than very well27.4% of residents speak other language at home 80 46.0% Speak English very well94 54.0% Speak English less than very well
English speakers - Foreign-born 10.8% of residents of Rosenberg speak English at home.
58.7% of residents speak Spanish at home 1,917 32.3% Speak English very well4,021 67.7% Speak English less than very well27.9% of residents speak other language at home 1,500 53.2% Speak English very well1,319 46.8% Speak English less than very well
White (Caucasian) - Speak only English Native:
77.1% (9,318)Foreign-born:
9.7% (162)
White (Caucasian) - Speak another language Native:
16.4% (1,985)Foreign-born:
82.5% (1,373)
Black or African American - Speak only English Native:
93.9% (4,440)Foreign-born:
70.7% (395)
Black or African American - Speak another language Native:
4.2% (196)Foreign-born:
29.8% (166)
Asian - Speak another language Native:
48.1% (513)Foreign-born:
99.0% (2,671)
Other race - Speak only English Native:
29.8% (1,246)Foreign-born:
6.0% (183)
Other race - Speak another language Native:
70.8% (2,958)Foreign-born:
88.5% (2,687)
Two or more races - Speak only English Native:
49.2% (3,354)Foreign-born:
11.8% (301)
Two or more races - Speak another language Native:
52.5% (3,585)Foreign-born:
81.7% (2,089)
White alone - Speak only English Native:
99.3% (6,872)Foreign-born:
77.5% (117)
White alone - Speak another language Native:
0.9% (62)Foreign-born:
24.7% (37)
Hispanic or Latino - Speak only English Native:
40.9% (6,263)Foreign-born:
8.9% (570)
Hispanic or Latino - Speak another language Native:
59.7% (9,143)Foreign-born:
90.8% (5,816)
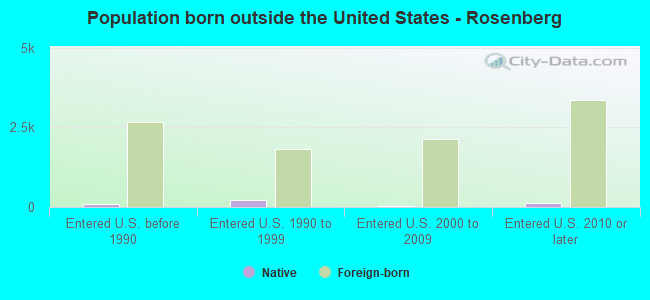
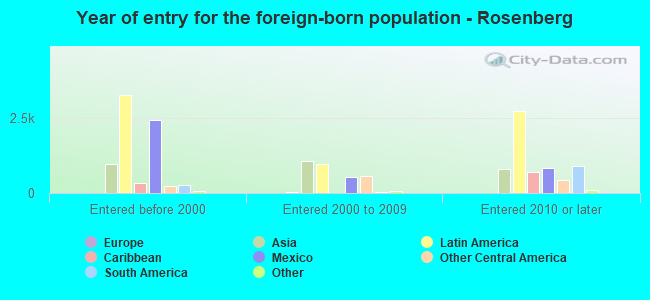
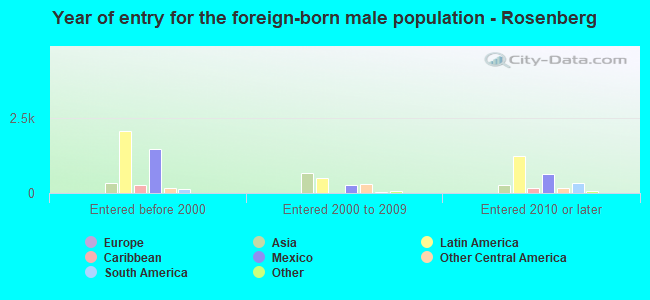
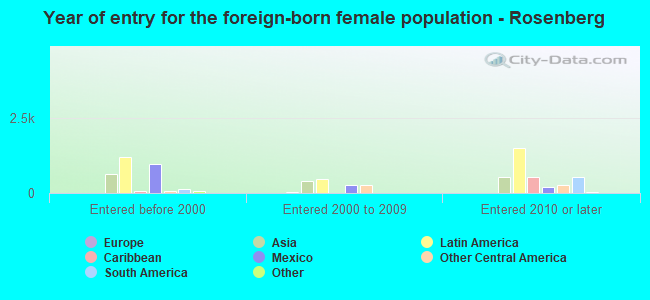
Foreign-born residents in Rosenberg 9,740 residents are foreign born (16.8% Latin America , 6.6% Asia ).
This city:
23.6%Texas:
17.1%
Marital status for residents in Rosenberg Marital status - White (Caucasian) population 15 years and over
Males 36.4% Never married50.1% Now married1.7% Separated2.4% Widowed9.4% DivorcedFemales 32.4% Never married46.5% Now married2.8% Separated6.4% Widowed11.9% DivorcedWomen who gave birth in the past 12 months Now married:
73.0% (214)Unmarried:
27.0% (79)
Women who did not give birth in the past 12 months Now married:
43.7% (1,511)Unmarried:
56.3% (1,944)
Marital status - Black or African American population 15 years and over
Males 53.5% Never married37.8% Now married1.9% Separated2.0% Widowed4.8% DivorcedFemales 39.1% Never married33.8% Now married0.7% Separated13.5% Widowed12.9% DivorcedWomen who gave birth in the past 12 months Now married:
46.0% (24)Unmarried:
54.0% (28)
Women who did not give birth in the past 12 months Now married:
27.1% (332)Unmarried:
72.9% (894)
Marital status - American Indian / Alaska Native population 15 years and over
Males 0.0% Never married100.0% Now married0.0% Separated0.0% Widowed0.0% DivorcedFemales 0.0% Never married100.0% Now married0.0% Separated0.0% Widowed0.0% DivorcedWomen who did not give birth in the past 12 months Now married:
100.0% (42)Unmarried:
0.0% (0)
Marital status - Asian population 15 years and over
Males 21.6% Never married77.9% Now married0.0% Separated0.0% Widowed0.6% DivorcedFemales 15.8% Never married49.3% Now married0.0% Separated31.2% Widowed3.7% DivorcedWomen who did not give birth in the past 12 months Now married:
63.7% (592)Unmarried:
36.3% (338)
Marital status - Other race population 15 years and over
Males 37.7% Never married48.1% Now married4.4% Separated4.8% Widowed5.0% DivorcedFemales 42.2% Never married44.6% Now married1.4% Separated4.3% Widowed7.5% DivorcedWomen who gave birth in the past 12 months Now married:
100.0% (399)Unmarried:
0.0% (0)
Women who did not give birth in the past 12 months Now married:
26.4% (542)Unmarried:
73.6% (1,507)
Marital status - Two or more races population 15 years and over
Males 61.0% Never married26.9% Now married0.0% Separated2.5% Widowed9.6% DivorcedFemales 38.6% Never married42.0% Now married7.9% Separated3.8% Widowed7.7% DivorcedWomen who gave birth in the past 12 months Now married:
100.0% (340)Unmarried:
0.0% (0)
Women who did not give birth in the past 12 months Now married:
28.9% (569)Unmarried:
71.1% (1,403)
Marital status - White alone, not Hispanic / Latino population 15 years and over
Males 34.5% Never married47.3% Now married1.1% Separated3.6% Widowed13.5% DivorcedFemales 27.8% Never married40.7% Now married0.5% Separated11.1% Widowed20.0% DivorcedWomen who gave birth in the past 12 months Now married:
100.0% (148)Unmarried:
0.0% (0)
Women who did not give birth in the past 12 months Now married:
32.2% (574)Unmarried:
67.8% (1,209)
Marital status - Hispanic or Latino population 15 years and over
Males 45.9% Never married42.7% Now married2.2% Separated2.6% Widowed6.6% DivorcedFemales 38.5% Never married47.6% Now married4.9% Separated3.3% Widowed5.8% DivorcedWomen who gave birth in the past 12 months Now married:
85.4% (607)Unmarried:
14.6% (104)
Women who did not give birth in the past 12 months Now married:
40.6% (2,154)Unmarried:
59.4% (3,156)
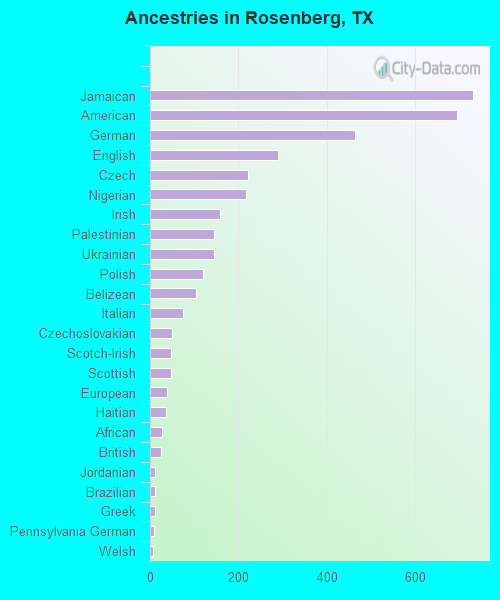
Ancestries in Rosenberg
731 2.5% Jamaican694 2.4% American465 1.6% German289 1.0% English222 0.8% Czech217 0.8% Nigerian158 0.5% Irish145 0.5% Palestinian145 0.5% Ukrainian121 0.4% Polish104 0.4% Belizean75 0.3% Italian49 0.2% Czechoslovakian48 0.2% Scotch-Irish47 0.2% Scottish38 0.1% European36 0.1% Haitian27 0.09% African24 0.08% British12 0.04% Jordanian12 0.04% Brazilian12 0.04% Greek9 0.03% Pennsylvania German7 0.02% Welsh5 0.02% Norwegian5 0.02% Swedish4 0.01% French4 0.01% Northern European
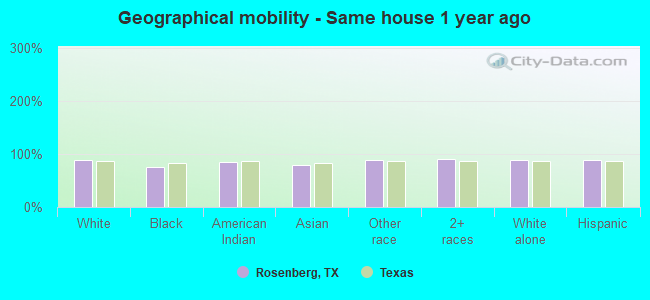
Geographical mobility in Rosenberg Same house 1 year ago 12,870 89.4% White (Caucasian)4,276 75.1% Black or African American99 85.7% American Indian / Alaska Native3,039 79.3% Asian7,260 88.0% Other race9,089 90.5% Two or more races6,354 89.2% White alone, not Hispanic / Latino21,327 89.3% Hispanic or LatinoMoved within same county 693 4.8% White / Caucasian569 10.0% Black or African American149 3.9% Asian690 8.4% Other race890 8.9% Two or more races169 2.4% White alone, not Hispanic / Latino2,092 8.8% Hispanic or LatinoMoved within same state 557 3.9% White / Caucasian593 10.4% Black or African American17 14.4% American Indian / Alaska Native4 0.1% Asian1 0.0% Other race16 0.2% Two or more races415 5.8% White alone, not Hispanic / Latino365 1.5% Hispanic or LatinoMoved from different state 151 1.1% White / Caucasian142 2.5% Black or African American552 14.4% Asian150 2.1% White alone, not Hispanic / Latino9 0.0% Hispanic or LatinoMoved from abroad 7 0.1% White78 0.9% Other race70 0.3% Hispanic or Latino
Children Nativity (place of birth) in Rosenberg
Children under 6 years - Living with two parents Both parents native 819 100.0% NativeBoth parents foreign-born 791 96.8% Native27 3.2% Foreign-bornOne native, one foreign-born parent 368 100.0% NativeChildren under 6 years - Living with one parent Native parent 2,108 100.0% NativeForeign-born parent 266 100.0% NativeChildren 6 to 17 years - Living with two parents Both parents native 878 100.0% NativeBoth parents foreign-born 1,091 82.8% Native226 17.2% Foreign-bornOne native, one foreign-born parent 488 100.0% NativeChildren 6 to 17 years - Living with one parent Native parent 1,953 100.0% NativeForeign-born parent 712 57.5% Native527 42.5% Foreign-born
Grandparents responsible for own grandchildren in Rosenberg
Grandparents (30 to 59 years) White / Caucasian 127 33.5% Responsible for grandchildren251 66.5% Not responsible for grandchildrenAsian 36 100.0% Not responsible for grandchildrenOther race 110 59.8% Responsible for grandchildren74 40.2% Not responsible for grandchildrenTwo or more races 291 85.7% Responsible for grandchildren49 14.3% Not responsible for grandchildrenWhite alone, not Hispanic / Latino 71 100.0% Not responsible for grandchildrenHispanic or Latino 651 52.6% Responsible for grandchildren586 47.4% Not responsible for grandchildrenGrandparents (60 years and over) White / Caucasian 6 3.7% Responsible for grandchildren157 96.3% Not responsible for grandchildrenAsian 304 100.0% Not responsible for grandchildrenOther race 218 100.0% Not responsible for grandchildrenTwo or more races 102 100.0% Not responsible for grandchildrenWhite alone, not Hispanic / Latino 9 30.6% Responsible for grandchildren20 69.4% Not responsible for grandchildrenHispanic or Latino 548 100.0% Not responsible for grandchildren