Races in Rosendale Village, New York (NY) Detailed Stats
Ancestries, Foreign-born residents, place of birth

Discuss Rosendale Village, New York races on our local forum with over 2,400,000 registered users
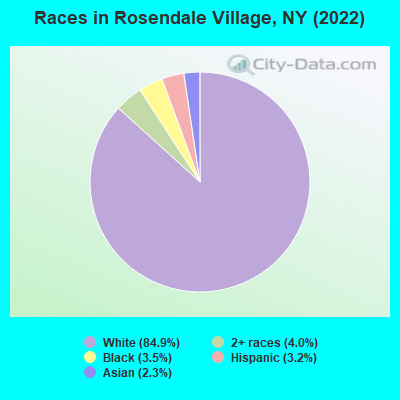
According to 2022 data, the most numerous races in Rosendale Village, NY are White alone (950 residents), Hispanic (36 residents), and Black alone (39 residents). 93.7% of Rosendale Village residents speak English at home. 3.6% of Rosendale Village, NY residents are foreign-born (2.1% born in Europe, 1.3% born in Asia), which is 516.0% less than the foreign-born rate of 22.0% across the entire state of New York.
Race distribution in Rosendale Village

2000
2022

- 11,760,98162.0%White alone
- 2,867,58315.1%Hispanic
- 2,812,62314.8%Black alone
- 1,035,9265.5%Asian alone
- 366,1161.9%Two or more races
- 75,4990.4%Other race alone
- 52,4990.3%American Indian alone
- 5,2300.03%Native Hawaiian and Other
Pacific Islander alone

-
- 10,408,93352.9%White alone
- 3,867,29919.7%Hispanic
- 2,633,84013.4%Black alone
- 1,776,2869.0%Asian alone
- 732,6703.7%Two or more races
- 216,1101.1%Other race alone
- 35,0820.2%American Indian alone
- 6,9310.04%Native Hawaiian and Other
Pacific Islander alone

Income and house value in Rosendale Village
- Median household income in 2022
- $50,481White non-Hispanic householders
- $142,148Black householders
- $66,824Some other race householders
- over $200,000Hispanic or Latino race householders
- Median 2022 house value
- $269,982White Non-Hispanic householders
- $340,123Black or African American householders
- $680,246Some other race householders
Household income for White non-Hispanic householders

Household income for Black householders

Household income for Hispanic or Latino race householders

Median age by race in Rosendale Village
- 51.1Median age for White residents
- 40.5Males
- 54.7Females
- 17.5Median age for Black or African American residents
- 34.6Median age for Asian residents
- 30.9Median age for Two or more races residents
- 49.4Median age for White alone residents
- 40.5Males
- 50.8Females
- 71.0Median age for Hispanic or Latino residents
Owner/renter occupied households by race in Rosendale Village
- House owners and renters - White residents
- 29162.0%Owner occupied
- 17838.0%Renter occupied
- House owners and renters - Black or African American residents
- 18100.0%Owner occupied
- House owners and renters - Asian residents
- 5100.0%Renter occupied
- House owners and renters - White alone residents
- 28360.6%Owner occupied
- 18439.4%Renter occupied
- House owners and renters - Hispanic or Latino residents
- 15100.0%Owner occupied
Language usage in Rosendale Village
- English speakers - Total
- 93.7% of residents of Rosendale Village speak English at home.
- 0.4% of residents speak Spanish at home
- 4100.0%Speak English very well
- 5.7% of residents speak other language at home
- 3760.7%Speak English very well
- 2439.3%Speak English less than very well
- English speakers - Born in the United States
- 86.4% of residents of Rosendale Village speak English at home.
- 13.6% of residents speak other language at home
- 21100.0%Speak English very well
- English speakers - Native, born elsewhere
- 0.0% of residents of Rosendale Village speak English at home.
- 112.5% of residents speak other language at home
- 9100.0%Speak English less than very well
- English speakers - Foreign-born
- 20.0% of residents of Rosendale Village speak English at home.
- 80.0% of residents speak other language at home
- 1650.0%Speak English very well
- 1650.0%Speak English less than very well
White (Caucasian) - Speak only English
| Native: | 97.8% (865) |
| Foreign-born: | 45.1% (8) |
White (Caucasian) - Speak another language
| Native: | 2.9% (25) |
| Foreign-born: | 56.1% (11) |
Asian - Speak another language
| Native: | 74.3% (7) |
| Foreign-born: | 97.5% (13) |
White alone - Speak only English
| Native: | 96.8% (841) |
| Foreign-born: | 39.4% (9) |
White alone - Speak another language
| Native: | 3.0% (26) |
| Foreign-born: | 52.8% (12) |
Foreign-born residents in Rosendale Village
40 residents are foreign born (2.1% Europe, 1.3% Asia).
| This city: | 3.6% |
| New York: | 100.0% |


Marital status for residents in Rosendale Village
Marital status - White (Caucasian) population 15 years and over
- Males
- 33.3%Never married
- 35.9%Now married
- 0.0%Separated
- 0.0%Widowed
- 30.8%Divorced
- Females
- 23.6%Never married
- 47.7%Now married
- 0.0%Separated
- 2.7%Widowed
- 26.0%Divorced
Women who did not give birth in the past 12 months
| Now married: | 27.1% (34) |
| Unmarried: | 72.9% (92) |
Marital status - Black or African American population 15 years and over
- Males
- 66.7%Never married
- 33.3%Now married
- 0.0%Separated
- 0.0%Widowed
- 0.0%Divorced
- Females
- 100.0%Never married
- 0.0%Now married
- 0.0%Separated
- 0.0%Widowed
- 0.0%Divorced
Women who did not give birth in the past 12 months
| Now married: | 0.0% (0) |
| Unmarried: | 100.0% (10) |
Marital status - Asian population 15 years and over
- Males
- 44.4%Never married
- 55.6%Now married
- 0.0%Separated
- 0.0%Widowed
- 0.0%Divorced
- Females
- 0.0%Never married
- 100.0%Now married
- 0.0%Separated
- 0.0%Widowed
- 0.0%Divorced
Women who did not give birth in the past 12 months
| Now married: | 100.0% (7) |
| Unmarried: | 0.0% (0) |
Marital status - White alone, not Hispanic / Latino population 15 years and over
- Males
- 33.3%Never married
- 35.9%Now married
- 0.0%Separated
- 0.0%Widowed
- 30.8%Divorced
- Females
- 25.4%Never married
- 50.1%Now married
- 0.0%Separated
- 2.9%Widowed
- 21.6%Divorced
Women who did not give birth in the past 12 months
| Now married: | 27.1% (35) |
| Unmarried: | 72.9% (95) |
Marital status - Hispanic or Latino population 15 years and over
- Males
- 100.0%Never married
- 0.0%Now married
- 0.0%Separated
- 0.0%Widowed
- 0.0%Divorced
- Females
- 0.0%Never married
- 15.4%Now married
- 0.0%Separated
- 0.0%Widowed
- 84.6%Divorced
Ancestries in Rosendale Village

- 8731.2%Irish
- 176.1%Dutch
- 176.1%Italian
- 165.7%Ukrainian
- 124.3%German
- 114.0%Eastern European
- 114.0%Polish
- 93.2%African
- 62.2%Austrian
- 31.1%Greek

Geographical mobility in Rosendale Village

- Same house 1 year ago
- 80386.0%White (Caucasian)
- 45100.0%Black or African American
- 2699.8%Asian
- 68100.0%Two or more races
- 82885.7%White alone, not Hispanic / Latino
- 2774.6%Hispanic or Latino

-
- Moved within same county
- 10511.2%White / Caucasian
- 11111.5%White alone, not Hispanic / Latino

-
- Moved within same state
- 192.1%White / Caucasian
- 202.1%White alone, not Hispanic / Latino

-
- Moved from different state
- 40.4%White / Caucasian
- 773.4%Other race
- 40.4%White alone, not Hispanic / Latino
- 924.3%Hispanic or Latino

Children Nativity (place of birth) in Rosendale Village
Place of birth for residents in Rosendale Village
![Place of birth for the foreign-born population - Regions]()
- 24Europe
- 16Asia
- 16South Central Asia
- 8Northern Europe
- 8Western Europe
- 8Eastern Europe
