Races in Ross Township, Pennsylvania (PA) Detailed Stats
Ancestries, Foreign-born residents, place of birth

Recent posts about races in Ross Township, Pennsylvania on our local forum with over 2,400,000 registered users:
 | McCandless Crossing area (53 replies) |
| Ben Avon & Ross Township - Neighborhood Questions (13 replies) |
| Best neighborhoods for a mixed ethnicity family in Pittsburgh, PA? (53 replies) |
| What’s wrong with this house? (31 replies) |
| Suburb of the week: Ross Township (20 replies) |
| How would you have built I-279? (68 replies) |
3.7% of Ross Township, PA residents are foreign-born (1.5% born in Asia, 1.4% born in Europe), which is 89.2% less than the foreign-born rate of 7.0% across the entire state of Pennsylvania.
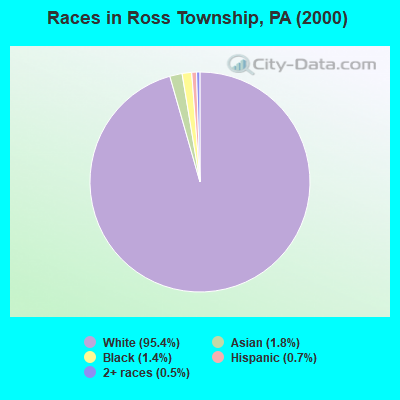
Race distribution in Ross Township

- 31,04695.4%White alone
- 5861.8%Asian alone
- 4591.4%Black alone
- 2370.7%Hispanic
- 1540.5%Two or more races
- 270.08%Other race alone
- 210.06%American Indian alone
- 210.06%Native Hawaiian and Other
Pacific Islander alone
2000
2022
-
- 10,322,45584.1%White alone
- 1,202,4379.8%Black alone
- 394,0883.2%Hispanic
- 218,2961.8%Asian alone
- 113,0970.9%Two or more races
- 13,0860.1%Other race alone
- 14,9040.1%American Indian alone
- 2,6910.02%Native Hawaiian and Other
Pacific Islander alone

-
- 9,487,22873.1%White alone
- 1,311,58110.1%Black alone
- 1,115,9978.6%Hispanic
- 493,9423.8%Two or more races
- 487,1243.8%Asian alone
- 63,5820.5%Other race alone
- 10,1300.08%American Indian alone
- 2,4240.02%Native Hawaiian and Other
Pacific Islander alone

Income and house value in Ross Township
- Median household income in 2022
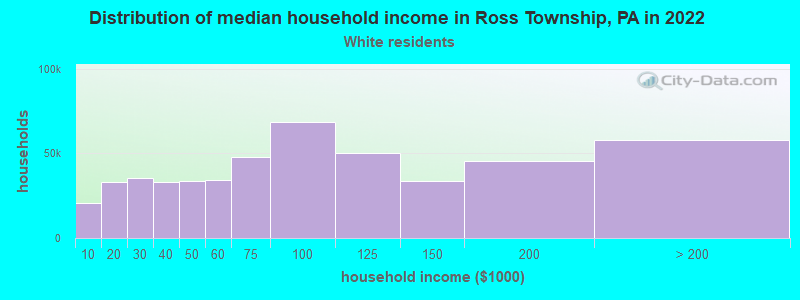
- $88,713White non-Hispanic householders
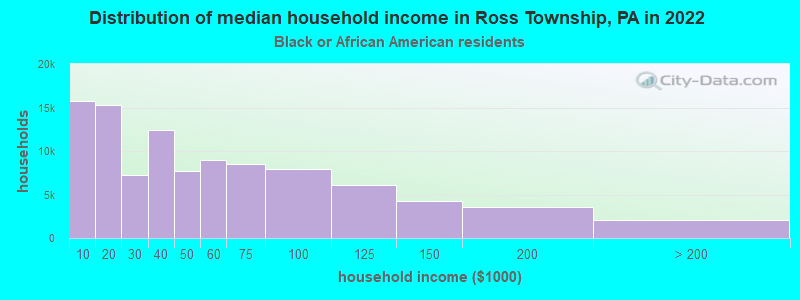
- $65,308Black householders
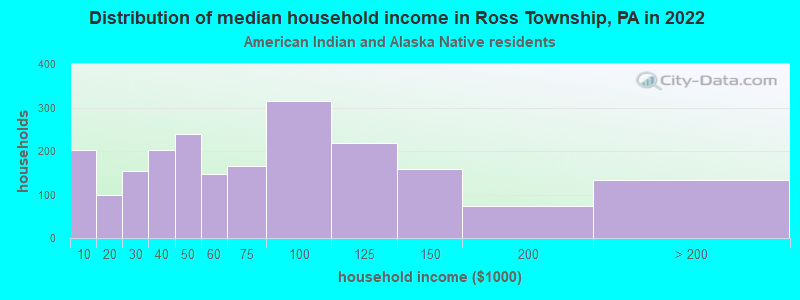
- $11,264American Indian and Alaska Native householders
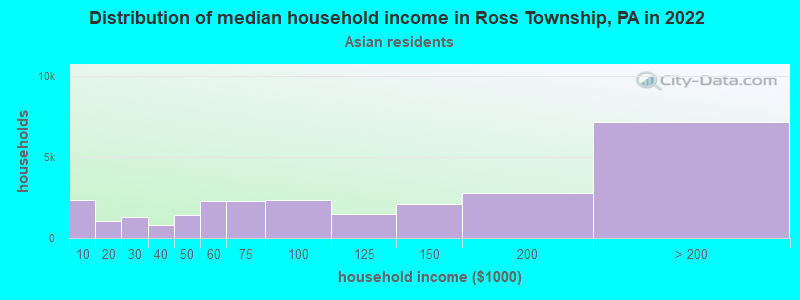
- $140,177Asian householders
- $31,468Some other race householders
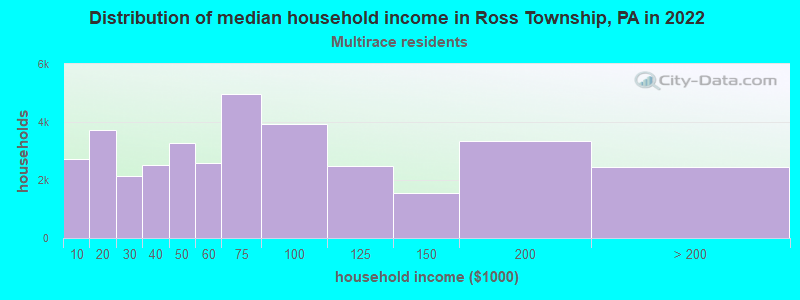
- $92,766Two or more races householders
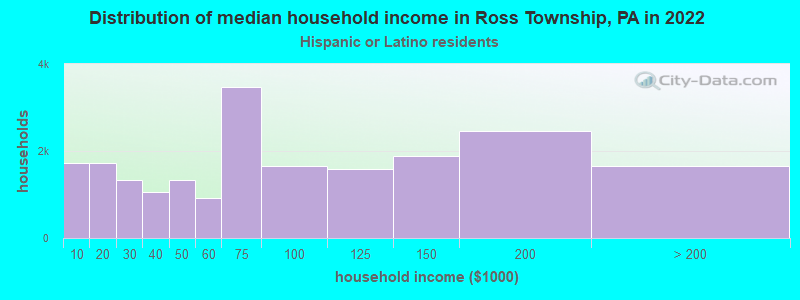
- $123,488Hispanic or Latino race householders
- Median 2022 house value
- $288,077White Non-Hispanic householders
- $241,347Black or African American householders
- $390,032Asian householders
- $388,705Two or more races householders
- $236,834Hispanic or Latino householders
Household income for White non-Hispanic householders
Household income for Black householders
Household income for American Indian and Alaska Native householders
Household income for Asian householders
Household income for Two or more races householders
Household income for Hispanic or Latino race householders
Foreign-born residents in Ross Township
1,204 residents are foreign born (1.5% Asia, 1.4% Europe).
| This city: | 3.7% |
| Pennsylvania: | 4.1% |
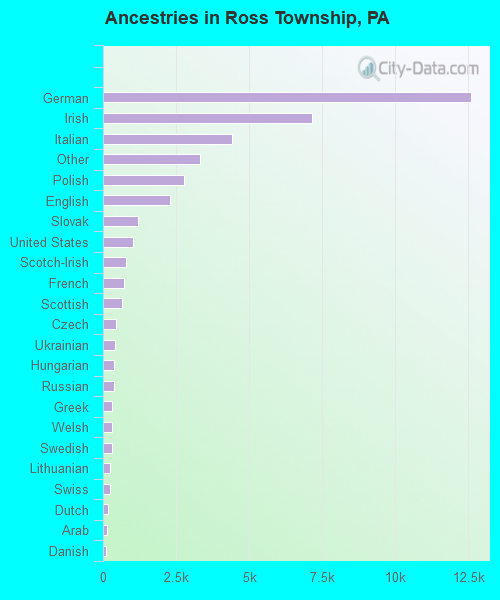
Ancestries in Ross Township

- 12,58931.0%German
- 7,14917.6%Irish
- 4,41110.9%Italian
- 3,3228.2%Other
- 2,7766.8%Polish
- 2,2855.6%English
- 1,1993.0%Slovak
- 1,0442.6%United States
- 7861.9%Scotch-Irish
- 7071.7%French
- 6471.6%Scottish
- 4481.1%Czech
- 4161.0%Ukrainian
- 3770.9%Hungarian
- 3730.9%Russian
- 3160.8%Greek
- 3040.7%Welsh
- 2980.7%Swedish
- 2450.6%Lithuanian
- 2260.6%Swiss
- 1820.4%Dutch
- 1460.4%Arab
- 1190.3%Danish
- 960.2%Subsaharan African
- 870.2%Norwegian
- 730.2%French Canadian
- 90.02%West Indian
- 70.02%Portuguese
Zip codes: 15229.