Races in Rossville-Beverly Hills, Georgia (GA) Detailed Stats
Ancestries, Foreign-born residents, place of birth
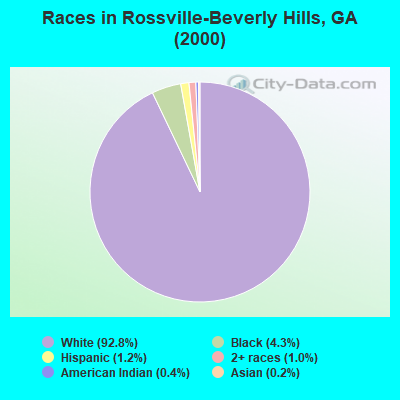
Race distribution in Rossville-Beverly Hills

- 9,54592.8%White alone
- 4444.3%Black alone
- 1201.2%Hispanic
- 1041.0%Two or more races
- 450.4%American Indian alone
- 220.2%Asian alone
- 20.02%Native Hawaiian and Other
Pacific Islander alone
2000
2022
-
- 5,128,66162.6%White alone
- 2,331,46528.5%Black alone
- 435,2275.3%Hispanic
- 171,5132.1%Asian alone
- 87,3641.1%Two or more races
- 17,6700.2%American Indian alone
- 11,2750.1%Other race alone
- 3,2780.04%Native Hawaiian and Other
Pacific Islander alone

-
- 5,415,65749.6%White alone
- 3,349,24030.7%Black alone
- 1,132,60410.4%Hispanic
- 479,1564.4%Asian alone
- 462,9234.2%Two or more races
- 54,4160.5%Other race alone
- 11,9230.1%American Indian alone
- 6,9570.06%Native Hawaiian and Other
Pacific Islander alone

Income and house value in Rossville-Beverly Hills
- Median household income in 2022
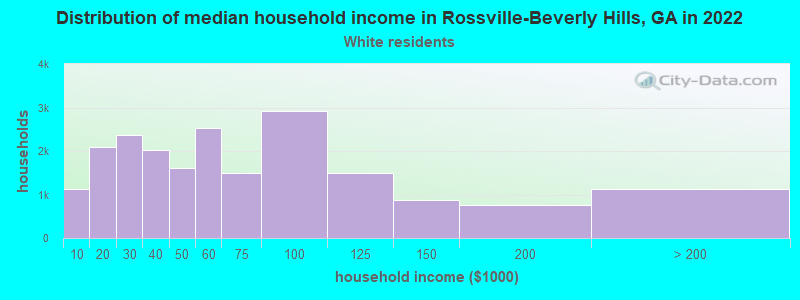
- $45,353White non-Hispanic householders
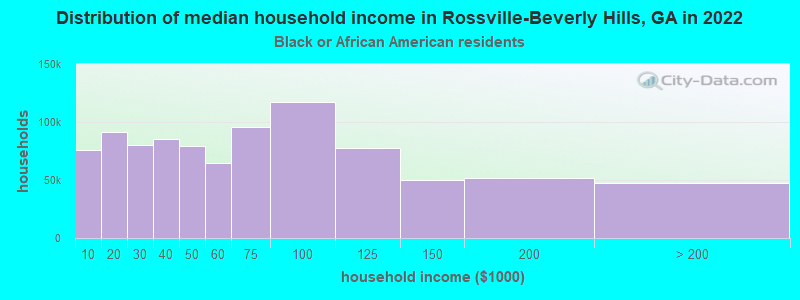
- $82,964Black householders
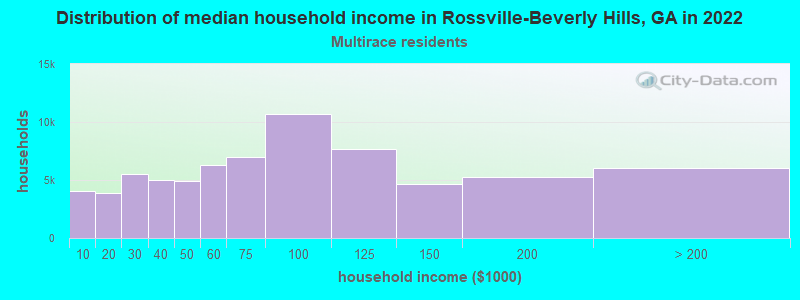
- $43,783Two or more races householders
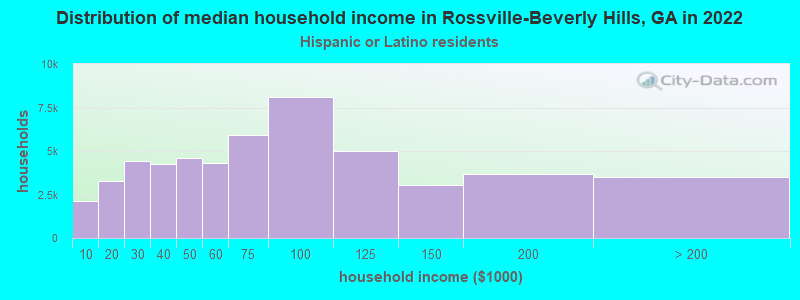
- $22,589Hispanic or Latino race householders
- Median 2022 house value
- $158,503White Non-Hispanic householders
- $135,937Black or African American householders
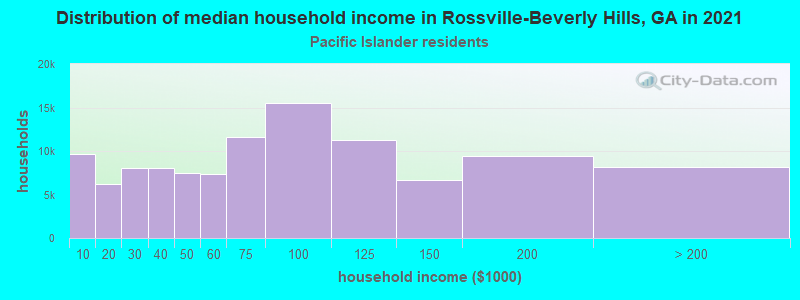
- $174,622Native Hawaiian and other Pacific Islander householders
- $96,714Two or more races householders
- $302,231Hispanic or Latino householders
Household income for White non-Hispanic householders
Household income for Black householders
Household income for Native Hawaiian and other Pacific Islander householders
Household income for Two or more races householders
Household income for Hispanic or Latino race householders
Zip code: 30741