Races in Round Lake Park, Illinois (IL) Detailed Stats
Data:
Races - White alone (%)
Races - White alone (% change since 2000)
Races - Black alone (%)
Races - Black alone (% change since 2000)
Races - American Indian alone (%)
Races - American Indian alone (% change since 2000)
Races - Asian alone (%)
Races - Asian alone (% change since 2000)
Races - Hispanic (%)
Races - Hispanic (% change since 2000)
Races - Native Hawaiian and Other Pacific Islander alone (%)
Races - Native Hawaiian and Other Pacific Islander alone (% change since 2000)
Races - Two or more races(%)
Races - Two or more races(% change since 2000)
Races - Other race alone (%)
Races - Other race alone (% change since 2000)
Racial diversity
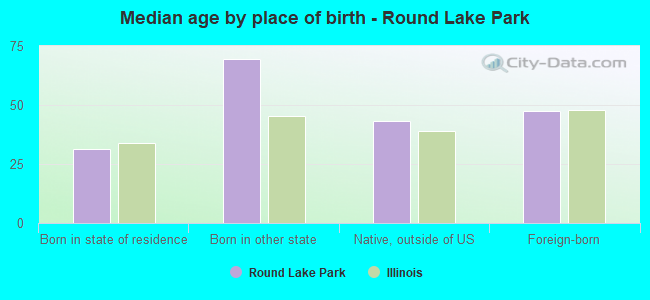
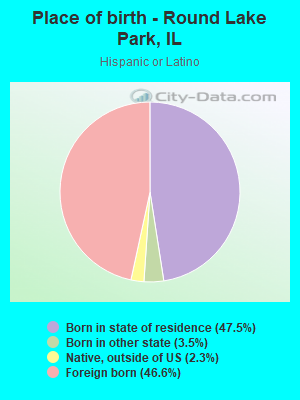
Place of birth - Born in state of residence (%)
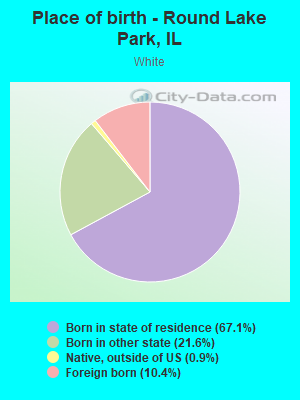
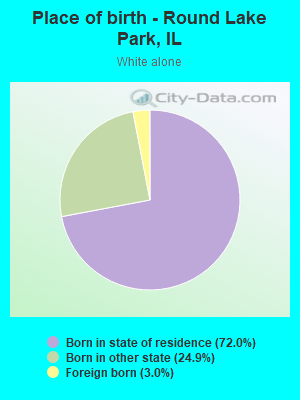
Place of birth - Born in state of residence (%) - White
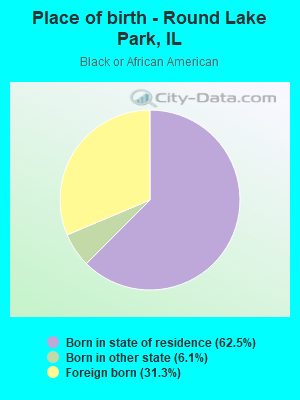
Place of birth - Born in state of residence (%) - Black or African American
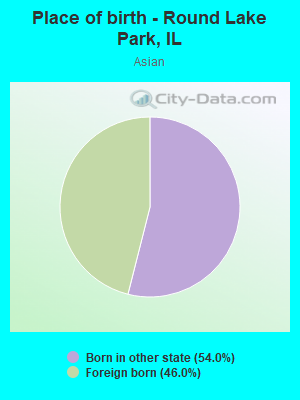
Place of birth - Born in state of residence (%) - Asian
Place of birth - Born in state of residence (%) - Hispanic or Latino
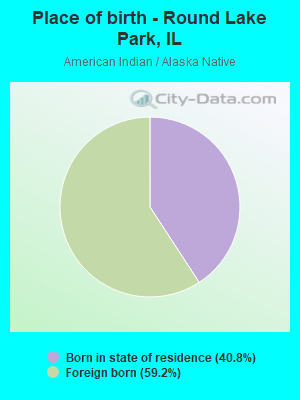
Place of birth - Born in state of residence (%) - American Indian and Alaska Native
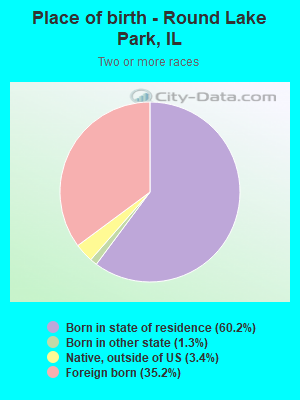
Place of birth - Born in state of residence (%) - Multirace
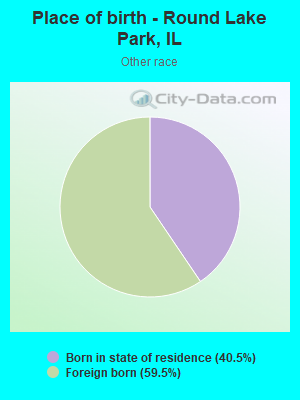
Place of birth - Born in state of residence (%) - Other Race
Place of birth - Born in other state (%)
Place of birth - Born in other state (%) - White
Place of birth - Born in other state (%) - Black or African American
Place of birth - Born in other state (%) - Asian
Place of birth - Born in other state (%) - Hispanic or Latino
Place of birth - Born in other state (%) - American Indian and Alaska Native
Place of birth - Born in other state (%) - Multirace
Place of birth - Born in other state (%) - Other Race
Place of birth - Native, outside of US (%)
Place of birth - Native, outside of US (%) - White
Place of birth - Native, outside of US (%) - Black or African American
Place of birth - Native, outside of US (%) - Asian
Place of birth - Native, outside of US (%) - Hispanic or Latino
Place of birth - Native, outside of US (%) - American Indian and Alaska Native
Place of birth - Native, outside of US (%) - Multirace
Place of birth - Native, outside of US (%) - Other Race
Place of birth - Foreign born (%)
Place of birth - Foreign born (%) - White
Place of birth - Foreign born (%) - Black or African American
Place of birth - Foreign born (%) - Asian
Place of birth - Foreign born (%) - Hispanic or Latino
Place of birth - Foreign born (%) - American Indian and Alaska Native
Place of birth - Foreign born (%) - Multirace
Place of birth - Foreign born (%) - Other Race
Residents speaking English at home (%)
Residents speaking English at home - Born in the United States (%)
Residents speaking English at home - Native, born elsewhere (%)
Residents speaking English at home - Foreign born (%)
Residents speaking Spanish at home (%)
Residents speaking Spanish at home - Born in the United States (%)
Residents speaking Spanish at home - Native, born elsewhere (%)
Residents speaking Spanish at home - Foreign born (%)
Residents speaking other language at home (%)
Residents speaking other language at home - Born in the United States (%)
Residents speaking other language at home - Native, born elsewhere (%)
Residents speaking other language at home - Foreign born (%)
Marital status - Never married (%)
Marital status - Now married (%)
Marital status - Separated (%)
Marital status - Widowed (%)
Marital status - Divorced (%)
Ancestries Reported - Arab (%)
Ancestries Reported - Czech (%)
Ancestries Reported - Danish (%)
Ancestries Reported - Dutch (%)
Ancestries Reported - English (%)
Ancestries Reported - French (%)
Ancestries Reported - French Canadian (%)
Ancestries Reported - German (%)
Ancestries Reported - Greek (%)
Ancestries Reported - Hungarian (%)
Ancestries Reported - Irish (%)
Ancestries Reported - Italian (%)
Ancestries Reported - Lithuanian (%)
Ancestries Reported - Norwegian (%)
Ancestries Reported - Polish (%)
Ancestries Reported - Portuguese (%)
Ancestries Reported - Russian (%)
Ancestries Reported - Scotch-Irish (%)
Ancestries Reported - Scottish (%)
Ancestries Reported - Slovak (%)
Ancestries Reported - Subsaharan African (%)
Ancestries Reported - Swedish (%)
Ancestries Reported - Swiss (%)
Ancestries Reported - Ukrainian (%)
Ancestries Reported - United States (%)
Ancestries Reported - Welsh (%)
Ancestries Reported - West Indian (%)
Ancestries Reported - Other (%)
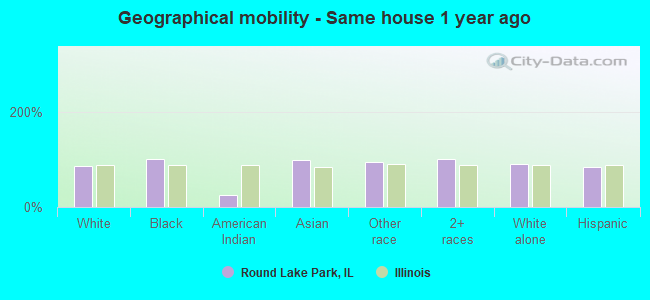
Geographical mobility - Same house 1 year ago (%)
Geographical mobility - Same house 1 year ago (%) - White
Geographical mobility - Same house 1 year ago (%) - Black or African American
Geographical mobility - Same house 1 year ago (%) - Asian
Geographical mobility - Same house 1 year ago (%) - Hispanic or Latino
Geographical mobility - Same house 1 year ago (%) - American Indian and Alaska Native
Geographical mobility - Same house 1 year ago (%) - Multirace
Geographical mobility - Same house 1 year ago (%) - Other Race
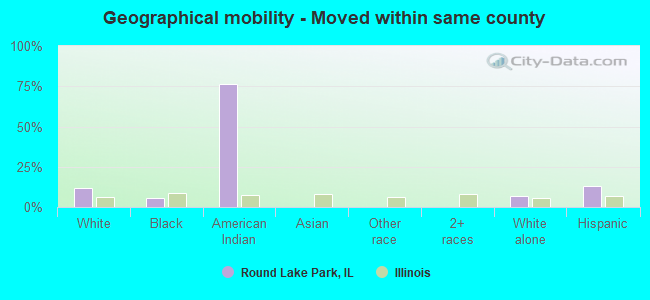
Geographical mobility - Moved within same county (%)
Geographical mobility - Moved within same county (%) - White
Geographical mobility - Moved within same county (%) - Black or African American
Geographical mobility - Moved within same county (%) - Asian
Geographical mobility - Moved within same county (%) - Hispanic or Latino
Geographical mobility - Moved within same county (%) - American Indian and Alaska Native
Geographical mobility - Moved within same county (%) - Multirace
Geographical mobility - Moved within same county (%) - Other Race
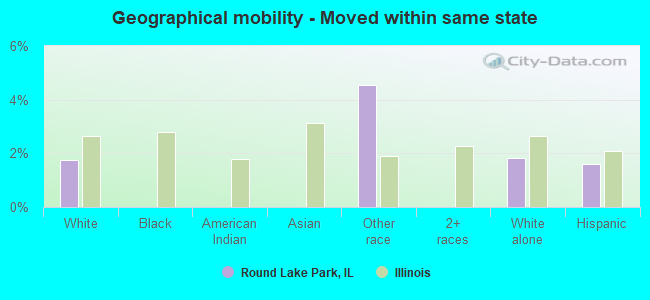
Geographical mobility - Moved from different county within same state (%)
Geographical mobility - Moved from different county within same state (%) - White
Geographical mobility - Moved from different county within same state (%) - Black or African American
Geographical mobility - Moved from different county within same state (%) - Asian
Geographical mobility - Moved from different county within same state (%) - Hispanic or Latino
Geographical mobility - Moved from different county within same state (%) - American Indian and Alaska Native
Geographical mobility - Moved from different county within same state (%) - Multirace
Geographical mobility - Moved from different county within same state (%) - Other Race
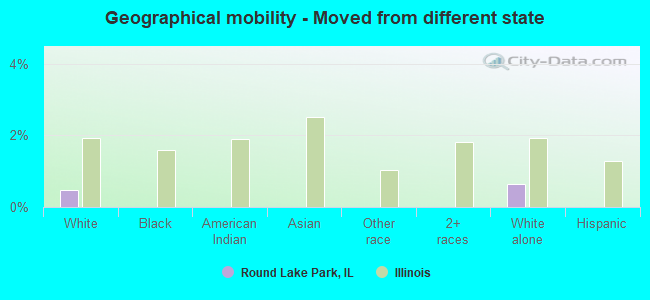
Geographical mobility - Moved from different state (%)
Geographical mobility - Moved from different state (%) - White
Geographical mobility - Moved from different state (%) - Black or African American
Geographical mobility - Moved from different state (%) - Asian
Geographical mobility - Moved from different state (%) - Hispanic or Latino
Geographical mobility - Moved from different state (%) - American Indian and Alaska Native
Geographical mobility - Moved from different state (%) - Multirace
Geographical mobility - Moved from different state (%) - Other Race
Geographical mobility - Moved from abroad (%)
Geographical mobility - Moved from abroad (%) - White
Geographical mobility - Moved from abroad (%) - Black or African American
Geographical mobility - Moved from abroad (%) - Asian
Geographical mobility - Moved from abroad (%) - Hispanic or Latino
Geographical mobility - Moved from abroad (%) - American Indian and Alaska Native
Geographical mobility - Moved from abroad (%) - Multirace
Geographical mobility - Moved from abroad (%) - Other Race
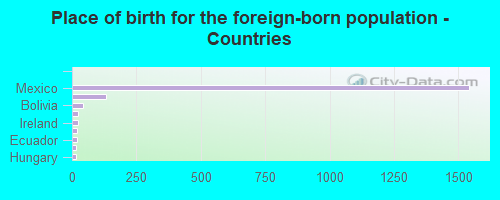
Place of birth for the foreign-born population - Ireland (%)
Place of birth for the foreign-born population - Denmark (%)
Place of birth for the foreign-born population - Norway (%)
Place of birth for the foreign-born population - Sweden (%)
Place of birth for the foreign-born population - United Kingdom (%)
Place of birth for the foreign-born population - England (%)
Place of birth for the foreign-born population - Scotland (%)
Place of birth for the foreign-born population - Other Northern Europe (%)
Place of birth for the foreign-born population - Austria (%)
Place of birth for the foreign-born population - Belgium (%)
Place of birth for the foreign-born population - France (%)
Place of birth for the foreign-born population - Germany (%)
Place of birth for the foreign-born population - Netherlands (%)
Place of birth for the foreign-born population - Switzerland (%)
Place of birth for the foreign-born population - Other Western Europe (%)
Place of birth for the foreign-born population - Greece (%)
Place of birth for the foreign-born population - Italy (%)
Place of birth for the foreign-born population - Portugal (%)
Place of birth for the foreign-born population - Spain (%)
Place of birth for the foreign-born population - Other Southern Europe (%)
Place of birth for the foreign-born population - Albania (%)
Place of birth for the foreign-born population - Belarus (%)
Place of birth for the foreign-born population - Bosnia and Herzegovina (%)
Place of birth for the foreign-born population - Bulgaria (%)
Place of birth for the foreign-born population - Croatia (%)
Place of birth for the foreign-born population - Czechoslovakia (%)
Place of birth for the foreign-born population - Hungary (%)
Place of birth for the foreign-born population - Latvia (%)
Place of birth for the foreign-born population - Lithuania (%)
Place of birth for the foreign-born population - North Macedonia (Macedonia) (%)
Place of birth for the foreign-born population - Moldova (%)
Place of birth for the foreign-born population - Poland (%)
Place of birth for the foreign-born population - Romania (%)
Place of birth for the foreign-born population - Russia (%)
Place of birth for the foreign-born population - Serbia (%)
Place of birth for the foreign-born population - Ukraine (%)
Place of birth for the foreign-born population - Other Eastern Europe (%)
Place of birth for the foreign-born population - China (%)
Place of birth for the foreign-born population - Hong Kong (%)
Place of birth for the foreign-born population - Taiwan (%)
Place of birth for the foreign-born population - Japan (%)
Place of birth for the foreign-born population - Korea (%)
Place of birth for the foreign-born population - Other Eastern Asia (%)
Place of birth for the foreign-born population - Afghanistan (%)
Place of birth for the foreign-born population - Bangladesh (%)
Place of birth for the foreign-born population - India (%)
Place of birth for the foreign-born population - Iran (%)
Place of birth for the foreign-born population - Kazakhstan (%)
Place of birth for the foreign-born population - Nepal (%)
Place of birth for the foreign-born population - Pakistan (%)
Place of birth for the foreign-born population - Sri Lanka (%)
Place of birth for the foreign-born population - Uzbekistan (%)
Place of birth for the foreign-born population - Other South Central Asia (%)
Place of birth for the foreign-born population - Burma (%)
Place of birth for the foreign-born population - Cambodia (%)
Place of birth for the foreign-born population - Indonesia (%)
Place of birth for the foreign-born population - Laos (%)
Place of birth for the foreign-born population - Malaysia (%)
Place of birth for the foreign-born population - Philippines (%)
Place of birth for the foreign-born population - Singapore (%)
Place of birth for the foreign-born population - Thailand (%)
Place of birth for the foreign-born population - Vietnam (%)
Place of birth for the foreign-born population - Other South Eastern Asia (%)
Place of birth for the foreign-born population - Armenia (%)
Place of birth for the foreign-born population - Iraq (%)
Place of birth for the foreign-born population - Israel (%)
Place of birth for the foreign-born population - Jordan (%)
Place of birth for the foreign-born population - Kuwait (%)
Place of birth for the foreign-born population - Lebanon (%)
Place of birth for the foreign-born population - Saudi Arabia (%)
Place of birth for the foreign-born population - Syria (%)
Place of birth for the foreign-born population - Turkey (%)
Place of birth for the foreign-born population - Yemen (%)
Place of birth for the foreign-born population - Other Western Asia (%)
Place of birth for the foreign-born population - Eritrea (%)
Place of birth for the foreign-born population - Ethiopia (%)
Place of birth for the foreign-born population - Kenya (%)
Place of birth for the foreign-born population - Somalia (%)
Place of birth for the foreign-born population - Uganda (%)
Place of birth for the foreign-born population - Zimbabwe (%)
Place of birth for the foreign-born population - Other Eastern Africa (%)
Place of birth for the foreign-born population - Cameroon (%)
Place of birth for the foreign-born population - Congo (%)
Place of birth for the foreign-born population - Democratic Republic of Congo (Zaire) (%)
Place of birth for the foreign-born population - Other Middle Africa (%)
Place of birth for the foreign-born population - Egypt (%)
Place of birth for the foreign-born population - Morocco (%)
Place of birth for the foreign-born population - Sudan (%)
Place of birth for the foreign-born population - Other Northern Africa (%)
Place of birth for the foreign-born population - South Africa (%)
Place of birth for the foreign-born population - Other Southern Africa (%)
Place of birth for the foreign-born population - Cabo Verde (%)
Place of birth for the foreign-born population - Ghana (%)
Place of birth for the foreign-born population - Liberia (%)
Place of birth for the foreign-born population - Nigeria (%)
Place of birth for the foreign-born population - Senegal (%)
Place of birth for the foreign-born population - Sierra Leone (%)
Place of birth for the foreign-born population - Other Western Africa (%)
Place of birth for the foreign-born population - Australia (%)
Place of birth for the foreign-born population - New Zealand (%)
Place of birth for the foreign-born population - Fiji (%)
Place of birth for the foreign-born population - Micronesia (%)
Place of birth for the foreign-born population - Bahamas (%)
Place of birth for the foreign-born population - Barbados (%)
Place of birth for the foreign-born population - Cuba (%)
Place of birth for the foreign-born population - Dominica (%)
Place of birth for the foreign-born population - Dominican Republic (%)
Place of birth for the foreign-born population - Grenada (%)
Place of birth for the foreign-born population - Haiti (%)
Place of birth for the foreign-born population - Jamaica (%)
Place of birth for the foreign-born population - St. Vincent and the Grenadines (%)
Place of birth for the foreign-born population - Trinidad and Tobago (%)
Place of birth for the foreign-born population - West Indies (%)
Place of birth for the foreign-born population - Other Caribbean (%)
Place of birth for the foreign-born population - Belize (%)
Place of birth for the foreign-born population - Costa Rica (%)
Place of birth for the foreign-born population - El Salvador (%)
Place of birth for the foreign-born population - Guatemala (%)
Place of birth for the foreign-born population - Honduras (%)
Place of birth for the foreign-born population - Mexico (%)
Place of birth for the foreign-born population - Nicaragua (%)
Place of birth for the foreign-born population - Panama (%)
Place of birth for the foreign-born population - Other Central America (%)
Place of birth for the foreign-born population - Argentina (%)
Place of birth for the foreign-born population - Bolivia (%)
Place of birth for the foreign-born population - Brazil (%)
Place of birth for the foreign-born population - Chile (%)
Place of birth for the foreign-born population - Colombia (%)
Place of birth for the foreign-born population - Ecuador (%)
Place of birth for the foreign-born population - Guyana (%)
Place of birth for the foreign-born population - Peru (%)
Place of birth for the foreign-born population - Uruguay (%)
Place of birth for the foreign-born population - Venezuela (%)
Place of birth for the foreign-born population - Other South America (%)
Place of birth for the foreign-born population - Canada (%)
Place of birth for the foreign-born population - Other Northern America (%)
Place of birth for the foreign-born population - Other (%)
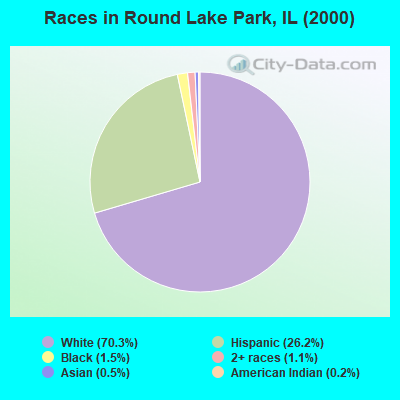
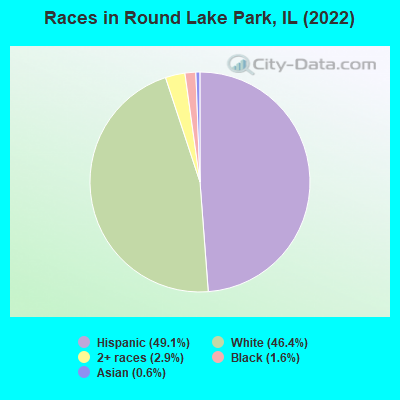
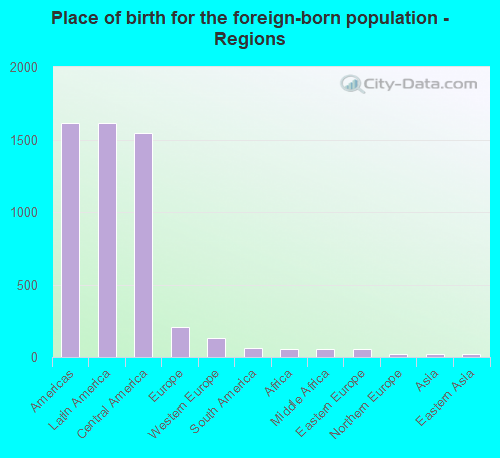
According to 2022 data, the most numerous races in Round Lake Park, IL are White alone (3,589 residents), Hispanic (3,798 residents), and Black alone (122 residents). 59.9% of Round Lake Park residents speak English at home. 24.6% of Round Lake Park, IL residents are foreign-born (20.6% born in Latin America, 2.7% born in Europe), which is 43.0% greater than the foreign-born rate of 14.0% across the entire state of Illinois.
Race distribution in Round Lake Park
2000 2022
8,424,140 67.8% White alone 1,856,152 14.9% Black alone 1,530,262 12.3% Hispanic 419,916 3.4% Asian alone 153,996 1.2% Two or more races 13,479 0.1% Other race alone 18,232 0.1% American Indian alone 3,116 0.03% Native Hawaiian and Other
7,356,301 58.5% White alone 2,299,726 18.3% Hispanic 1,660,423 13.2% Black alone 747,296 5.9% Asian alone 458,599 3.6% Two or more races 45,386 0.4% Other race alone 10,405 0.08% American Indian alone 3,896 0.03% Native Hawaiian and Other
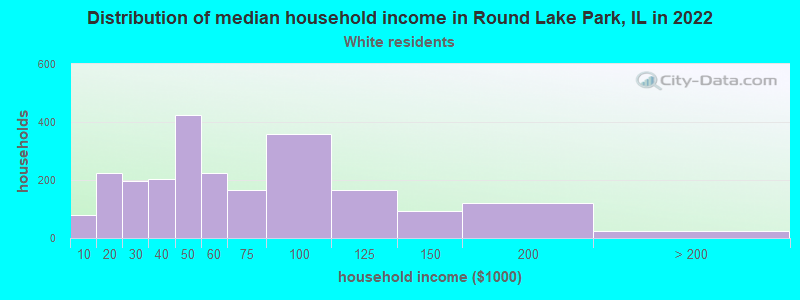
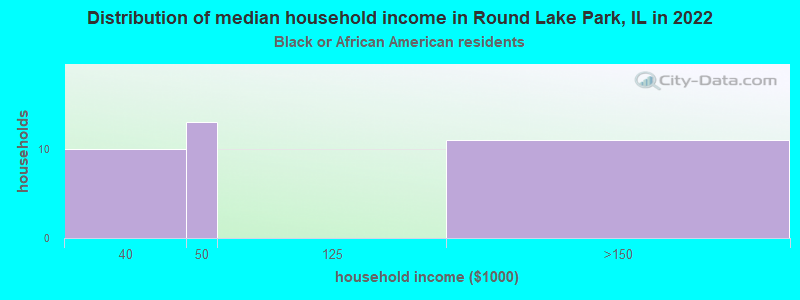
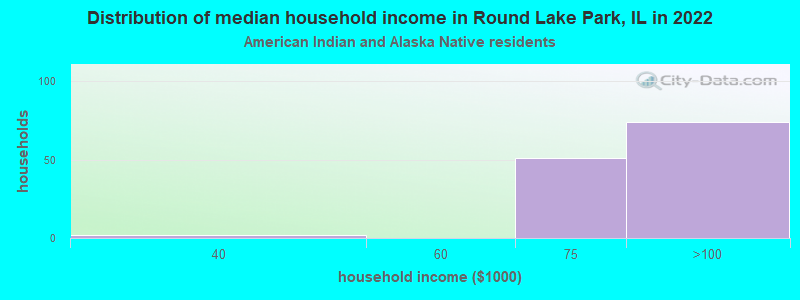
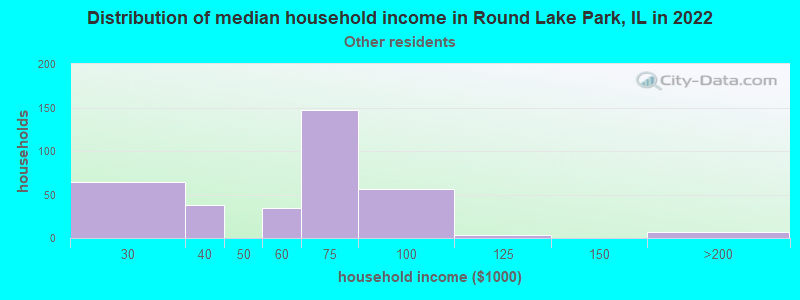
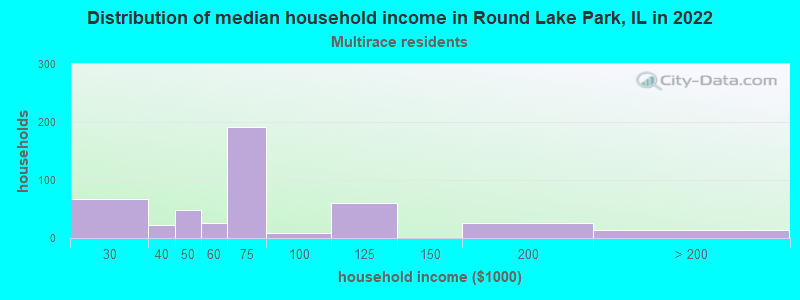
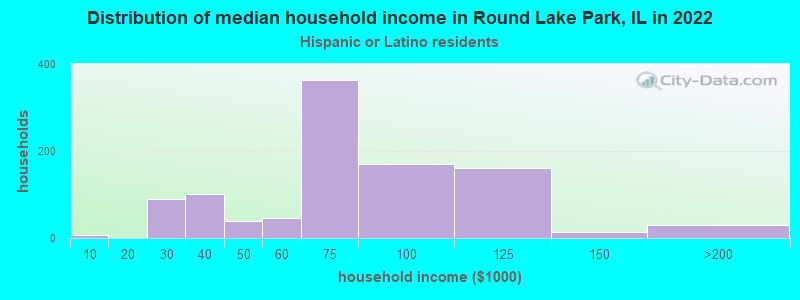
Income and house value in Round Lake Park Median household income in 2022 $46,676 White non-Hispanic householders$78,227 American Indian and Alaska Native householders$69,403 Some other race householders$66,050 Two or more races householders$69,567 Hispanic or Latino race householdersMedian 2022 house value $151,077 White Non-Hispanic householders$212,924 Black or African American householders$129,720 American Indian or Alaska Native householders $180,166 Asian householders$165,229 Some other race householders$147,409 Two or more races householders$150,422 Hispanic or Latino householders
Median age by race in Round Lake Park
63.3 Median age for White residents60.7 65.7 36.1 Median age for Black or African American residents33.2 -712,990,935.8 35.0 Median age for American Indian / Alaska Native residents10.0 -638,251,365.5 -677,083,332.7 Median age for Asian residents-680,776,013.4 -678,663,238.4 -593,236,714.4 Median age for Native Hawaiian / Pacific Islander residents-658,536,584.7 -576,015,108.0 35.1 Median age for Other race residents38.6 35.1 25.4 Median age for Two or more races residents25.1 25.7 69.5 Median age for White alone residents69.4 70.2 25.1 Median age for Hispanic or Latino residents23.7 25.5
Owner/renter occupied households by race in Round Lake Park
House owners and renters - White residents 1,979 87.5% Owner occupied282 12.5% Renter occupiedHouse owners and renters - Black or African American residents 22 57.0% Owner occupied17 43.0% Renter occupiedHouse owners and renters - American Indian / Alaska Native residents 103 100.0% Owner occupiedHouse owners and renters - Asian residents 22 100.0% Owner occupiedHouse owners and renters - Other race residents 226 70.4% Owner occupied95 29.6% Renter occupiedHouse owners and renters - Two or more races residents 212 53.8% Owner occupied181 46.2% Renter occupiedHouse owners and renters - White alone residents 1,867 91.9% Owner occupied164 8.1% Renter occupiedHouse owners and renters - Hispanic or Latino residents 603 61.7% Owner occupied375 38.3% Renter occupied
Language usage in Round Lake Park
English speakers - Total 59.9% of residents of Round Lake Park speak English at home.
38.5% of residents speak Spanish at home 1,505 52.9% Speak English very well1,340 47.1% Speak English less than very well1.9% of residents speak other language at home 40 28.6% Speak English very well100 71.4% Speak English less than very well
English speakers - Born in the United States 97.8% of residents of Round Lake Park speak English at home.
1.8% of residents speak Spanish at home 19 100.0% Speak English very well
English speakers - Native, born elsewhere 0.0% of residents of Round Lake Park speak English at home.
103.7% of residents speak Spanish at home 65 76.5% Speak English very well20 23.5% Speak English less than very well
English speakers - Foreign-born 11.5% of residents of Round Lake Park speak English at home.
83.9% of residents speak Spanish at home 378 22.7% Speak English very well1,285 77.3% Speak English less than very well6.4% of residents speak other language at home 24 19.0% Speak English very well102 81.0% Speak English less than very well
White (Caucasian) - Speak only English Native:
91.5% (3,615)Foreign-born:
13.0% (62)
White (Caucasian) - Speak another language Native:
7.7% (303)Foreign-born:
82.0% (390)
American Indian / Alaska Native - Speak another language Native:
95.3% (132)Foreign-born:
100.0% (222)
Other race - Speak only English Native:
17.4% (106)Foreign-born:
16.2% (142)
Other race - Speak another language Native:
80.0% (489)Foreign-born:
85.8% (753)
Two or more races - Speak only English Native:
54.7% (385)Foreign-born:
20.3% (102)
Two or more races - Speak another language Native:
45.2% (318)Foreign-born:
77.2% (388)
White alone - Speak only English Native:
98.8% (3,426)Foreign-born:
46.2% (50)
White alone - Speak another language Native:
1.4% (50)Foreign-born:
54.8% (59)
Hispanic or Latino - Speak only English Native:
31.6% (538)Foreign-born:
7.8% (137)
Hispanic or Latino - Speak another language Native:
68.1% (1,161)Foreign-born:
92.2% (1,624)
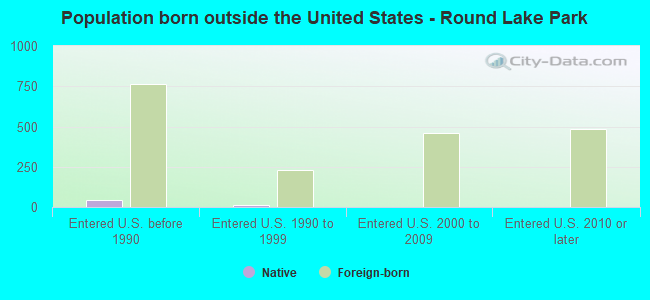
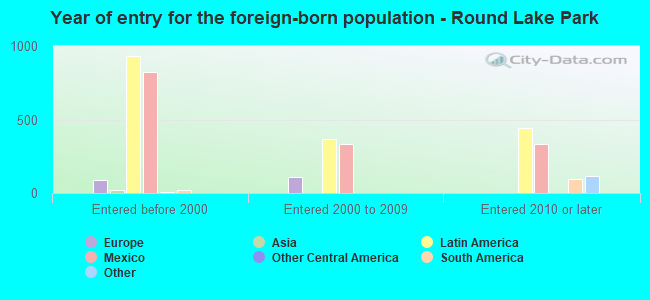
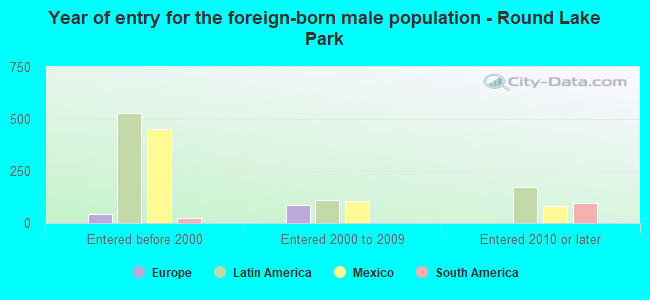
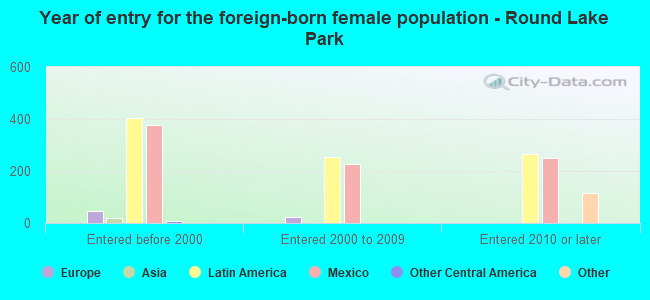
Foreign-born residents in Round Lake Park 1,899 residents are foreign born (20.6% Latin America , 2.7% Europe ).
This city:
24.6%Illinois:
14.1%
Marital status for residents in Round Lake Park Marital status - White (Caucasian) population 15 years and over
Males 22.6% Never married54.9% Now married0.0% Separated12.3% Widowed10.2% DivorcedFemales 20.4% Never married49.9% Now married3.1% Separated11.3% Widowed15.3% DivorcedWomen who gave birth in the past 12 months Now married:
100.0% (24)Unmarried:
0.0% (0)
Women who did not give birth in the past 12 months Now married:
41.2% (234)Unmarried:
58.8% (333)
Marital status - Black or African American population 15 years and over
Males 29.7% Never married70.3% Now married0.0% Separated0.0% Widowed0.0% DivorcedFemales 100.0% Never married0.0% Now married0.0% Separated0.0% Widowed0.0% DivorcedWomen who did not give birth in the past 12 months Now married:
0.0% (0)Unmarried:
100.0% (14)
Marital status - American Indian / Alaska Native population 15 years and over
Males 0.0% Never married42.0% Now married0.0% Separated0.0% Widowed58.0% DivorcedFemales 0.0% Never married38.7% Now married0.0% Separated0.0% Widowed61.3% DivorcedWomen who did not give birth in the past 12 months Now married:
38.7% (40)Unmarried:
61.3% (63)
Marital status - Other race population 15 years and over
Males 22.3% Never married63.0% Now married0.0% Separated0.0% Widowed14.7% DivorcedFemales 35.9% Never married41.1% Now married0.0% Separated4.5% Widowed18.6% DivorcedWomen who did not give birth in the past 12 months Now married:
43.3% (217)Unmarried:
56.7% (285)
Marital status - Two or more races population 15 years and over
Males 67.4% Never married16.3% Now married0.0% Separated0.0% Widowed16.3% DivorcedFemales 39.8% Never married24.7% Now married0.0% Separated0.0% Widowed35.5% DivorcedWomen who did not give birth in the past 12 months Now married:
19.2% (57)Unmarried:
80.8% (240)
Marital status - White alone, not Hispanic / Latino population 15 years and over
Males 20.4% Never married51.2% Now married0.0% Separated15.5% Widowed12.9% DivorcedFemales 17.0% Never married46.3% Now married3.2% Separated14.2% Widowed19.3% DivorcedWomen who did not give birth in the past 12 months Now married:
27.7% (82)Unmarried:
72.3% (214)
Marital status - Hispanic or Latino population 15 years and over
Males 34.7% Never married52.3% Now married0.0% Separated0.0% Widowed13.0% DivorcedFemales 34.1% Never married46.3% Now married0.9% Separated2.4% Widowed16.3% DivorcedWomen who gave birth in the past 12 months Now married:
100.0% (28)Unmarried:
0.0% (0)
Women who did not give birth in the past 12 months Now married:
43.1% (467)Unmarried:
56.9% (617)
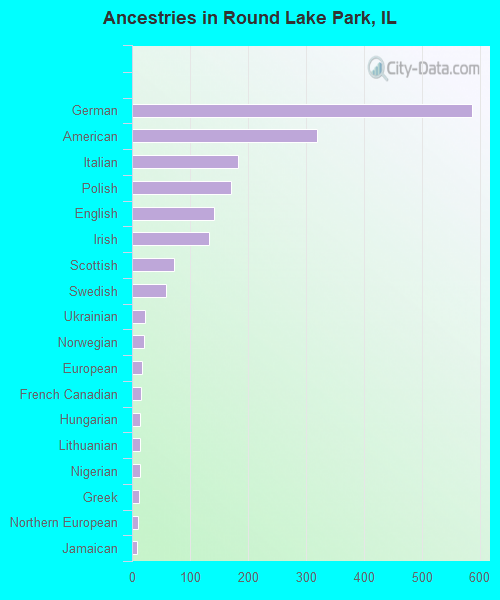
Ancestries in Round Lake Park
586 14.0% German318 7.6% American183 4.4% Italian170 4.1% Polish141 3.4% English132 3.2% Irish72 1.7% Scottish58 1.4% Swedish22 0.5% Ukrainian20 0.5% Norwegian18 0.4% European16 0.4% French Canadian14 0.3% Hungarian14 0.3% Lithuanian13 0.3% Nigerian12 0.3% Greek11 0.3% Northern European8 0.2% Jamaican4 0.10% Scotch-Irish
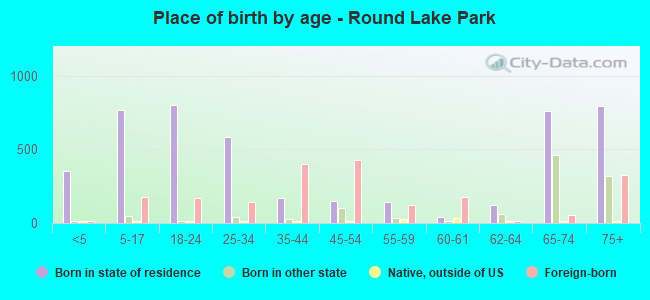
Children Nativity (place of birth) in Round Lake Park
Children under 6 years - Living with two parents Both parents native 48 100.0% NativeBoth parents foreign-born 83 100.0% NativeOne native, one foreign-born parent 43 100.0% NativeChildren under 6 years - Living with one parent Native parent 62 100.0% NativeForeign-born parent 144 100.0% NativeChildren 6 to 17 years - Living with two parents Both parents native 36 100.0% NativeBoth parents foreign-born 236 57.1% Native177 42.9% Foreign-bornOne native, one foreign-born parent 121 100.0% NativeChildren 6 to 17 years - Living with one parent Native parent 180 100.0% NativeForeign-born parent 105 51.8% Native97 48.2% Foreign-born
Grandparents responsible for own grandchildren in Round Lake Park
Grandparents (30 to 59 years) White / Caucasian 175 92.0% Responsible for grandchildren15 8.0% Not responsible for grandchildrenWhite alone, not Hispanic / Latino 118 88.0% Responsible for grandchildren16 12.0% Not responsible for grandchildrenHispanic or Latino 63 100.0% Responsible for grandchildren
Grandparents (60 years and over) White / Caucasian 6 100.0% Not responsible for grandchildrenWhite alone, not Hispanic / Latino 9 100.0% Not responsible for grandchildren