Races in Rutherford, New Jersey (NJ) Detailed Stats
Data:
Races - White alone (%)
Races - White alone (% change since 2000)
Races - Black alone (%)
Races - Black alone (% change since 2000)
Races - American Indian alone (%)
Races - American Indian alone (% change since 2000)
Races - Asian alone (%)
Races - Asian alone (% change since 2000)
Races - Hispanic (%)
Races - Hispanic (% change since 2000)
Races - Native Hawaiian and Other Pacific Islander alone (%)
Races - Native Hawaiian and Other Pacific Islander alone (% change since 2000)
Races - Two or more races(%)
Races - Two or more races(% change since 2000)
Races - Other race alone (%)
Races - Other race alone (% change since 2000)
Racial diversity
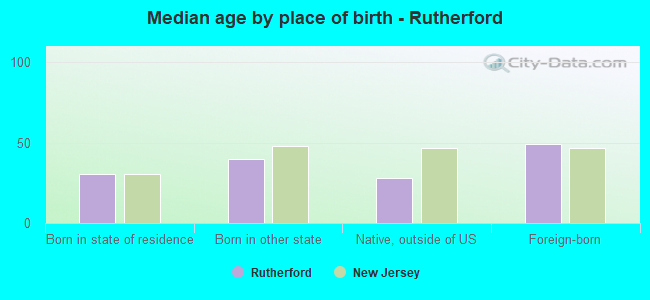
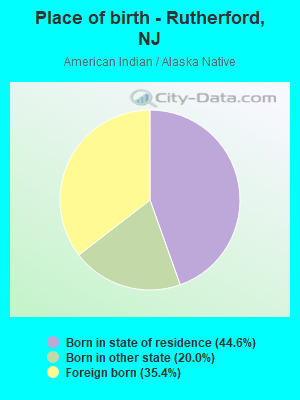
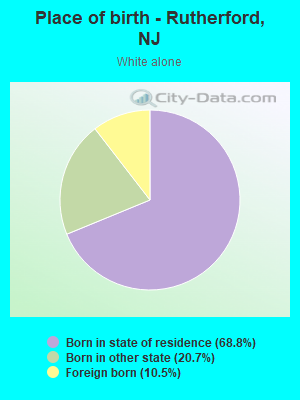
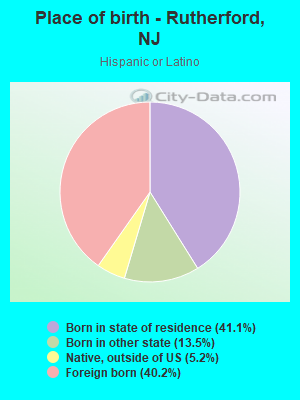
Place of birth - Born in state of residence (%)
Place of birth - Born in state of residence (%) - White
Place of birth - Born in state of residence (%) - Black or African American
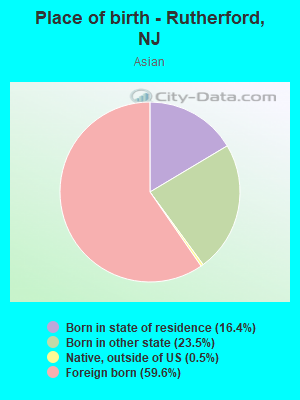
Place of birth - Born in state of residence (%) - Asian
Place of birth - Born in state of residence (%) - Hispanic or Latino
Place of birth - Born in state of residence (%) - American Indian and Alaska Native
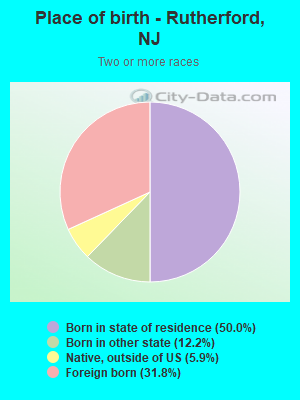
Place of birth - Born in state of residence (%) - Multirace
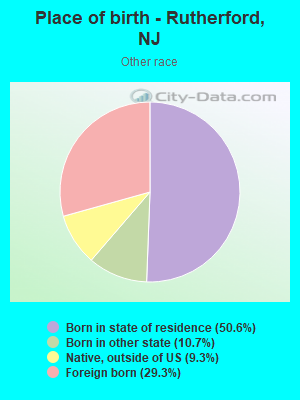
Place of birth - Born in state of residence (%) - Other Race
Place of birth - Born in other state (%)
Place of birth - Born in other state (%) - White
Place of birth - Born in other state (%) - Black or African American
Place of birth - Born in other state (%) - Asian
Place of birth - Born in other state (%) - Hispanic or Latino
Place of birth - Born in other state (%) - American Indian and Alaska Native
Place of birth - Born in other state (%) - Multirace
Place of birth - Born in other state (%) - Other Race
Place of birth - Native, outside of US (%)
Place of birth - Native, outside of US (%) - White
Place of birth - Native, outside of US (%) - Black or African American
Place of birth - Native, outside of US (%) - Asian
Place of birth - Native, outside of US (%) - Hispanic or Latino
Place of birth - Native, outside of US (%) - American Indian and Alaska Native
Place of birth - Native, outside of US (%) - Multirace
Place of birth - Native, outside of US (%) - Other Race
Place of birth - Foreign born (%)
Place of birth - Foreign born (%) - White
Place of birth - Foreign born (%) - Black or African American
Place of birth - Foreign born (%) - Asian
Place of birth - Foreign born (%) - Hispanic or Latino
Place of birth - Foreign born (%) - American Indian and Alaska Native
Place of birth - Foreign born (%) - Multirace
Place of birth - Foreign born (%) - Other Race
Residents speaking English at home (%)
Residents speaking English at home - Born in the United States (%)
Residents speaking English at home - Native, born elsewhere (%)
Residents speaking English at home - Foreign born (%)
Residents speaking Spanish at home (%)
Residents speaking Spanish at home - Born in the United States (%)
Residents speaking Spanish at home - Native, born elsewhere (%)
Residents speaking Spanish at home - Foreign born (%)
Residents speaking other language at home (%)
Residents speaking other language at home - Born in the United States (%)
Residents speaking other language at home - Native, born elsewhere (%)
Residents speaking other language at home - Foreign born (%)
Marital status - Never married (%)
Marital status - Now married (%)
Marital status - Separated (%)
Marital status - Widowed (%)
Marital status - Divorced (%)
Ancestries Reported - Arab (%)
Ancestries Reported - Czech (%)
Ancestries Reported - Danish (%)
Ancestries Reported - Dutch (%)
Ancestries Reported - English (%)
Ancestries Reported - French (%)
Ancestries Reported - French Canadian (%)
Ancestries Reported - German (%)
Ancestries Reported - Greek (%)
Ancestries Reported - Hungarian (%)
Ancestries Reported - Irish (%)
Ancestries Reported - Italian (%)
Ancestries Reported - Lithuanian (%)
Ancestries Reported - Norwegian (%)
Ancestries Reported - Polish (%)
Ancestries Reported - Portuguese (%)
Ancestries Reported - Russian (%)
Ancestries Reported - Scotch-Irish (%)
Ancestries Reported - Scottish (%)
Ancestries Reported - Slovak (%)
Ancestries Reported - Subsaharan African (%)
Ancestries Reported - Swedish (%)
Ancestries Reported - Swiss (%)
Ancestries Reported - Ukrainian (%)
Ancestries Reported - United States (%)
Ancestries Reported - Welsh (%)
Ancestries Reported - West Indian (%)
Ancestries Reported - Other (%)
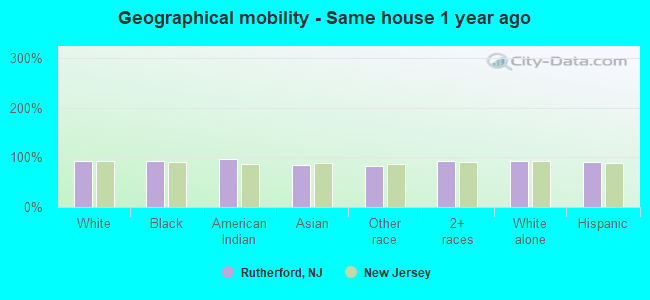
Geographical mobility - Same house 1 year ago (%)
Geographical mobility - Same house 1 year ago (%) - White
Geographical mobility - Same house 1 year ago (%) - Black or African American
Geographical mobility - Same house 1 year ago (%) - Asian
Geographical mobility - Same house 1 year ago (%) - Hispanic or Latino
Geographical mobility - Same house 1 year ago (%) - American Indian and Alaska Native
Geographical mobility - Same house 1 year ago (%) - Multirace
Geographical mobility - Same house 1 year ago (%) - Other Race
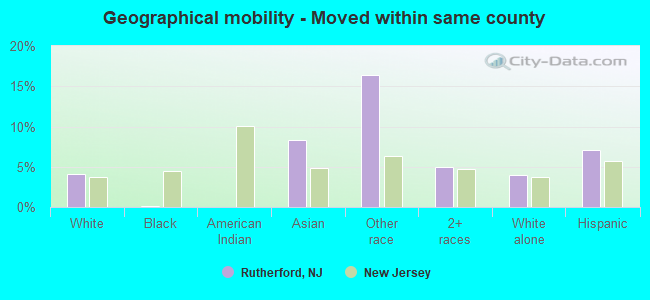
Geographical mobility - Moved within same county (%)
Geographical mobility - Moved within same county (%) - White
Geographical mobility - Moved within same county (%) - Black or African American
Geographical mobility - Moved within same county (%) - Asian
Geographical mobility - Moved within same county (%) - Hispanic or Latino
Geographical mobility - Moved within same county (%) - American Indian and Alaska Native
Geographical mobility - Moved within same county (%) - Multirace
Geographical mobility - Moved within same county (%) - Other Race
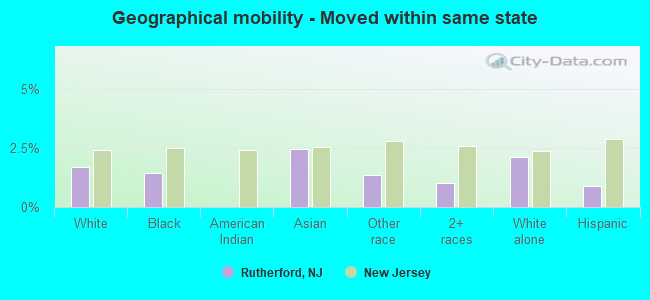
Geographical mobility - Moved from different county within same state (%)
Geographical mobility - Moved from different county within same state (%) - White
Geographical mobility - Moved from different county within same state (%) - Black or African American
Geographical mobility - Moved from different county within same state (%) - Asian
Geographical mobility - Moved from different county within same state (%) - Hispanic or Latino
Geographical mobility - Moved from different county within same state (%) - American Indian and Alaska Native
Geographical mobility - Moved from different county within same state (%) - Multirace
Geographical mobility - Moved from different county within same state (%) - Other Race
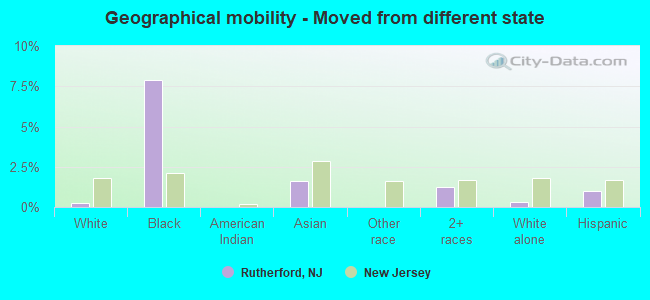
Geographical mobility - Moved from different state (%)
Geographical mobility - Moved from different state (%) - White
Geographical mobility - Moved from different state (%) - Black or African American
Geographical mobility - Moved from different state (%) - Asian
Geographical mobility - Moved from different state (%) - Hispanic or Latino
Geographical mobility - Moved from different state (%) - American Indian and Alaska Native
Geographical mobility - Moved from different state (%) - Multirace
Geographical mobility - Moved from different state (%) - Other Race
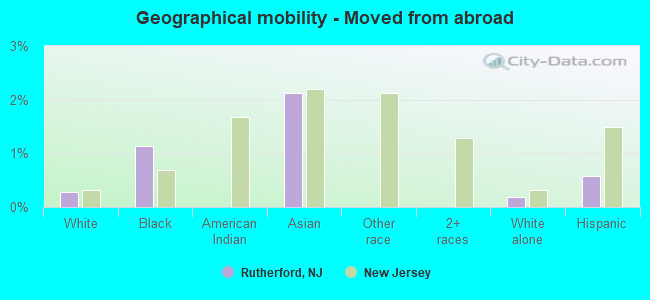
Geographical mobility - Moved from abroad (%)
Geographical mobility - Moved from abroad (%) - White
Geographical mobility - Moved from abroad (%) - Black or African American
Geographical mobility - Moved from abroad (%) - Asian
Geographical mobility - Moved from abroad (%) - Hispanic or Latino
Geographical mobility - Moved from abroad (%) - American Indian and Alaska Native
Geographical mobility - Moved from abroad (%) - Multirace
Geographical mobility - Moved from abroad (%) - Other Race
Place of birth for the foreign-born population - Ireland (%)
Place of birth for the foreign-born population - Denmark (%)
Place of birth for the foreign-born population - Norway (%)
Place of birth for the foreign-born population - Sweden (%)
Place of birth for the foreign-born population - United Kingdom (%)
Place of birth for the foreign-born population - England (%)
Place of birth for the foreign-born population - Scotland (%)
Place of birth for the foreign-born population - Other Northern Europe (%)
Place of birth for the foreign-born population - Austria (%)
Place of birth for the foreign-born population - Belgium (%)
Place of birth for the foreign-born population - France (%)
Place of birth for the foreign-born population - Germany (%)
Place of birth for the foreign-born population - Netherlands (%)
Place of birth for the foreign-born population - Switzerland (%)
Place of birth for the foreign-born population - Other Western Europe (%)
Place of birth for the foreign-born population - Greece (%)
Place of birth for the foreign-born population - Italy (%)
Place of birth for the foreign-born population - Portugal (%)
Place of birth for the foreign-born population - Spain (%)
Place of birth for the foreign-born population - Other Southern Europe (%)
Place of birth for the foreign-born population - Albania (%)
Place of birth for the foreign-born population - Belarus (%)
Place of birth for the foreign-born population - Bosnia and Herzegovina (%)
Place of birth for the foreign-born population - Bulgaria (%)
Place of birth for the foreign-born population - Croatia (%)
Place of birth for the foreign-born population - Czechoslovakia (%)
Place of birth for the foreign-born population - Hungary (%)
Place of birth for the foreign-born population - Latvia (%)
Place of birth for the foreign-born population - Lithuania (%)
Place of birth for the foreign-born population - North Macedonia (Macedonia) (%)
Place of birth for the foreign-born population - Moldova (%)
Place of birth for the foreign-born population - Poland (%)
Place of birth for the foreign-born population - Romania (%)
Place of birth for the foreign-born population - Russia (%)
Place of birth for the foreign-born population - Serbia (%)
Place of birth for the foreign-born population - Ukraine (%)
Place of birth for the foreign-born population - Other Eastern Europe (%)
Place of birth for the foreign-born population - China (%)
Place of birth for the foreign-born population - Hong Kong (%)
Place of birth for the foreign-born population - Taiwan (%)
Place of birth for the foreign-born population - Japan (%)
Place of birth for the foreign-born population - Korea (%)
Place of birth for the foreign-born population - Other Eastern Asia (%)
Place of birth for the foreign-born population - Afghanistan (%)
Place of birth for the foreign-born population - Bangladesh (%)
Place of birth for the foreign-born population - India (%)
Place of birth for the foreign-born population - Iran (%)
Place of birth for the foreign-born population - Kazakhstan (%)
Place of birth for the foreign-born population - Nepal (%)
Place of birth for the foreign-born population - Pakistan (%)
Place of birth for the foreign-born population - Sri Lanka (%)
Place of birth for the foreign-born population - Uzbekistan (%)
Place of birth for the foreign-born population - Other South Central Asia (%)
Place of birth for the foreign-born population - Burma (%)
Place of birth for the foreign-born population - Cambodia (%)
Place of birth for the foreign-born population - Indonesia (%)
Place of birth for the foreign-born population - Laos (%)
Place of birth for the foreign-born population - Malaysia (%)
Place of birth for the foreign-born population - Philippines (%)
Place of birth for the foreign-born population - Singapore (%)
Place of birth for the foreign-born population - Thailand (%)
Place of birth for the foreign-born population - Vietnam (%)
Place of birth for the foreign-born population - Other South Eastern Asia (%)
Place of birth for the foreign-born population - Armenia (%)
Place of birth for the foreign-born population - Iraq (%)
Place of birth for the foreign-born population - Israel (%)
Place of birth for the foreign-born population - Jordan (%)
Place of birth for the foreign-born population - Kuwait (%)
Place of birth for the foreign-born population - Lebanon (%)
Place of birth for the foreign-born population - Saudi Arabia (%)
Place of birth for the foreign-born population - Syria (%)
Place of birth for the foreign-born population - Turkey (%)
Place of birth for the foreign-born population - Yemen (%)
Place of birth for the foreign-born population - Other Western Asia (%)
Place of birth for the foreign-born population - Eritrea (%)
Place of birth for the foreign-born population - Ethiopia (%)
Place of birth for the foreign-born population - Kenya (%)
Place of birth for the foreign-born population - Somalia (%)
Place of birth for the foreign-born population - Uganda (%)
Place of birth for the foreign-born population - Zimbabwe (%)
Place of birth for the foreign-born population - Other Eastern Africa (%)
Place of birth for the foreign-born population - Cameroon (%)
Place of birth for the foreign-born population - Congo (%)
Place of birth for the foreign-born population - Democratic Republic of Congo (Zaire) (%)
Place of birth for the foreign-born population - Other Middle Africa (%)
Place of birth for the foreign-born population - Egypt (%)
Place of birth for the foreign-born population - Morocco (%)
Place of birth for the foreign-born population - Sudan (%)
Place of birth for the foreign-born population - Other Northern Africa (%)
Place of birth for the foreign-born population - South Africa (%)
Place of birth for the foreign-born population - Other Southern Africa (%)
Place of birth for the foreign-born population - Cabo Verde (%)
Place of birth for the foreign-born population - Ghana (%)
Place of birth for the foreign-born population - Liberia (%)
Place of birth for the foreign-born population - Nigeria (%)
Place of birth for the foreign-born population - Senegal (%)
Place of birth for the foreign-born population - Sierra Leone (%)
Place of birth for the foreign-born population - Other Western Africa (%)
Place of birth for the foreign-born population - Australia (%)
Place of birth for the foreign-born population - New Zealand (%)
Place of birth for the foreign-born population - Fiji (%)
Place of birth for the foreign-born population - Micronesia (%)
Place of birth for the foreign-born population - Bahamas (%)
Place of birth for the foreign-born population - Barbados (%)
Place of birth for the foreign-born population - Cuba (%)
Place of birth for the foreign-born population - Dominica (%)
Place of birth for the foreign-born population - Dominican Republic (%)
Place of birth for the foreign-born population - Grenada (%)
Place of birth for the foreign-born population - Haiti (%)
Place of birth for the foreign-born population - Jamaica (%)
Place of birth for the foreign-born population - St. Vincent and the Grenadines (%)
Place of birth for the foreign-born population - Trinidad and Tobago (%)
Place of birth for the foreign-born population - West Indies (%)
Place of birth for the foreign-born population - Other Caribbean (%)
Place of birth for the foreign-born population - Belize (%)
Place of birth for the foreign-born population - Costa Rica (%)
Place of birth for the foreign-born population - El Salvador (%)
Place of birth for the foreign-born population - Guatemala (%)
Place of birth for the foreign-born population - Honduras (%)
Place of birth for the foreign-born population - Mexico (%)
Place of birth for the foreign-born population - Nicaragua (%)
Place of birth for the foreign-born population - Panama (%)
Place of birth for the foreign-born population - Other Central America (%)
Place of birth for the foreign-born population - Argentina (%)
Place of birth for the foreign-born population - Bolivia (%)
Place of birth for the foreign-born population - Brazil (%)
Place of birth for the foreign-born population - Chile (%)
Place of birth for the foreign-born population - Colombia (%)
Place of birth for the foreign-born population - Ecuador (%)
Place of birth for the foreign-born population - Guyana (%)
Place of birth for the foreign-born population - Peru (%)
Place of birth for the foreign-born population - Uruguay (%)
Place of birth for the foreign-born population - Venezuela (%)
Place of birth for the foreign-born population - Other South America (%)
Place of birth for the foreign-born population - Canada (%)
Place of birth for the foreign-born population - Other Northern America (%)
Place of birth for the foreign-born population - Other (%)
Latest news about races in Rutherford, NJ collected exclusively by city-data.com from local newspapers, TV, and radio stations
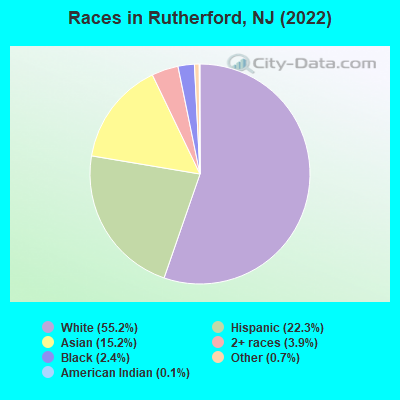
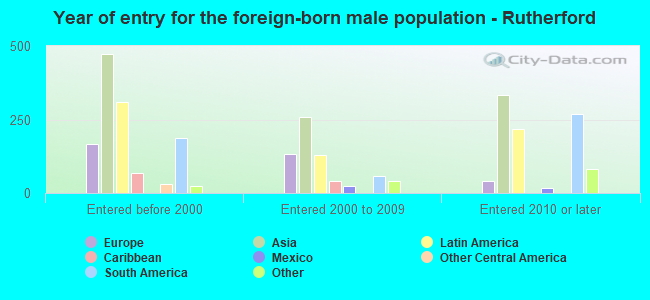
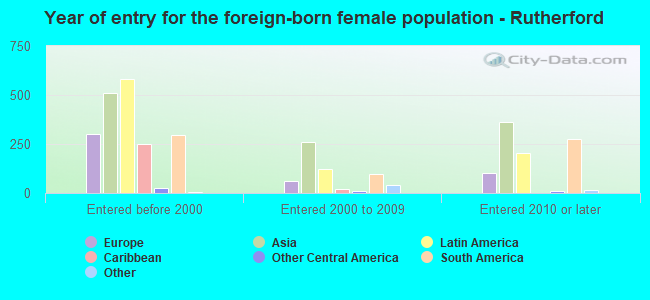
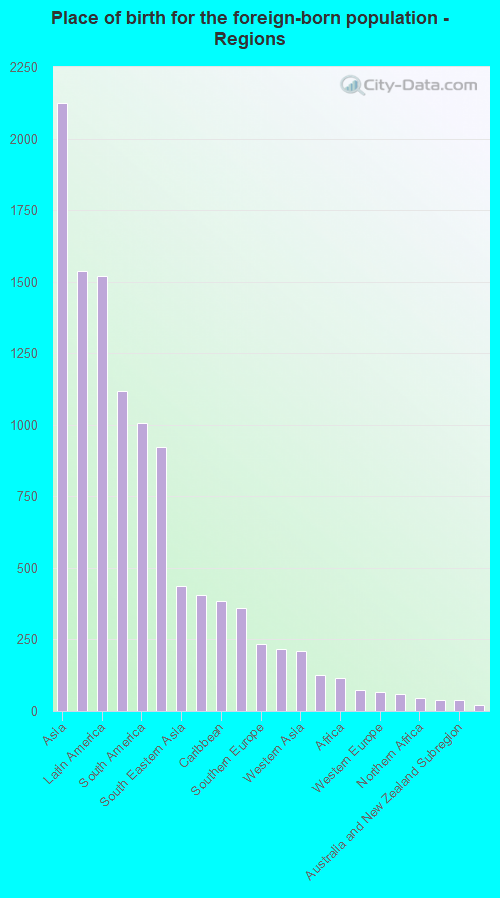
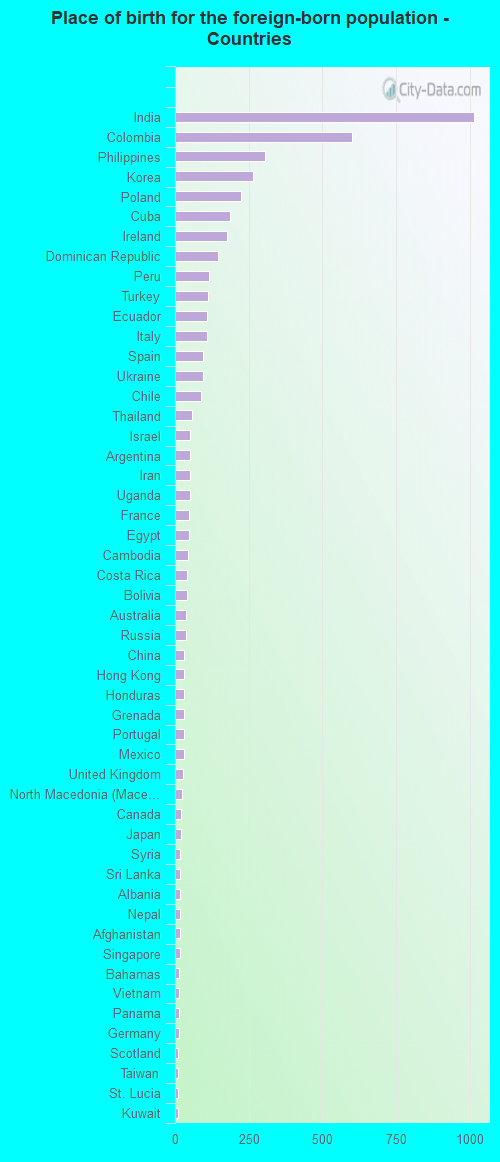
According to 2022 data, the most numerous races in Rutherford, NJ are White alone (10,344 residents), Hispanic (4,177 residents), and Black alone (458 residents). 65.1% of Rutherford residents speak English at home. 25.3% of Rutherford, NJ residents are foreign-born (11.0% born in Asia, 7.9% born in Latin America, 4.8% born in Europe), which is 9.1% greater than the foreign-born rate of 23.0% across the entire state of New Jersey.
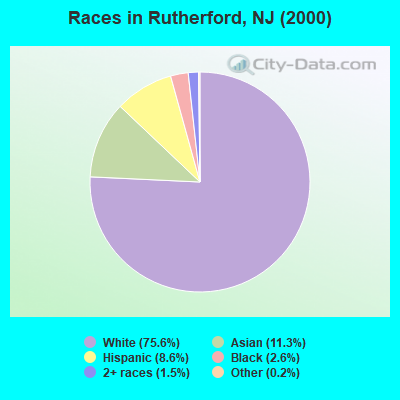
Race distribution in Rutherford
2000 2022
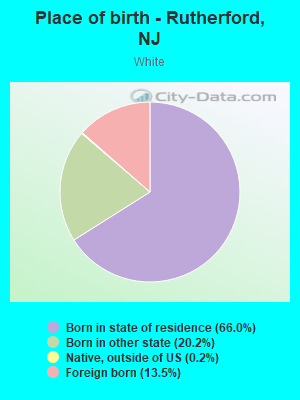
5,557,209 66.0% White alone 1,117,191 13.3% Hispanic 1,096,171 13.0% Black alone 477,012 5.7% Asian alone 133,689 1.6% Two or more races 19,565 0.2% Other race alone 11,338 0.1% American Indian alone 2,175 0.03% Native Hawaiian and Other
4,766,476 51.5% White alone 2,028,470 21.9% Hispanic 1,111,632 12.0% Black alone 923,546 10.0% Asian alone 332,237 3.6% Two or more races 89,847 1.0% Other race alone 8,557 0.09% American Indian alone 934 0.01% Native Hawaiian and Other
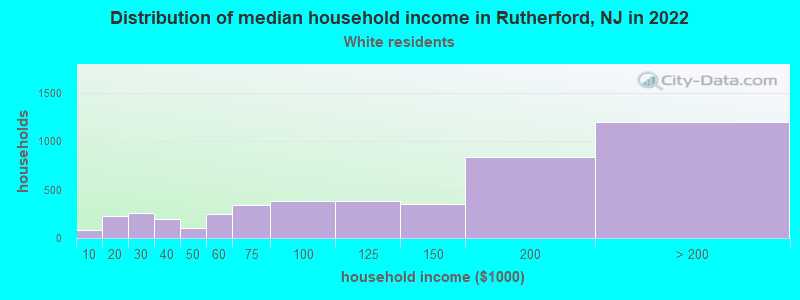
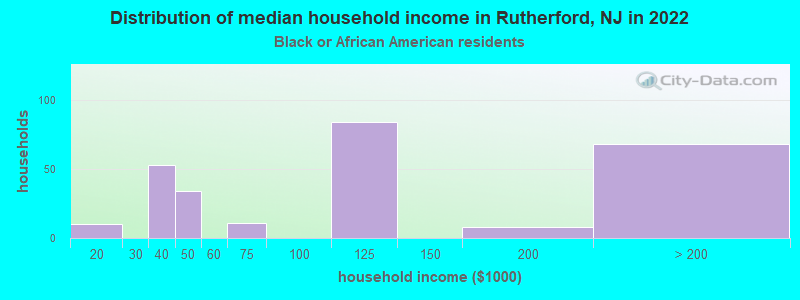
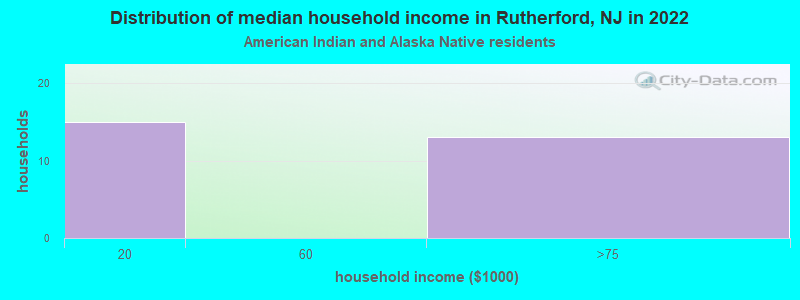
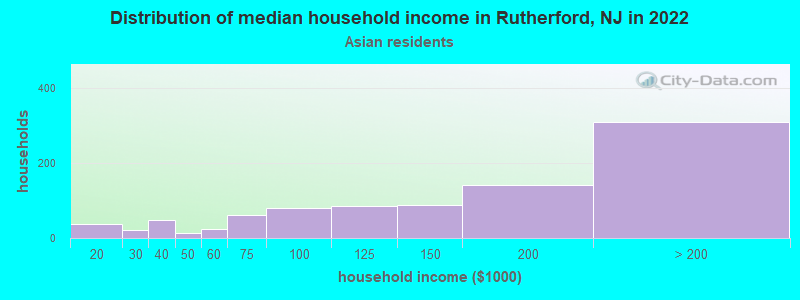
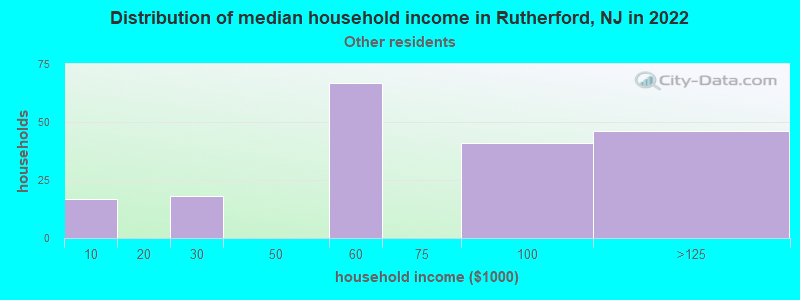
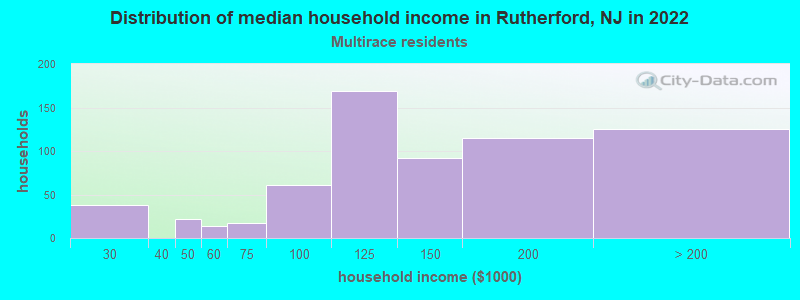
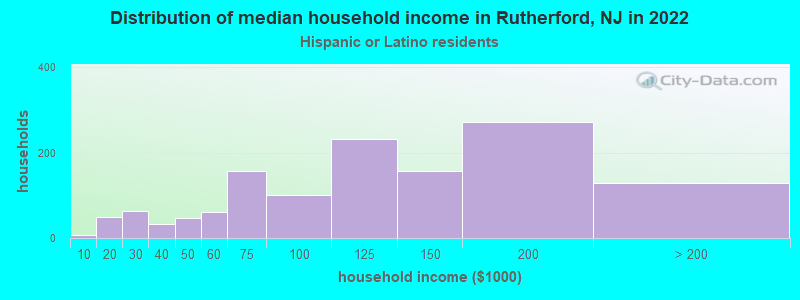
Income and house value in Rutherford Median household income in 2022 $125,622 White non-Hispanic householders$118,673 Black householders$140,128 Asian householders$57,332 Some other race householders$128,965 Two or more races householders$110,926 Hispanic or Latino race householdersMedian 2022 house value $592,439 White Non-Hispanic householders$492,434 Black or African American householders $581,598 Asian householders$521,704 Some other race householders$794,616 Two or more races householders$597,046 Hispanic or Latino householders
Median age by race in Rutherford
44.9 Median age for White residents41.2 48.0 42.2 Median age for Black or African American residents46.2 34.3 56.2 Median age for American Indian / Alaska Native residents49.7 -753,722,794.2 40.9 Median age for Asian residents39.4 43.4 -510,460,250.5 Median age for Native Hawaiian / Pacific Islander residents-514,767,932.0 -713,070,378.3 21.8 Median age for Other race residents17.4 29.3 31.4 Median age for Two or more races residents31.7 36.8 45.5 Median age for White alone residents43.7 46.5 35.5 Median age for Hispanic or Latino residents28.8 41.2
Owner/renter occupied households by race in Rutherford
House owners and renters - White residents 3,099 68.4% Owner occupied1,431 31.6% Renter occupiedHouse owners and renters - Black or African American residents 54 23.9% Owner occupied173 76.1% Renter occupiedHouse owners and renters - American Indian / Alaska Native residents 4 10.2% Owner occupied36 89.8% Renter occupiedHouse owners and renters - Asian residents 594 62.6% Owner occupied355 37.4% Renter occupiedHouse owners and renters - Other race residents 53 26.5% Owner occupied146 73.5% Renter occupiedHouse owners and renters - Two or more races residents 405 62.6% Owner occupied242 37.4% Renter occupiedHouse owners and renters - White alone residents 3,031 71.5% Owner occupied1,205 28.5% Renter occupiedHouse owners and renters - Hispanic or Latino residents 504 39.8% Owner occupied762 60.2% Renter occupied
Language usage in Rutherford
English speakers - Total 65.1% of residents of Rutherford speak English at home.
16.1% of residents speak Spanish at home 2,122 72.6% Speak English very well800 27.4% Speak English less than very well18.2% of residents speak other language at home 2,302 69.8% Speak English very well998 30.2% Speak English less than very well
English speakers - Born in the United States 81.7% of residents of Rutherford speak English at home.
7.9% of residents speak Spanish at home 285 100.0% Speak English very well9.4% of residents speak other language at home 317 92.7% Speak English very well25 7.3% Speak English less than very well
English speakers - Native, born elsewhere 26.6% of residents of Rutherford speak English at home.
79.4% of residents speak Spanish at home 80 40.6% Speak English very well117 59.4% Speak English less than very well2.0% of residents speak other language at home 5 100.0% Speak English very well
English speakers - Foreign-born 19.1% of residents of Rutherford speak English at home.
30.6% of residents speak Spanish at home 847 59.3% Speak English very well581 40.7% Speak English less than very well49.3% of residents speak other language at home 1,403 60.9% Speak English very well900 39.1% Speak English less than very well
White (Caucasian) - Speak only English Native:
94.5% (8,838)Foreign-born:
33.9% (503)
White (Caucasian) - Speak another language Native:
6.6% (618)Foreign-born:
68.9% (1,022)
Black or African American - Speak only English Native:
89.8% (386)Foreign-born:
46.7% (42)
Black or African American - Speak another language Native:
10.2% (44)Foreign-born:
49.3% (44)
American Indian / Alaska Native - Speak another language Native:
81.4% (35)Foreign-born:
100.0% (21)
Asian - Speak only English Native:
39.7% (427)Foreign-born:
16.1% (282)
Asian - Speak another language Native:
60.0% (646)Foreign-born:
83.7% (1,466)
Other race - Speak another language Native:
64.4% (350)Foreign-born:
100.0% (247)
Two or more races - Speak only English Native:
53.8% (995)Foreign-born:
3.5% (33)
Two or more races - Speak another language Native:
46.7% (863)Foreign-born:
97.8% (917)
White alone - Speak only English Native:
95.8% (8,638)Foreign-born:
43.6% (477)
White alone - Speak another language Native:
4.4% (397)Foreign-born:
55.7% (609)
Hispanic or Latino - Speak only English Native:
39.7% (941)Foreign-born:
3.9% (63)
Hispanic or Latino - Speak another language Native:
60.0% (1,422)Foreign-born:
95.3% (1,519)
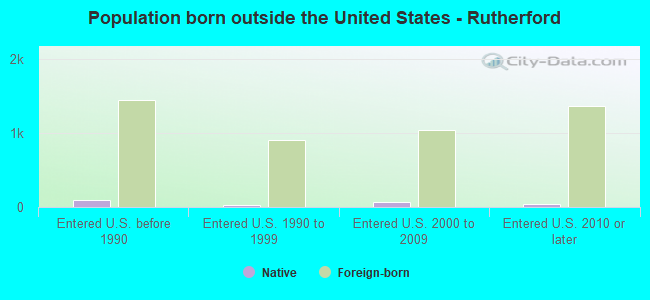
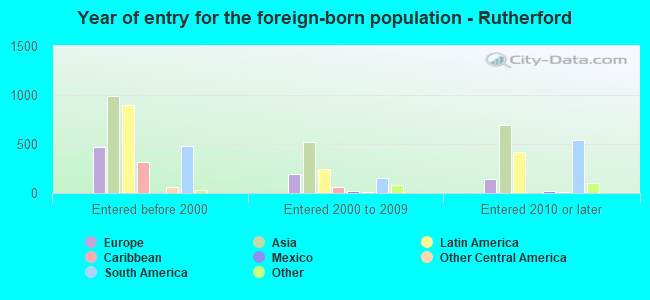
Foreign-born residents in Rutherford 4,744 residents are foreign born (11.0% Asia , 7.9% Latin America , 4.8% Europe ).
This city:
25.3%New Jersey:
23.2%
Marital status for residents in Rutherford Marital status - White (Caucasian) population 15 years and over
Males 41.0% Never married51.8% Now married0.4% Separated1.6% Widowed5.1% DivorcedFemales 31.3% Never married46.7% Now married1.2% Separated9.6% Widowed11.2% DivorcedWomen who gave birth in the past 12 months Now married:
64.4% (46)Unmarried:
35.6% (26)
Women who did not give birth in the past 12 months Now married:
40.3% (950)Unmarried:
59.7% (1,408)
Marital status - Black or African American population 15 years and over
Males 59.9% Never married24.8% Now married0.0% Separated0.0% Widowed15.3% DivorcedFemales 62.8% Never married23.6% Now married0.0% Separated5.6% Widowed8.0% DivorcedWomen who gave birth in the past 12 months Now married:
100.0% (4)Unmarried:
0.0% (0)
Women who did not give birth in the past 12 months Now married:
22.2% (39)Unmarried:
77.8% (137)
Marital status - American Indian / Alaska Native population 15 years and over
Males 44.7% Never married19.1% Now married0.0% Separated0.0% Widowed36.2% DivorcedFemales 0.0% Never married0.0% Now married0.0% Separated0.0% Widowed100.0% DivorcedMarital status - Asian population 15 years and over
Males 38.9% Never married58.9% Now married0.0% Separated0.0% Widowed2.2% DivorcedFemales 24.6% Never married69.0% Now married0.0% Separated3.4% Widowed3.0% DivorcedWomen who gave birth in the past 12 months Now married:
100.0% (40)Unmarried:
0.0% (0)
Women who did not give birth in the past 12 months Now married:
66.5% (517)Unmarried:
33.5% (261)
Marital status - Other race population 15 years and over
Males 58.4% Never married41.6% Now married0.0% Separated0.0% Widowed0.0% DivorcedFemales 39.4% Never married48.8% Now married2.0% Separated0.0% Widowed9.9% DivorcedWomen who gave birth in the past 12 months Now married:
56.2% (16)Unmarried:
43.8% (12)
Women who did not give birth in the past 12 months Now married:
47.5% (148)Unmarried:
52.5% (164)
Marital status - Two or more races population 15 years and over
Males 60.2% Never married34.1% Now married1.1% Separated0.0% Widowed4.6% DivorcedFemales 48.0% Never married36.6% Now married0.0% Separated2.7% Widowed12.7% DivorcedWomen who gave birth in the past 12 months Now married:
72.2% (38)Unmarried:
27.8% (15)
Women who did not give birth in the past 12 months Now married:
22.4% (162)Unmarried:
77.6% (560)
Marital status - White alone, not Hispanic / Latino population 15 years and over
Males 39.8% Never married53.5% Now married0.5% Separated1.1% Widowed5.1% DivorcedFemales 32.3% Never married48.4% Now married1.2% Separated10.3% Widowed7.8% DivorcedWomen who gave birth in the past 12 months Now married:
64.4% (53)Unmarried:
35.6% (29)
Women who did not give birth in the past 12 months Now married:
39.8% (923)Unmarried:
60.2% (1,394)
Marital status - Hispanic or Latino population 15 years and over
Males 54.6% Never married37.0% Now married0.5% Separated2.1% Widowed5.8% DivorcedFemales 35.9% Never married37.9% Now married0.8% Separated3.8% Widowed21.6% DivorcedWomen who gave birth in the past 12 months Now married:
100.0% (32)Unmarried:
0.0% (0)
Women who did not give birth in the past 12 months Now married:
33.3% (361)Unmarried:
66.7% (722)
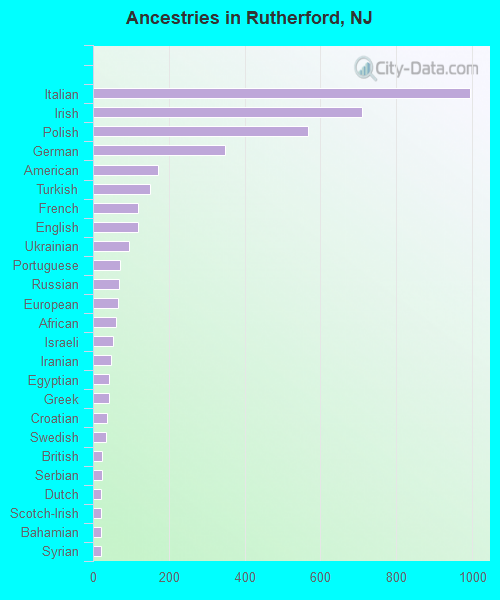
Ancestries in Rutherford
995 10.8% Italian709 7.7% Irish566 6.1% Polish349 3.8% German171 1.9% American150 1.6% Turkish120 1.3% French118 1.3% English94 1.0% Ukrainian70 0.8% Portuguese68 0.7% Russian65 0.7% European60 0.7% African54 0.6% Israeli48 0.5% Iranian42 0.5% Egyptian42 0.5% Greek36 0.4% Croatian34 0.4% Swedish24 0.3% British23 0.2% Serbian21 0.2% Dutch21 0.2% Scotch-Irish21 0.2% Bahamian20 0.2% Syrian18 0.2% Northern European17 0.2% Haitian16 0.2% Albanian15 0.2% Slavic12 0.1% Scottish12 0.1% Lithuanian12 0.1% Jamaican10 0.1% Ethiopian10 0.1% British West Indian10 0.1% Eastern European9 0.10% Armenian9 0.10% Lebanese7 0.08% Cypriot5 0.05% Danish4 0.04% Hungarian4 0.04% Swiss4 0.04% Nigerian4 0.04% Macedonian4 0.04% West Indian
Geographical mobility in Rutherford Same house 1 year ago 10,281 93.3% White (Caucasian)477 92.8% Black or African American83 96.6% American Indian / Alaska Native2,450 84.9% Asian724 81.7% Other race2,744 91.9% Two or more races9,600 93.1% White alone, not Hispanic / Latino3,758 90.2% Hispanic or LatinoMoved within same county 458 4.2% White / Caucasian0 0.1% Black or African American241 8.3% Asian146 16.5% Other race148 4.9% Two or more races406 3.9% White alone, not Hispanic / Latino295 7.1% Hispanic or LatinoMoved within same state 185 1.7% White / Caucasian7 1.4% Black or African American70 2.4% Asian12 1.4% Other race30 1.0% Two or more races217 2.1% White alone, not Hispanic / Latino37 0.9% Hispanic or LatinoMoved from different state 28 0.3% White / Caucasian40 7.9% Black or African American47 1.6% Asian37 1.2% Two or more races31 0.3% White alone, not Hispanic / Latino43 1.0% Hispanic or LatinoMoved from abroad 31 0.3% White6 1.1% Black or African American61 2.1% Asian19 0.2% White alone, not Hispanic / Latino24 0.6% Hispanic or Latino
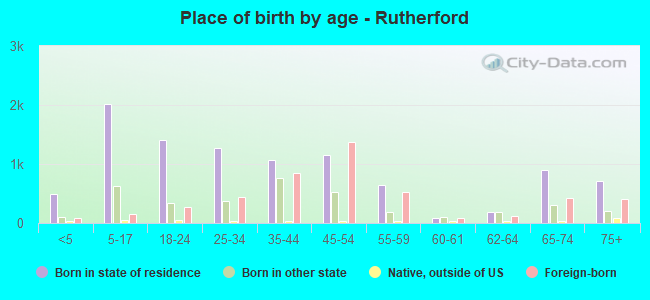
Children Nativity (place of birth) in Rutherford
Children under 6 years - Living with two parents Both parents native 386 100.0% NativeBoth parents foreign-born 167 95.4% Native8 4.6% Foreign-bornOne native, one foreign-born parent 132 100.0% NativeChildren under 6 years - Living with one parent Native parent 28 100.0% NativeForeign-born parent 72 100.0% Foreign-bornChildren 6 to 17 years - Living with two parents Both parents native 844 97.4% Native22 2.6% Foreign-bornBoth parents foreign-born 613 87.4% Native88 12.6% Foreign-bornOne native, one foreign-born parent 310 100.0% NativeChildren 6 to 17 years - Living with one parent Native parent 380 100.0% NativeForeign-born parent 291 54.1% Native247 45.9% Foreign-born