Races in Rye, New York (NY) Detailed Stats
Data:
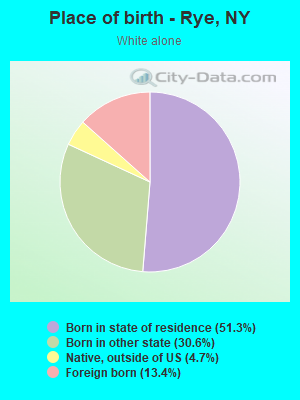
Races - White alone (%)
Races - White alone (% change since 2000)
Races - Black alone (%)
Races - Black alone (% change since 2000)
Races - American Indian alone (%)
Races - American Indian alone (% change since 2000)
Races - Asian alone (%)
Races - Asian alone (% change since 2000)
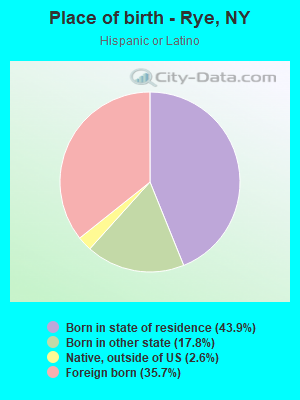
Races - Hispanic (%)
Races - Hispanic (% change since 2000)
Races - Native Hawaiian and Other Pacific Islander alone (%)
Races - Native Hawaiian and Other Pacific Islander alone (% change since 2000)
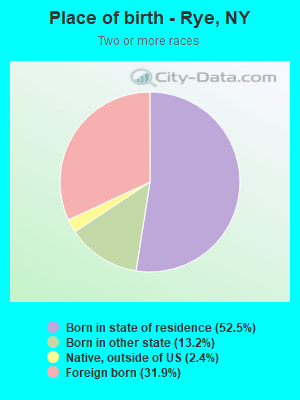
Races - Two or more races(%)
Races - Two or more races(% change since 2000)
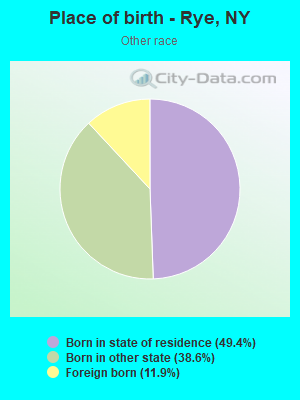
Races - Other race alone (%)
Races - Other race alone (% change since 2000)
Racial diversity
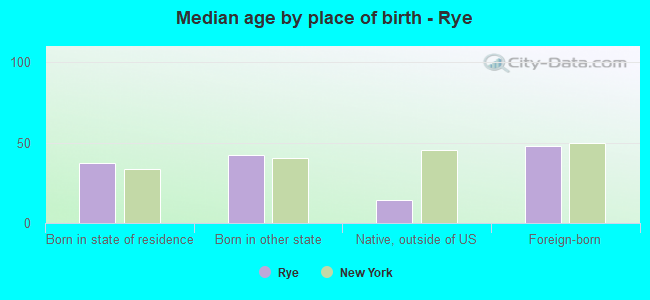
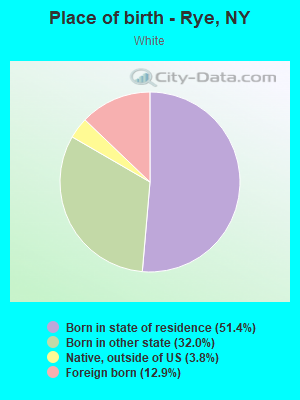
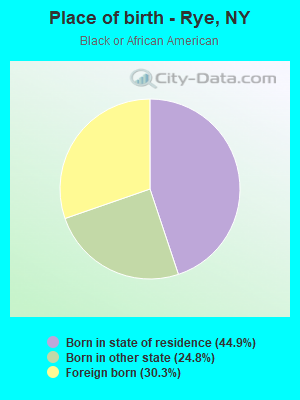
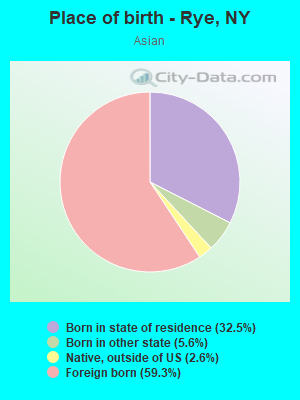
Place of birth - Born in state of residence (%)
Place of birth - Born in state of residence (%) - White
Place of birth - Born in state of residence (%) - Black or African American
Place of birth - Born in state of residence (%) - Asian
Place of birth - Born in state of residence (%) - Hispanic or Latino
Place of birth - Born in state of residence (%) - American Indian and Alaska Native
Place of birth - Born in state of residence (%) - Multirace
Place of birth - Born in state of residence (%) - Other Race
Place of birth - Born in other state (%)
Place of birth - Born in other state (%) - White
Place of birth - Born in other state (%) - Black or African American
Place of birth - Born in other state (%) - Asian
Place of birth - Born in other state (%) - Hispanic or Latino
Place of birth - Born in other state (%) - American Indian and Alaska Native
Place of birth - Born in other state (%) - Multirace
Place of birth - Born in other state (%) - Other Race
Place of birth - Native, outside of US (%)
Place of birth - Native, outside of US (%) - White
Place of birth - Native, outside of US (%) - Black or African American
Place of birth - Native, outside of US (%) - Asian
Place of birth - Native, outside of US (%) - Hispanic or Latino
Place of birth - Native, outside of US (%) - American Indian and Alaska Native
Place of birth - Native, outside of US (%) - Multirace
Place of birth - Native, outside of US (%) - Other Race
Place of birth - Foreign born (%)
Place of birth - Foreign born (%) - White
Place of birth - Foreign born (%) - Black or African American
Place of birth - Foreign born (%) - Asian
Place of birth - Foreign born (%) - Hispanic or Latino
Place of birth - Foreign born (%) - American Indian and Alaska Native
Place of birth - Foreign born (%) - Multirace
Place of birth - Foreign born (%) - Other Race
Residents speaking English at home (%)
Residents speaking English at home - Born in the United States (%)
Residents speaking English at home - Native, born elsewhere (%)
Residents speaking English at home - Foreign born (%)
Residents speaking Spanish at home (%)
Residents speaking Spanish at home - Born in the United States (%)
Residents speaking Spanish at home - Native, born elsewhere (%)
Residents speaking Spanish at home - Foreign born (%)
Residents speaking other language at home (%)
Residents speaking other language at home - Born in the United States (%)
Residents speaking other language at home - Native, born elsewhere (%)
Residents speaking other language at home - Foreign born (%)
Marital status - Never married (%)
Marital status - Now married (%)
Marital status - Separated (%)
Marital status - Widowed (%)
Marital status - Divorced (%)
Ancestries Reported - Arab (%)
Ancestries Reported - Czech (%)
Ancestries Reported - Danish (%)
Ancestries Reported - Dutch (%)
Ancestries Reported - English (%)
Ancestries Reported - French (%)
Ancestries Reported - French Canadian (%)
Ancestries Reported - German (%)
Ancestries Reported - Greek (%)
Ancestries Reported - Hungarian (%)
Ancestries Reported - Irish (%)
Ancestries Reported - Italian (%)
Ancestries Reported - Lithuanian (%)
Ancestries Reported - Norwegian (%)
Ancestries Reported - Polish (%)
Ancestries Reported - Portuguese (%)
Ancestries Reported - Russian (%)
Ancestries Reported - Scotch-Irish (%)
Ancestries Reported - Scottish (%)
Ancestries Reported - Slovak (%)
Ancestries Reported - Subsaharan African (%)
Ancestries Reported - Swedish (%)
Ancestries Reported - Swiss (%)
Ancestries Reported - Ukrainian (%)
Ancestries Reported - United States (%)
Ancestries Reported - Welsh (%)
Ancestries Reported - West Indian (%)
Ancestries Reported - Other (%)
Geographical mobility - Same house 1 year ago (%)
Geographical mobility - Same house 1 year ago (%) - White
Geographical mobility - Same house 1 year ago (%) - Black or African American
Geographical mobility - Same house 1 year ago (%) - Asian
Geographical mobility - Same house 1 year ago (%) - Hispanic or Latino
Geographical mobility - Same house 1 year ago (%) - American Indian and Alaska Native
Geographical mobility - Same house 1 year ago (%) - Multirace
Geographical mobility - Same house 1 year ago (%) - Other Race
Geographical mobility - Moved within same county (%)
Geographical mobility - Moved within same county (%) - White
Geographical mobility - Moved within same county (%) - Black or African American
Geographical mobility - Moved within same county (%) - Asian
Geographical mobility - Moved within same county (%) - Hispanic or Latino
Geographical mobility - Moved within same county (%) - American Indian and Alaska Native
Geographical mobility - Moved within same county (%) - Multirace
Geographical mobility - Moved within same county (%) - Other Race
Geographical mobility - Moved from different county within same state (%)
Geographical mobility - Moved from different county within same state (%) - White
Geographical mobility - Moved from different county within same state (%) - Black or African American
Geographical mobility - Moved from different county within same state (%) - Asian
Geographical mobility - Moved from different county within same state (%) - Hispanic or Latino
Geographical mobility - Moved from different county within same state (%) - American Indian and Alaska Native
Geographical mobility - Moved from different county within same state (%) - Multirace
Geographical mobility - Moved from different county within same state (%) - Other Race
Geographical mobility - Moved from different state (%)
Geographical mobility - Moved from different state (%) - White
Geographical mobility - Moved from different state (%) - Black or African American
Geographical mobility - Moved from different state (%) - Asian
Geographical mobility - Moved from different state (%) - Hispanic or Latino
Geographical mobility - Moved from different state (%) - American Indian and Alaska Native
Geographical mobility - Moved from different state (%) - Multirace
Geographical mobility - Moved from different state (%) - Other Race
Geographical mobility - Moved from abroad (%)
Geographical mobility - Moved from abroad (%) - White
Geographical mobility - Moved from abroad (%) - Black or African American
Geographical mobility - Moved from abroad (%) - Asian
Geographical mobility - Moved from abroad (%) - Hispanic or Latino
Geographical mobility - Moved from abroad (%) - American Indian and Alaska Native
Geographical mobility - Moved from abroad (%) - Multirace
Geographical mobility - Moved from abroad (%) - Other Race
Place of birth for the foreign-born population - Ireland (%)
Place of birth for the foreign-born population - Denmark (%)
Place of birth for the foreign-born population - Norway (%)
Place of birth for the foreign-born population - Sweden (%)
Place of birth for the foreign-born population - United Kingdom (%)
Place of birth for the foreign-born population - England (%)
Place of birth for the foreign-born population - Scotland (%)
Place of birth for the foreign-born population - Other Northern Europe (%)
Place of birth for the foreign-born population - Austria (%)
Place of birth for the foreign-born population - Belgium (%)
Place of birth for the foreign-born population - France (%)
Place of birth for the foreign-born population - Germany (%)
Place of birth for the foreign-born population - Netherlands (%)
Place of birth for the foreign-born population - Switzerland (%)
Place of birth for the foreign-born population - Other Western Europe (%)
Place of birth for the foreign-born population - Greece (%)
Place of birth for the foreign-born population - Italy (%)
Place of birth for the foreign-born population - Portugal (%)
Place of birth for the foreign-born population - Spain (%)
Place of birth for the foreign-born population - Other Southern Europe (%)
Place of birth for the foreign-born population - Albania (%)
Place of birth for the foreign-born population - Belarus (%)
Place of birth for the foreign-born population - Bosnia and Herzegovina (%)
Place of birth for the foreign-born population - Bulgaria (%)
Place of birth for the foreign-born population - Croatia (%)
Place of birth for the foreign-born population - Czechoslovakia (%)
Place of birth for the foreign-born population - Hungary (%)
Place of birth for the foreign-born population - Latvia (%)
Place of birth for the foreign-born population - Lithuania (%)
Place of birth for the foreign-born population - North Macedonia (Macedonia) (%)
Place of birth for the foreign-born population - Moldova (%)
Place of birth for the foreign-born population - Poland (%)
Place of birth for the foreign-born population - Romania (%)
Place of birth for the foreign-born population - Russia (%)
Place of birth for the foreign-born population - Serbia (%)
Place of birth for the foreign-born population - Ukraine (%)
Place of birth for the foreign-born population - Other Eastern Europe (%)
Place of birth for the foreign-born population - China (%)
Place of birth for the foreign-born population - Hong Kong (%)
Place of birth for the foreign-born population - Taiwan (%)
Place of birth for the foreign-born population - Japan (%)
Place of birth for the foreign-born population - Korea (%)
Place of birth for the foreign-born population - Other Eastern Asia (%)
Place of birth for the foreign-born population - Afghanistan (%)
Place of birth for the foreign-born population - Bangladesh (%)
Place of birth for the foreign-born population - India (%)
Place of birth for the foreign-born population - Iran (%)
Place of birth for the foreign-born population - Kazakhstan (%)
Place of birth for the foreign-born population - Nepal (%)
Place of birth for the foreign-born population - Pakistan (%)
Place of birth for the foreign-born population - Sri Lanka (%)
Place of birth for the foreign-born population - Uzbekistan (%)
Place of birth for the foreign-born population - Other South Central Asia (%)
Place of birth for the foreign-born population - Burma (%)
Place of birth for the foreign-born population - Cambodia (%)
Place of birth for the foreign-born population - Indonesia (%)
Place of birth for the foreign-born population - Laos (%)
Place of birth for the foreign-born population - Malaysia (%)
Place of birth for the foreign-born population - Philippines (%)
Place of birth for the foreign-born population - Singapore (%)
Place of birth for the foreign-born population - Thailand (%)
Place of birth for the foreign-born population - Vietnam (%)
Place of birth for the foreign-born population - Other South Eastern Asia (%)
Place of birth for the foreign-born population - Armenia (%)
Place of birth for the foreign-born population - Iraq (%)
Place of birth for the foreign-born population - Israel (%)
Place of birth for the foreign-born population - Jordan (%)
Place of birth for the foreign-born population - Kuwait (%)
Place of birth for the foreign-born population - Lebanon (%)
Place of birth for the foreign-born population - Saudi Arabia (%)
Place of birth for the foreign-born population - Syria (%)
Place of birth for the foreign-born population - Turkey (%)
Place of birth for the foreign-born population - Yemen (%)
Place of birth for the foreign-born population - Other Western Asia (%)
Place of birth for the foreign-born population - Eritrea (%)
Place of birth for the foreign-born population - Ethiopia (%)
Place of birth for the foreign-born population - Kenya (%)
Place of birth for the foreign-born population - Somalia (%)
Place of birth for the foreign-born population - Uganda (%)
Place of birth for the foreign-born population - Zimbabwe (%)
Place of birth for the foreign-born population - Other Eastern Africa (%)
Place of birth for the foreign-born population - Cameroon (%)
Place of birth for the foreign-born population - Congo (%)
Place of birth for the foreign-born population - Democratic Republic of Congo (Zaire) (%)
Place of birth for the foreign-born population - Other Middle Africa (%)
Place of birth for the foreign-born population - Egypt (%)
Place of birth for the foreign-born population - Morocco (%)
Place of birth for the foreign-born population - Sudan (%)
Place of birth for the foreign-born population - Other Northern Africa (%)
Place of birth for the foreign-born population - South Africa (%)
Place of birth for the foreign-born population - Other Southern Africa (%)
Place of birth for the foreign-born population - Cabo Verde (%)
Place of birth for the foreign-born population - Ghana (%)
Place of birth for the foreign-born population - Liberia (%)
Place of birth for the foreign-born population - Nigeria (%)
Place of birth for the foreign-born population - Senegal (%)
Place of birth for the foreign-born population - Sierra Leone (%)
Place of birth for the foreign-born population - Other Western Africa (%)
Place of birth for the foreign-born population - Australia (%)
Place of birth for the foreign-born population - New Zealand (%)
Place of birth for the foreign-born population - Fiji (%)
Place of birth for the foreign-born population - Micronesia (%)
Place of birth for the foreign-born population - Bahamas (%)
Place of birth for the foreign-born population - Barbados (%)
Place of birth for the foreign-born population - Cuba (%)
Place of birth for the foreign-born population - Dominica (%)
Place of birth for the foreign-born population - Dominican Republic (%)
Place of birth for the foreign-born population - Grenada (%)
Place of birth for the foreign-born population - Haiti (%)
Place of birth for the foreign-born population - Jamaica (%)
Place of birth for the foreign-born population - St. Vincent and the Grenadines (%)
Place of birth for the foreign-born population - Trinidad and Tobago (%)
Place of birth for the foreign-born population - West Indies (%)
Place of birth for the foreign-born population - Other Caribbean (%)
Place of birth for the foreign-born population - Belize (%)
Place of birth for the foreign-born population - Costa Rica (%)
Place of birth for the foreign-born population - El Salvador (%)
Place of birth for the foreign-born population - Guatemala (%)
Place of birth for the foreign-born population - Honduras (%)
Place of birth for the foreign-born population - Mexico (%)
Place of birth for the foreign-born population - Nicaragua (%)
Place of birth for the foreign-born population - Panama (%)
Place of birth for the foreign-born population - Other Central America (%)
Place of birth for the foreign-born population - Argentina (%)
Place of birth for the foreign-born population - Bolivia (%)
Place of birth for the foreign-born population - Brazil (%)
Place of birth for the foreign-born population - Chile (%)
Place of birth for the foreign-born population - Colombia (%)
Place of birth for the foreign-born population - Ecuador (%)
Place of birth for the foreign-born population - Guyana (%)
Place of birth for the foreign-born population - Peru (%)
Place of birth for the foreign-born population - Uruguay (%)
Place of birth for the foreign-born population - Venezuela (%)
Place of birth for the foreign-born population - Other South America (%)
Place of birth for the foreign-born population - Canada (%)
Place of birth for the foreign-born population - Other Northern America (%)
Place of birth for the foreign-born population - Other (%)
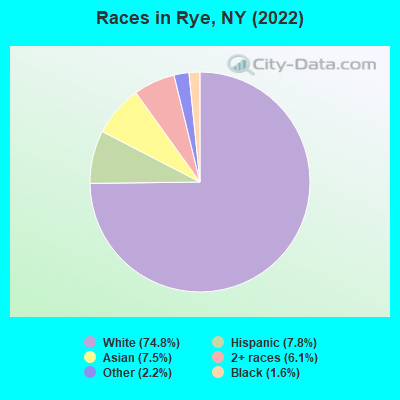
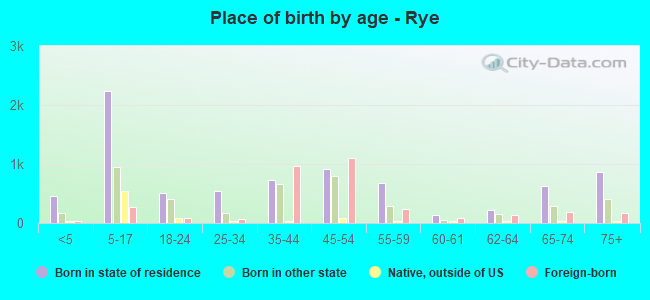
According to 2022 data, the most numerous races in Rye, NY are White alone (12,213 residents), Hispanic (1,277 residents), and Black alone (255 residents). 79.2% of Rye residents speak English at home. 20.2% of Rye, NY residents are foreign-born (8.6% born in Europe, 5.6% born in Asia, 2.8% born in Latin America), which is 8.8% less than the foreign-born rate of 22.0% across the entire state of New York.
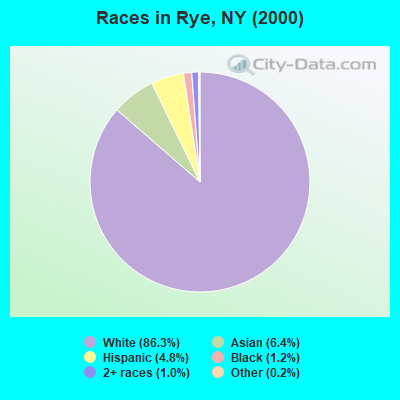
Race distribution in Rye
2000 2022
11,760,981 62.0% White alone 2,867,583 15.1% Hispanic 2,812,623 14.8% Black alone 1,035,926 5.5% Asian alone 366,116 1.9% Two or more races 75,499 0.4% Other race alone 52,499 0.3% American Indian alone 5,230 0.03% Native Hawaiian and Other
10,408,933 52.9% White alone 3,867,299 19.7% Hispanic 2,633,840 13.4% Black alone 1,776,286 9.0% Asian alone 732,670 3.7% Two or more races 216,110 1.1% Other race alone 35,082 0.2% American Indian alone 6,931 0.04% Native Hawaiian and Other
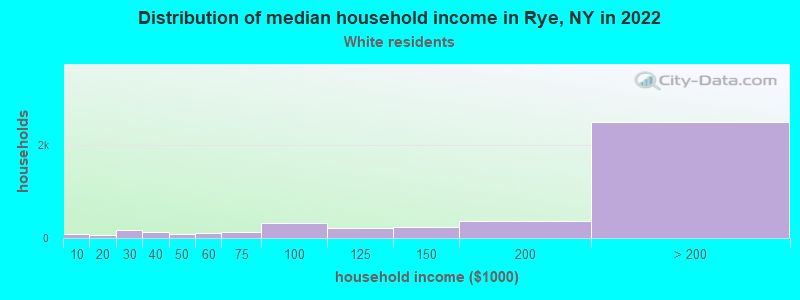
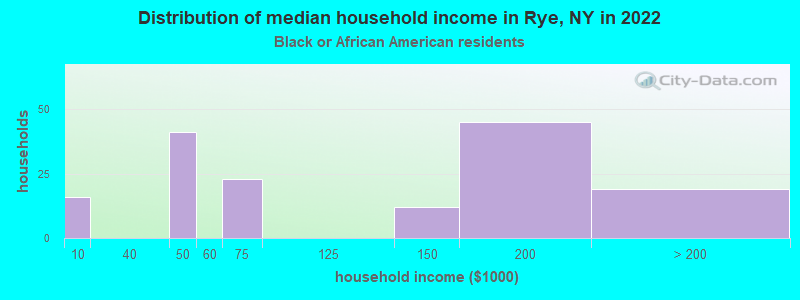
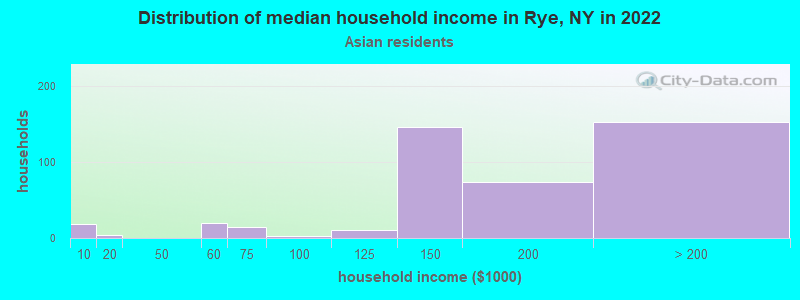
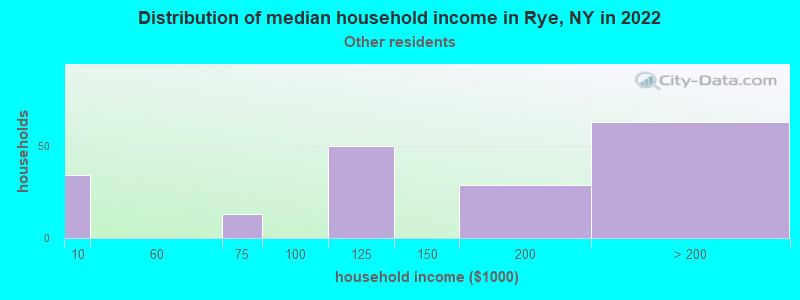
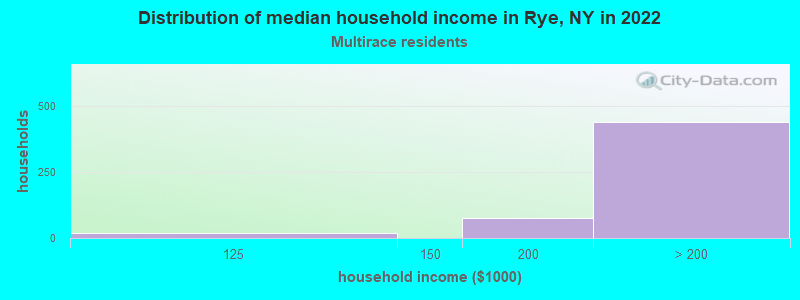
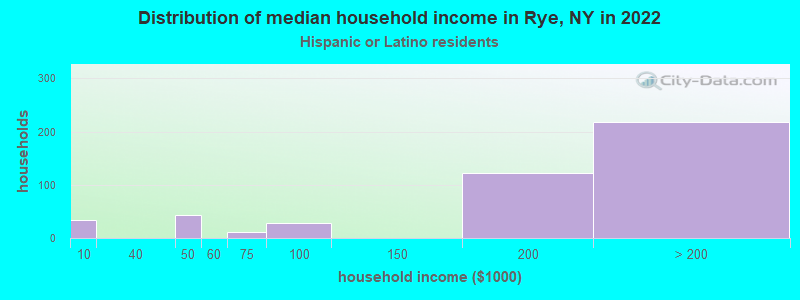
Income and house value in Rye Median household income in 2022 over $200,000 White non-Hispanic householders$121,982 Black householders$152,804 Asian householders$155,699 Some other race householdersover $200,000 Two or more races householders$173,220 Hispanic or Latino race householdersMedian 2022 house value over $1,000,000 White Non-Hispanic householders$687,578 Black or African American householders over $1,000,000 Asian householdersover $1,000,000 Some other race householdersover $1,000,000 Hispanic or Latino householders
Median age by race in Rye
45.2 Median age for White residents43.1 46.7 46.2 Median age for Black or African American residents44.7 46.1 -641,441,440.8 Median age for American Indian / Alaska Native residents-664,804,468.6 -554,999,999.4 42.7 Median age for Asian residents41.5 44.1 -487,992,314.6 Median age for Native Hawaiian / Pacific Islander residents-477,502,295.2 -666,666,666.0 36.9 Median age for Other race residents37.0 36.8 28.3 Median age for Two or more races residents30.2 27.9 44.2 Median age for White alone residents42.3 46.2 39.4 Median age for Hispanic or Latino residents29.4 46.0
Owner/renter occupied households by race in Rye
House owners and renters - White residents 3,370 76.5% Owner occupied1,033 23.5% Renter occupiedHouse owners and renters - Black or African American residents 85 52.1% Owner occupied78 47.9% Renter occupiedHouse owners and renters - Asian residents 202 49.8% Owner occupied203 50.2% Renter occupiedHouse owners and renters - Other race residents 102 53.5% Owner occupied89 46.5% Renter occupiedHouse owners and renters - Two or more races residents 511 84.8% Owner occupied92 15.2% Renter occupiedHouse owners and renters - White alone residents 3,350 76.1% Owner occupied1,050 23.9% Renter occupiedHouse owners and renters - Hispanic or Latino residents 271 54.1% Owner occupied229 45.9% Renter occupied
Language usage in Rye
English speakers - Total 79.2% of residents of Rye speak English at home.
6.8% of residents speak Spanish at home 953 89.2% Speak English very well115 10.8% Speak English less than very well13.6% of residents speak other language at home 1,731 81.6% Speak English very well391 18.4% Speak English less than very well
English speakers - Born in the United States 94.3% of residents of Rye speak English at home.
2.5% of residents speak Spanish at home 101 95.3% Speak English very well5 4.7% Speak English less than very well4.3% of residents speak other language at home 171 94.5% Speak English very well10 5.5% Speak English less than very well
English speakers - Native, born elsewhere 64.1% of residents of Rye speak English at home.
3.3% of residents speak Spanish at home 22 100.0% Speak English very well16.6% of residents speak other language at home 98 89.9% Speak English very well11 10.1% Speak English less than very well
English speakers - Foreign-born 44.0% of residents of Rye speak English at home.
13.4% of residents speak Spanish at home 358 80.6% Speak English very well86 19.4% Speak English less than very well44.6% of residents speak other language at home 1,142 77.0% Speak English very well342 23.0% Speak English less than very well
White (Caucasian) - Speak only English Native:
95.4% (9,554)Foreign-born:
64.2% (984)
White (Caucasian) - Speak another language Native:
5.6% (563)Foreign-born:
45.2% (692)
Black or African American - Speak only English Native:
81.5% (160)Foreign-born:
1.3% (1)
Black or African American - Speak another language Native:
16.1% (31)Foreign-born:
91.7% (80)
Asian - Speak only English Native:
48.9% (204)Foreign-born:
20.1% (144)
Asian - Speak another language Native:
51.3% (213)Foreign-born:
80.1% (574)
Other race - Speak another language Native:
10.2% (40)Foreign-born:
96.8% (50)
Two or more races - Speak only English Native:
67.4% (759)Foreign-born:
40.8% (249)
Two or more races - Speak another language Native:
32.9% (371)Foreign-born:
56.3% (343)
White alone - Speak only English Native:
94.3% (9,549)Foreign-born:
58.7% (965)
White alone - Speak another language Native:
5.9% (594)Foreign-born:
44.7% (735)
Hispanic or Latino - Speak only English Native:
47.2% (383)Foreign-born:
8.9% (39)
Hispanic or Latino - Speak another language Native:
50.9% (414)Foreign-born:
91.4% (405)
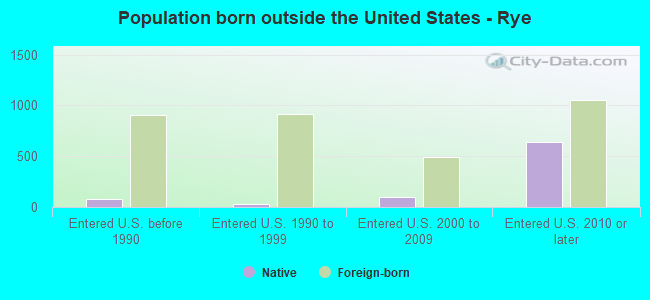
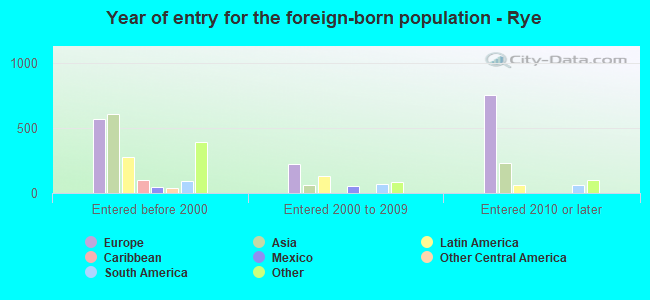
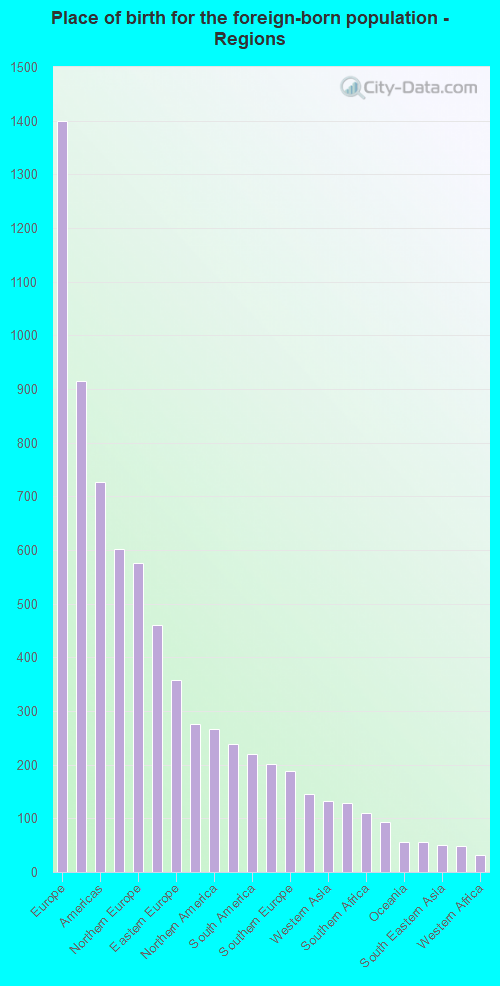
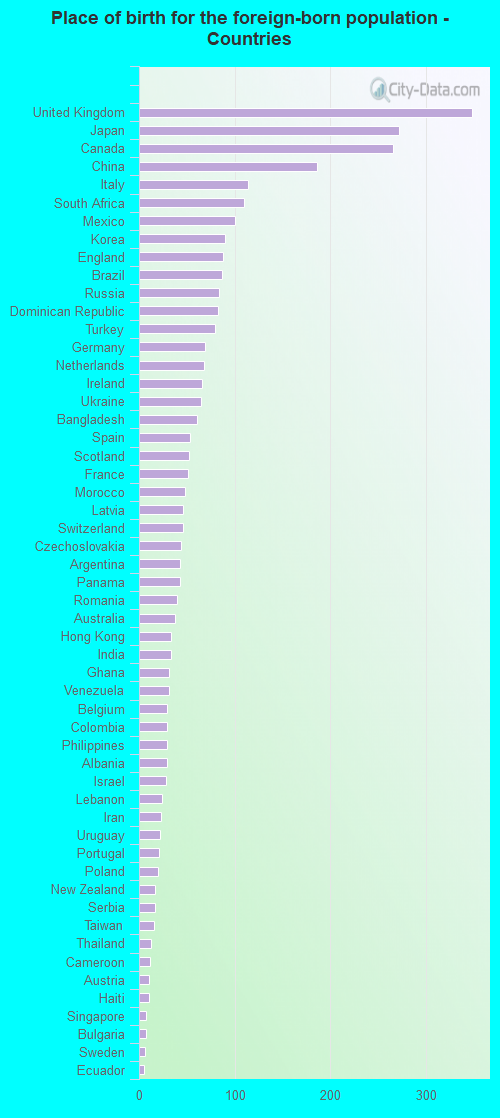
Foreign-born residents in Rye 3,300 residents are foreign born (8.6% Europe , 5.6% Asia , 2.8% Latin America ).
This city:
20.2%New York:
22.6%
Marital status for residents in Rye Marital status - White (Caucasian) population 15 years and over
Males 26.1% Never married65.7% Now married1.3% Separated1.3% Widowed5.7% DivorcedFemales 22.9% Never married56.4% Now married0.5% Separated11.9% Widowed8.3% DivorcedWomen who gave birth in the past 12 months Now married:
100.0% (65)Unmarried:
0.0% (0)
Women who did not give birth in the past 12 months Now married:
55.7% (1,268)Unmarried:
44.3% (1,009)
Marital status - Black or African American population 15 years and over
Males 65.0% Never married23.6% Now married0.0% Separated0.0% Widowed11.4% DivorcedFemales 37.3% Never married19.5% Now married1.7% Separated8.5% Widowed33.1% DivorcedWomen who did not give birth in the past 12 months Now married:
30.9% (24)Unmarried:
69.1% (54)
Marital status - Asian population 15 years and over
Males 30.5% Never married60.1% Now married0.0% Separated4.4% Widowed4.9% DivorcedFemales 11.3% Never married86.4% Now married0.0% Separated2.1% Widowed0.2% DivorcedWomen who gave birth in the past 12 months Now married:
100.0% (10)Unmarried:
0.0% (0)
Women who did not give birth in the past 12 months Now married:
87.8% (359)Unmarried:
12.2% (50)
Marital status - Other race population 15 years and over
Males 15.2% Never married75.9% Now married8.9% Separated0.0% Widowed0.0% DivorcedFemales 4.9% Never married91.8% Now married0.0% Separated0.0% Widowed3.3% DivorcedWomen who did not give birth in the past 12 months Now married:
92.9% (134)Unmarried:
7.1% (10)
Marital status - Two or more races population 15 years and over
Males 42.6% Never married49.9% Now married0.0% Separated0.0% Widowed7.5% DivorcedFemales 28.3% Never married69.8% Now married0.0% Separated1.9% Widowed0.0% DivorcedWomen who did not give birth in the past 12 months Now married:
49.0% (125)Unmarried:
51.0% (130)
Marital status - White alone, not Hispanic / Latino population 15 years and over
Males 25.5% Never married66.0% Now married1.3% Separated1.3% Widowed5.8% DivorcedFemales 22.2% Never married56.0% Now married0.5% Separated12.5% Widowed8.8% DivorcedWomen who gave birth in the past 12 months Now married:
100.0% (69)Unmarried:
0.0% (0)
Women who did not give birth in the past 12 months Now married:
55.5% (1,222)Unmarried:
44.5% (981)
Marital status - Hispanic or Latino population 15 years and over
Males 51.1% Never married37.4% Now married2.2% Separated0.0% Widowed9.2% DivorcedFemales 36.5% Never married60.2% Now married0.0% Separated2.4% Widowed1.0% DivorcedWomen who did not give birth in the past 12 months Now married:
46.9% (196)Unmarried:
53.1% (222)
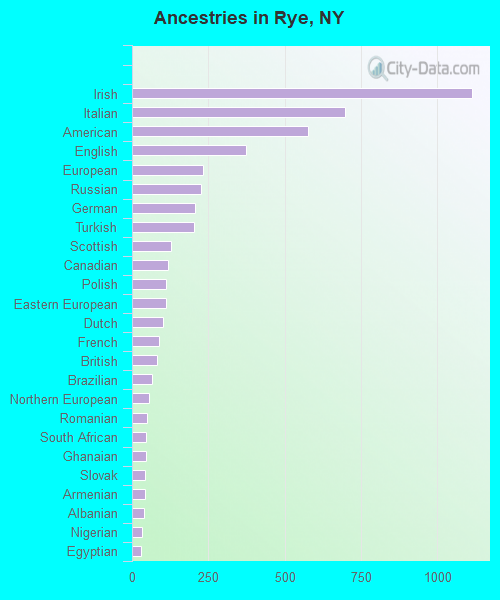
Ancestries in Rye
1,113 15.8% Irish697 9.9% Italian576 8.2% American373 5.3% English233 3.3% European227 3.2% Russian206 2.9% German204 2.9% Turkish129 1.8% Scottish117 1.7% Canadian112 1.6% Polish112 1.6% Eastern European100 1.4% Dutch89 1.3% French82 1.2% British67 1.0% Brazilian55 0.8% Northern European48 0.7% Romanian47 0.7% South African45 0.6% Ghanaian44 0.6% Slovak43 0.6% Armenian38 0.5% Albanian32 0.5% Nigerian30 0.4% Egyptian29 0.4% Serbian26 0.4% Ukrainian23 0.3% Lebanese23 0.3% Swedish22 0.3% Portuguese21 0.3% Finnish21 0.3% Iranian19 0.3% Scotch-Irish17 0.2% Moroccan17 0.2% Austrian16 0.2% French Canadian16 0.2% Belgian13 0.2% Bulgarian12 0.2% Norwegian10 0.1% Czech8 0.1% Swiss6 0.09% Hungarian6 0.09% African4 0.06% Australian4 0.06% Lithuanian1 0.01% Jamaican
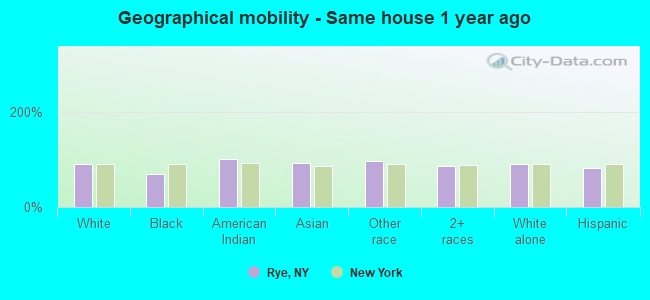
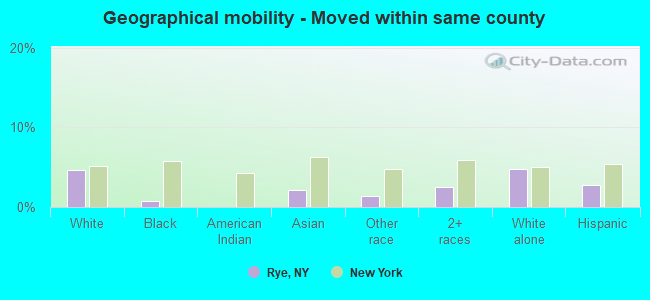
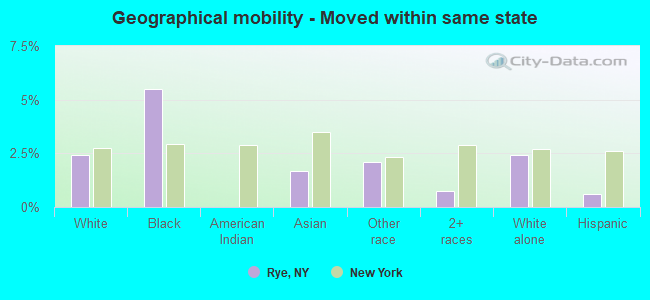
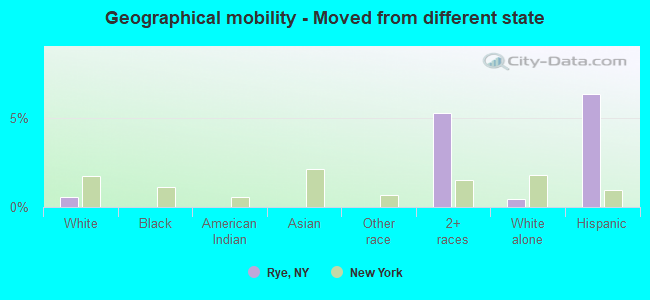
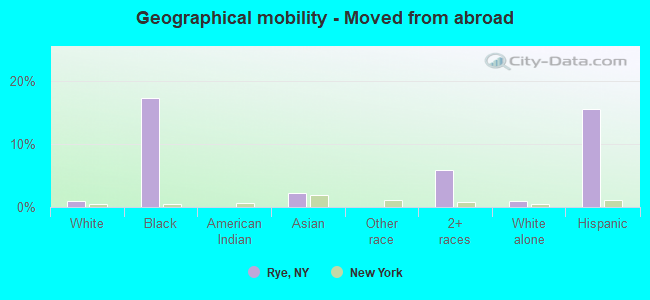
Geographical mobility in Rye Same house 1 year ago 10,893 91.4% White (Caucasian)196 69.4% Black or African American29 100.0% American Indian / Alaska Native1,095 91.9% Asian410 97.2% Other race1,612 84.6% Two or more races11,129 91.3% White alone, not Hispanic / Latino1,031 80.9% Hispanic or LatinoMoved within same county 546 4.6% White / Caucasian2 0.7% Black or African American25 2.1% Asian6 1.3% Other race47 2.5% Two or more races588 4.8% White alone, not Hispanic / Latino35 2.7% Hispanic or LatinoMoved within same state 290 2.4% White / Caucasian15 5.5% Black or African American20 1.7% Asian9 2.1% Other race15 0.8% Two or more races295 2.4% White alone, not Hispanic / Latino8 0.6% Hispanic or LatinoMoved from different state 67 0.6% White / Caucasian101 5.3% Two or more races55 0.4% White alone, not Hispanic / Latino80 6.3% Hispanic or LatinoMoved from abroad 111 0.9% White49 17.3% Black or African American26 2.2% Asian111 5.8% Two or more races122 1.0% White alone, not Hispanic / Latino197 15.5% Hispanic or Latino
Children Nativity (place of birth) in Rye
Children under 6 years - Living with two parents Both parents native 473 99.9% Native0 0.1% Foreign-bornBoth parents foreign-born 151 91.8% Native13 8.2% Foreign-bornOne native, one foreign-born parent 228 100.0% NativeChildren under 6 years - Living with one parent Native parent 42 100.0% NativeForeign-born parent 8 100.0% NativeChildren 6 to 17 years - Living with two parents Both parents native 1,490 99.9% Native2 0.1% Foreign-bornBoth parents foreign-born 612 78.8% Native164 21.2% Foreign-bornOne native, one foreign-born parent 962 100.0% NativeChildren 6 to 17 years - Living with one parent Native parent 230 100.0% NativeForeign-born parent 115 60.0% Native76 40.0% Foreign-born