Races in Saginaw, Michigan (MI) Detailed Stats
Data:
Races - White alone (%)
Races - White alone (% change since 2000)
Races - Black alone (%)
Races - Black alone (% change since 2000)
Races - American Indian alone (%)
Races - American Indian alone (% change since 2000)
Races - Asian alone (%)
Races - Asian alone (% change since 2000)
Races - Hispanic (%)
Races - Hispanic (% change since 2000)
Races - Native Hawaiian and Other Pacific Islander alone (%)
Races - Native Hawaiian and Other Pacific Islander alone (% change since 2000)
Races - Two or more races(%)
Races - Two or more races(% change since 2000)
Races - Other race alone (%)
Races - Other race alone (% change since 2000)
Racial diversity
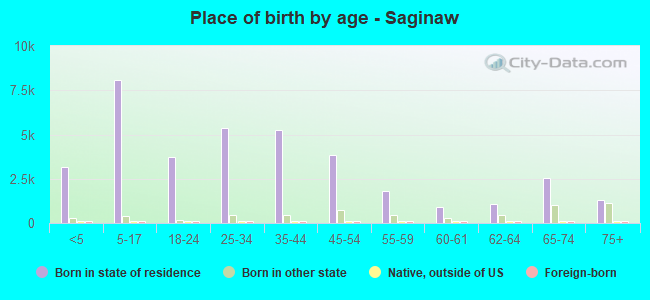
Place of birth - Born in state of residence (%)
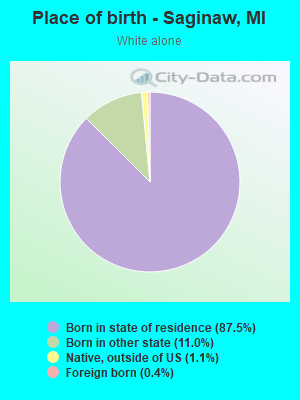
Place of birth - Born in state of residence (%) - White
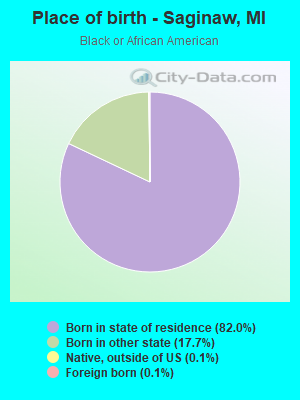
Place of birth - Born in state of residence (%) - Black or African American
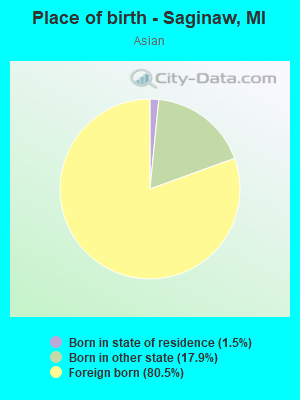
Place of birth - Born in state of residence (%) - Asian
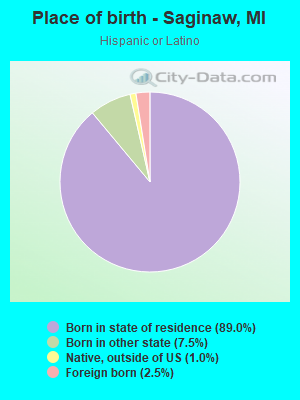
Place of birth - Born in state of residence (%) - Hispanic or Latino
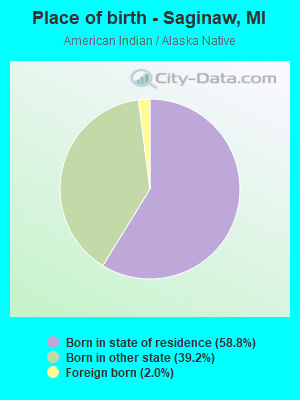
Place of birth - Born in state of residence (%) - American Indian and Alaska Native
Place of birth - Born in state of residence (%) - Multirace
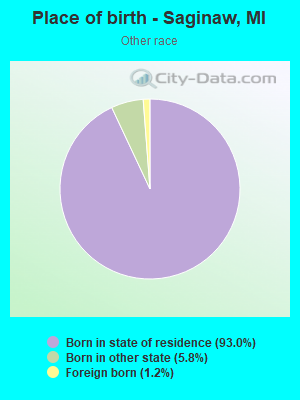
Place of birth - Born in state of residence (%) - Other Race
Place of birth - Born in other state (%)
Place of birth - Born in other state (%) - White
Place of birth - Born in other state (%) - Black or African American
Place of birth - Born in other state (%) - Asian
Place of birth - Born in other state (%) - Hispanic or Latino
Place of birth - Born in other state (%) - American Indian and Alaska Native
Place of birth - Born in other state (%) - Multirace
Place of birth - Born in other state (%) - Other Race
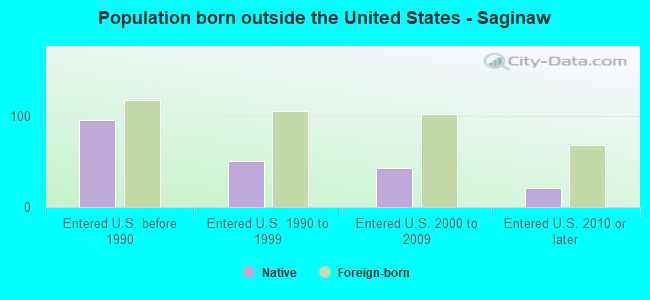
Place of birth - Native, outside of US (%)
Place of birth - Native, outside of US (%) - White
Place of birth - Native, outside of US (%) - Black or African American
Place of birth - Native, outside of US (%) - Asian
Place of birth - Native, outside of US (%) - Hispanic or Latino
Place of birth - Native, outside of US (%) - American Indian and Alaska Native
Place of birth - Native, outside of US (%) - Multirace
Place of birth - Native, outside of US (%) - Other Race
Place of birth - Foreign born (%)
Place of birth - Foreign born (%) - White
Place of birth - Foreign born (%) - Black or African American
Place of birth - Foreign born (%) - Asian
Place of birth - Foreign born (%) - Hispanic or Latino
Place of birth - Foreign born (%) - American Indian and Alaska Native
Place of birth - Foreign born (%) - Multirace
Place of birth - Foreign born (%) - Other Race
Residents speaking English at home (%)
Residents speaking English at home - Born in the United States (%)
Residents speaking English at home - Native, born elsewhere (%)
Residents speaking English at home - Foreign born (%)
Residents speaking Spanish at home (%)
Residents speaking Spanish at home - Born in the United States (%)
Residents speaking Spanish at home - Native, born elsewhere (%)
Residents speaking Spanish at home - Foreign born (%)
Residents speaking other language at home (%)
Residents speaking other language at home - Born in the United States (%)
Residents speaking other language at home - Native, born elsewhere (%)
Residents speaking other language at home - Foreign born (%)
Marital status - Never married (%)
Marital status - Now married (%)
Marital status - Separated (%)
Marital status - Widowed (%)
Marital status - Divorced (%)
Ancestries Reported - Arab (%)
Ancestries Reported - Czech (%)
Ancestries Reported - Danish (%)
Ancestries Reported - Dutch (%)
Ancestries Reported - English (%)
Ancestries Reported - French (%)
Ancestries Reported - French Canadian (%)
Ancestries Reported - German (%)
Ancestries Reported - Greek (%)
Ancestries Reported - Hungarian (%)
Ancestries Reported - Irish (%)
Ancestries Reported - Italian (%)
Ancestries Reported - Lithuanian (%)
Ancestries Reported - Norwegian (%)
Ancestries Reported - Polish (%)
Ancestries Reported - Portuguese (%)
Ancestries Reported - Russian (%)
Ancestries Reported - Scotch-Irish (%)
Ancestries Reported - Scottish (%)
Ancestries Reported - Slovak (%)
Ancestries Reported - Subsaharan African (%)
Ancestries Reported - Swedish (%)
Ancestries Reported - Swiss (%)
Ancestries Reported - Ukrainian (%)
Ancestries Reported - United States (%)
Ancestries Reported - Welsh (%)
Ancestries Reported - West Indian (%)
Ancestries Reported - Other (%)
Geographical mobility - Same house 1 year ago (%)
Geographical mobility - Same house 1 year ago (%) - White
Geographical mobility - Same house 1 year ago (%) - Black or African American
Geographical mobility - Same house 1 year ago (%) - Asian
Geographical mobility - Same house 1 year ago (%) - Hispanic or Latino
Geographical mobility - Same house 1 year ago (%) - American Indian and Alaska Native
Geographical mobility - Same house 1 year ago (%) - Multirace
Geographical mobility - Same house 1 year ago (%) - Other Race
Geographical mobility - Moved within same county (%)
Geographical mobility - Moved within same county (%) - White
Geographical mobility - Moved within same county (%) - Black or African American
Geographical mobility - Moved within same county (%) - Asian
Geographical mobility - Moved within same county (%) - Hispanic or Latino
Geographical mobility - Moved within same county (%) - American Indian and Alaska Native
Geographical mobility - Moved within same county (%) - Multirace
Geographical mobility - Moved within same county (%) - Other Race
Geographical mobility - Moved from different county within same state (%)
Geographical mobility - Moved from different county within same state (%) - White
Geographical mobility - Moved from different county within same state (%) - Black or African American
Geographical mobility - Moved from different county within same state (%) - Asian
Geographical mobility - Moved from different county within same state (%) - Hispanic or Latino
Geographical mobility - Moved from different county within same state (%) - American Indian and Alaska Native
Geographical mobility - Moved from different county within same state (%) - Multirace
Geographical mobility - Moved from different county within same state (%) - Other Race
Geographical mobility - Moved from different state (%)
Geographical mobility - Moved from different state (%) - White
Geographical mobility - Moved from different state (%) - Black or African American
Geographical mobility - Moved from different state (%) - Asian
Geographical mobility - Moved from different state (%) - Hispanic or Latino
Geographical mobility - Moved from different state (%) - American Indian and Alaska Native
Geographical mobility - Moved from different state (%) - Multirace
Geographical mobility - Moved from different state (%) - Other Race
Geographical mobility - Moved from abroad (%)
Geographical mobility - Moved from abroad (%) - White
Geographical mobility - Moved from abroad (%) - Black or African American
Geographical mobility - Moved from abroad (%) - Asian
Geographical mobility - Moved from abroad (%) - Hispanic or Latino
Geographical mobility - Moved from abroad (%) - American Indian and Alaska Native
Geographical mobility - Moved from abroad (%) - Multirace
Geographical mobility - Moved from abroad (%) - Other Race
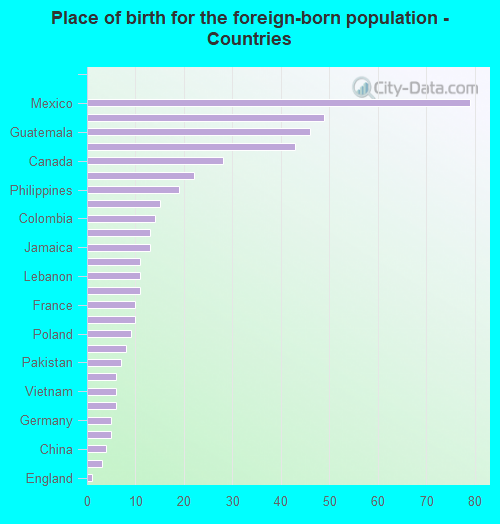
Place of birth for the foreign-born population - Ireland (%)
Place of birth for the foreign-born population - Denmark (%)
Place of birth for the foreign-born population - Norway (%)
Place of birth for the foreign-born population - Sweden (%)
Place of birth for the foreign-born population - United Kingdom (%)
Place of birth for the foreign-born population - England (%)
Place of birth for the foreign-born population - Scotland (%)
Place of birth for the foreign-born population - Other Northern Europe (%)
Place of birth for the foreign-born population - Austria (%)
Place of birth for the foreign-born population - Belgium (%)
Place of birth for the foreign-born population - France (%)
Place of birth for the foreign-born population - Germany (%)
Place of birth for the foreign-born population - Netherlands (%)
Place of birth for the foreign-born population - Switzerland (%)
Place of birth for the foreign-born population - Other Western Europe (%)
Place of birth for the foreign-born population - Greece (%)
Place of birth for the foreign-born population - Italy (%)
Place of birth for the foreign-born population - Portugal (%)
Place of birth for the foreign-born population - Spain (%)
Place of birth for the foreign-born population - Other Southern Europe (%)
Place of birth for the foreign-born population - Albania (%)
Place of birth for the foreign-born population - Belarus (%)
Place of birth for the foreign-born population - Bosnia and Herzegovina (%)
Place of birth for the foreign-born population - Bulgaria (%)
Place of birth for the foreign-born population - Croatia (%)
Place of birth for the foreign-born population - Czechoslovakia (%)
Place of birth for the foreign-born population - Hungary (%)
Place of birth for the foreign-born population - Latvia (%)
Place of birth for the foreign-born population - Lithuania (%)
Place of birth for the foreign-born population - North Macedonia (Macedonia) (%)
Place of birth for the foreign-born population - Moldova (%)
Place of birth for the foreign-born population - Poland (%)
Place of birth for the foreign-born population - Romania (%)
Place of birth for the foreign-born population - Russia (%)
Place of birth for the foreign-born population - Serbia (%)
Place of birth for the foreign-born population - Ukraine (%)
Place of birth for the foreign-born population - Other Eastern Europe (%)
Place of birth for the foreign-born population - China (%)
Place of birth for the foreign-born population - Hong Kong (%)
Place of birth for the foreign-born population - Taiwan (%)
Place of birth for the foreign-born population - Japan (%)
Place of birth for the foreign-born population - Korea (%)
Place of birth for the foreign-born population - Other Eastern Asia (%)
Place of birth for the foreign-born population - Afghanistan (%)
Place of birth for the foreign-born population - Bangladesh (%)
Place of birth for the foreign-born population - India (%)
Place of birth for the foreign-born population - Iran (%)
Place of birth for the foreign-born population - Kazakhstan (%)
Place of birth for the foreign-born population - Nepal (%)
Place of birth for the foreign-born population - Pakistan (%)
Place of birth for the foreign-born population - Sri Lanka (%)
Place of birth for the foreign-born population - Uzbekistan (%)
Place of birth for the foreign-born population - Other South Central Asia (%)
Place of birth for the foreign-born population - Burma (%)
Place of birth for the foreign-born population - Cambodia (%)
Place of birth for the foreign-born population - Indonesia (%)
Place of birth for the foreign-born population - Laos (%)
Place of birth for the foreign-born population - Malaysia (%)
Place of birth for the foreign-born population - Philippines (%)
Place of birth for the foreign-born population - Singapore (%)
Place of birth for the foreign-born population - Thailand (%)
Place of birth for the foreign-born population - Vietnam (%)
Place of birth for the foreign-born population - Other South Eastern Asia (%)
Place of birth for the foreign-born population - Armenia (%)
Place of birth for the foreign-born population - Iraq (%)
Place of birth for the foreign-born population - Israel (%)
Place of birth for the foreign-born population - Jordan (%)
Place of birth for the foreign-born population - Kuwait (%)
Place of birth for the foreign-born population - Lebanon (%)
Place of birth for the foreign-born population - Saudi Arabia (%)
Place of birth for the foreign-born population - Syria (%)
Place of birth for the foreign-born population - Turkey (%)
Place of birth for the foreign-born population - Yemen (%)
Place of birth for the foreign-born population - Other Western Asia (%)
Place of birth for the foreign-born population - Eritrea (%)
Place of birth for the foreign-born population - Ethiopia (%)
Place of birth for the foreign-born population - Kenya (%)
Place of birth for the foreign-born population - Somalia (%)
Place of birth for the foreign-born population - Uganda (%)
Place of birth for the foreign-born population - Zimbabwe (%)
Place of birth for the foreign-born population - Other Eastern Africa (%)
Place of birth for the foreign-born population - Cameroon (%)
Place of birth for the foreign-born population - Congo (%)
Place of birth for the foreign-born population - Democratic Republic of Congo (Zaire) (%)
Place of birth for the foreign-born population - Other Middle Africa (%)
Place of birth for the foreign-born population - Egypt (%)
Place of birth for the foreign-born population - Morocco (%)
Place of birth for the foreign-born population - Sudan (%)
Place of birth for the foreign-born population - Other Northern Africa (%)
Place of birth for the foreign-born population - South Africa (%)
Place of birth for the foreign-born population - Other Southern Africa (%)
Place of birth for the foreign-born population - Cabo Verde (%)
Place of birth for the foreign-born population - Ghana (%)
Place of birth for the foreign-born population - Liberia (%)
Place of birth for the foreign-born population - Nigeria (%)
Place of birth for the foreign-born population - Senegal (%)
Place of birth for the foreign-born population - Sierra Leone (%)
Place of birth for the foreign-born population - Other Western Africa (%)
Place of birth for the foreign-born population - Australia (%)
Place of birth for the foreign-born population - New Zealand (%)
Place of birth for the foreign-born population - Fiji (%)
Place of birth for the foreign-born population - Micronesia (%)
Place of birth for the foreign-born population - Bahamas (%)
Place of birth for the foreign-born population - Barbados (%)
Place of birth for the foreign-born population - Cuba (%)
Place of birth for the foreign-born population - Dominica (%)
Place of birth for the foreign-born population - Dominican Republic (%)
Place of birth for the foreign-born population - Grenada (%)
Place of birth for the foreign-born population - Haiti (%)
Place of birth for the foreign-born population - Jamaica (%)
Place of birth for the foreign-born population - St. Vincent and the Grenadines (%)
Place of birth for the foreign-born population - Trinidad and Tobago (%)
Place of birth for the foreign-born population - West Indies (%)
Place of birth for the foreign-born population - Other Caribbean (%)
Place of birth for the foreign-born population - Belize (%)
Place of birth for the foreign-born population - Costa Rica (%)
Place of birth for the foreign-born population - El Salvador (%)
Place of birth for the foreign-born population - Guatemala (%)
Place of birth for the foreign-born population - Honduras (%)
Place of birth for the foreign-born population - Mexico (%)
Place of birth for the foreign-born population - Nicaragua (%)
Place of birth for the foreign-born population - Panama (%)
Place of birth for the foreign-born population - Other Central America (%)
Place of birth for the foreign-born population - Argentina (%)
Place of birth for the foreign-born population - Bolivia (%)
Place of birth for the foreign-born population - Brazil (%)
Place of birth for the foreign-born population - Chile (%)
Place of birth for the foreign-born population - Colombia (%)
Place of birth for the foreign-born population - Ecuador (%)
Place of birth for the foreign-born population - Guyana (%)
Place of birth for the foreign-born population - Peru (%)
Place of birth for the foreign-born population - Uruguay (%)
Place of birth for the foreign-born population - Venezuela (%)
Place of birth for the foreign-born population - Other South America (%)
Place of birth for the foreign-born population - Canada (%)
Place of birth for the foreign-born population - Other Northern America (%)
Place of birth for the foreign-born population - Other (%)
Latest news about races in Saginaw, MI collected exclusively by city-data.com from local newspapers, TV, and radio stations
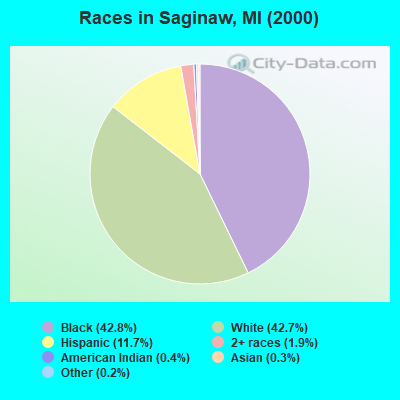
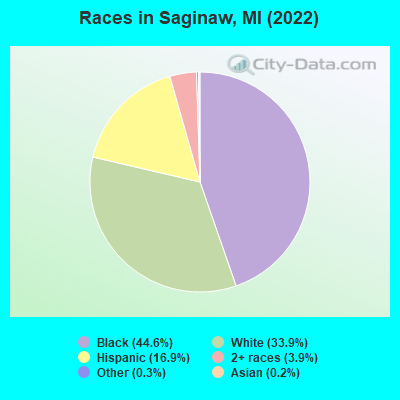
According to 2022 data, the most numerous races in Saginaw, MI are White alone (14,903 residents), Black alone (19,624 residents), and Hispanic (7,433 residents). 96.4% of Saginaw residents speak English at home. 1.0% of Saginaw, MI residents are foreign-born , which is 481.1% less than the foreign-born rate of 6.0% across the entire state of Michigan.
Race distribution in Saginaw
2000 2022
7,806,691 78.6% White alone 1,402,047 14.1% Black alone 323,877 3.3% Hispanic 175,311 1.8% Asian alone 163,487 1.6% Two or more races 53,421 0.5% American Indian alone 11,465 0.1% Other race alone 2,145 0.02% Native Hawaiian and Other
7,289,051 72.6% White alone 1,310,464 13.1% Black alone 572,405 5.7% Hispanic 450,031 4.5% Two or more races 335,732 3.3% Asian alone 45,217 0.5% Other race alone 29,011 0.3% American Indian alone 2,207 0.02% Native Hawaiian and Other
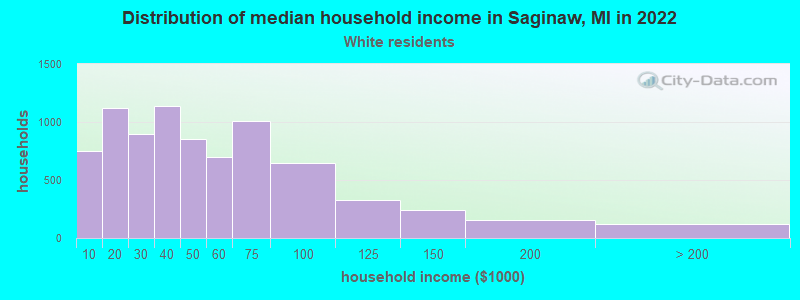
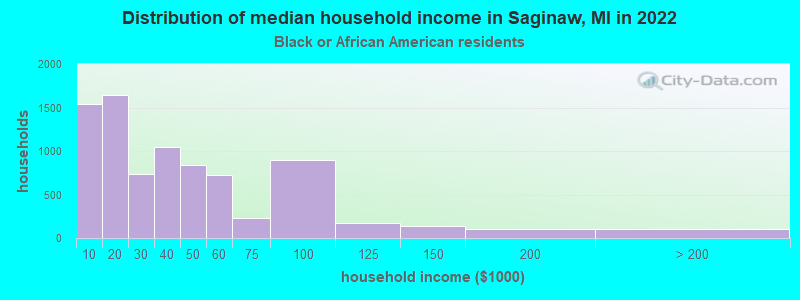
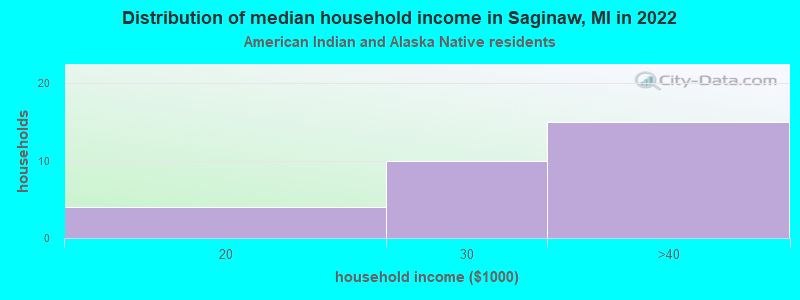
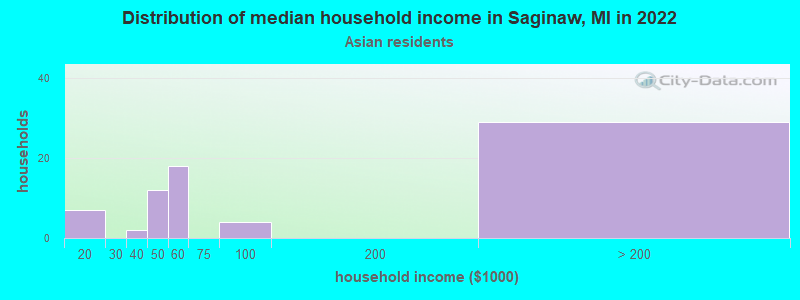
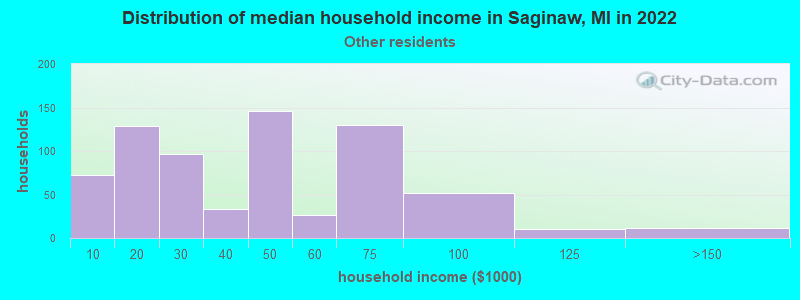
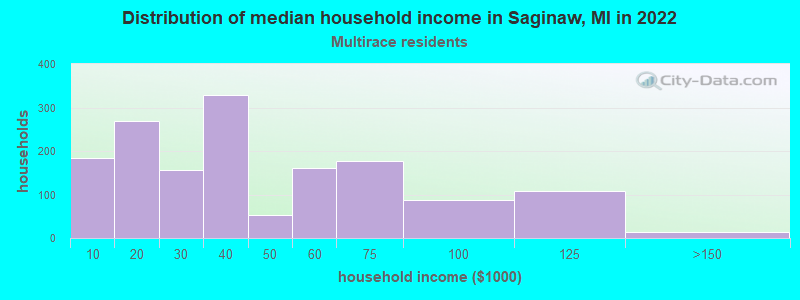
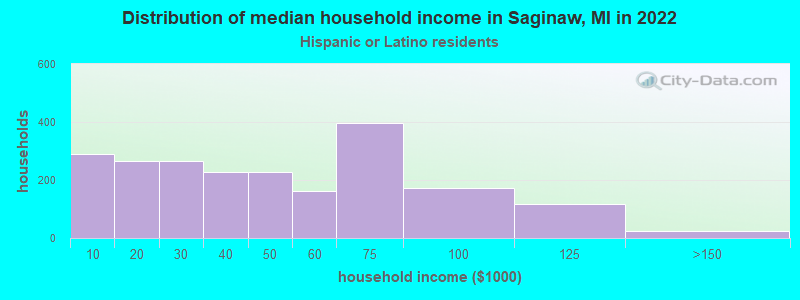
Income and house value in Saginaw Median household income in 2022 $42,586 White non-Hispanic householders$28,307 Black householders$53,539 American Indian and Alaska Native householders$32,530 Some other race householders$29,608 Two or more races householders$32,847 Hispanic or Latino race householdersMedian 2022 house value $68,144 White Non-Hispanic householders$43,420 Black or African American householders$67,652 American Indian or Alaska Native householders $151,542 Asian householders$50,432 Some other race householders$61,133 Two or more races householders$47,849 Hispanic or Latino householders
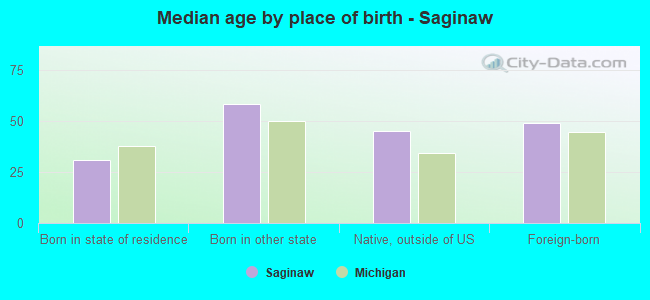
Median age by race in Saginaw
39.7 Median age for White residents39.6 41.8 33.0 Median age for Black or African American residents28.7 38.3 82.8 Median age for American Indian / Alaska Native residents48.8 84.5 48.8 Median age for Asian residents63.7 46.3 -666,666,666.0 Median age for Native Hawaiian / Pacific Islander residents-666,666,666.0 -666,666,666.0 41.6 Median age for Other race residents38.7 23.1 19.0 Median age for Two or more races residents15.7 24.7 41.2 Median age for White alone residents39.8 44.0 27.4 Median age for Hispanic or Latino residents26.6 26.5
Owner/renter occupied households by race in Saginaw
House owners and renters - White residents 5,537 72.8% Owner occupied2,070 27.2% Renter occupiedHouse owners and renters - Black or African American residents 3,466 43.9% Owner occupied4,425 56.1% Renter occupiedHouse owners and renters - American Indian / Alaska Native residents 19 59.4% Owner occupied13 40.6% Renter occupiedHouse owners and renters - Asian residents 35 43.0% Owner occupied46 57.0% Renter occupiedHouse owners and renters - Other race residents 539 76.0% Owner occupied171 24.0% Renter occupiedHouse owners and renters - Two or more races residents 719 57.1% Owner occupied540 42.9% Renter occupiedHouse owners and renters - White alone residents 5,131 72.3% Owner occupied1,966 27.7% Renter occupiedHouse owners and renters - Hispanic or Latino residents 1,285 70.8% Owner occupied530 29.2% Renter occupied
Language usage in Saginaw
English speakers - Total 96.4% of residents of Saginaw speak English at home.
3.3% of residents speak Spanish at home 885 66.5% Speak English very well445 33.5% Speak English less than very well0.7% of residents speak other language at home 278 94.9% Speak English very well15 5.1% Speak English less than very well
English speakers - Born in the United States 95.8% of residents of Saginaw speak English at home.
4.8% of residents speak Spanish at home 180 66.4% Speak English very well91 33.6% Speak English less than very well0.7% of residents speak other language at home 33 80.5% Speak English very well8 19.5% Speak English less than very well
English speakers - Native, born elsewhere 62.2% of residents of Saginaw speak English at home.
26.8% of residents speak Spanish at home 68 100.0% Speak English less than very well7.5% of residents speak other language at home 19 100.0% Speak English very well
English speakers - Foreign-born 39.8% of residents of Saginaw speak English at home.
34.2% of residents speak Spanish at home 27 19.1% Speak English very well114 80.9% Speak English less than very well24.3% of residents speak other language at home 90 90.0% Speak English very well10 10.0% Speak English less than very well
White (Caucasian) - Speak only English Native:
97.6% (15,907)Foreign-born:
25.5% (48)
White (Caucasian) - Speak another language Native:
3.3% (532)Foreign-born:
58.2% (109)
Black or African American - Speak only English Native:
99.5% (17,888)Foreign-born:
93.1% (40)
American Indian / Alaska Native - Speak another language Native:
5.7% (4)Foreign-born:
100.0% (2)
Asian - Speak another language Native:
92.3% (11)Foreign-born:
50.4% (32)
Other race - Speak another language Native:
24.5% (388)Foreign-born:
100.0% (13)
Two or more races - Speak only English Native:
92.6% (4,564)Foreign-born:
46.3% (89)
Two or more races - Speak another language Native:
6.6% (326)Foreign-born:
45.4% (87)
White alone - Speak only English Native:
98.6% (14,097)Foreign-born:
81.1% (48)
White alone - Speak another language Native:
1.0% (148)Foreign-born:
96.7% (57)
Hispanic or Latino - Speak only English Native:
83.1% (5,167)Foreign-born:
23.0% (43)
Hispanic or Latino - Speak another language Native:
16.4% (1,018)Foreign-born:
73.6% (136)
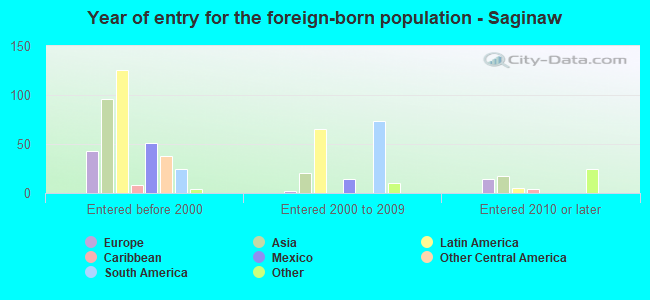
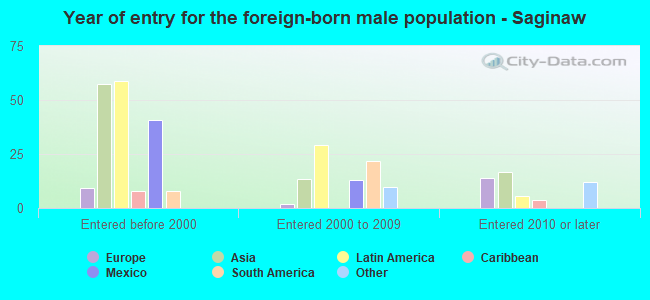
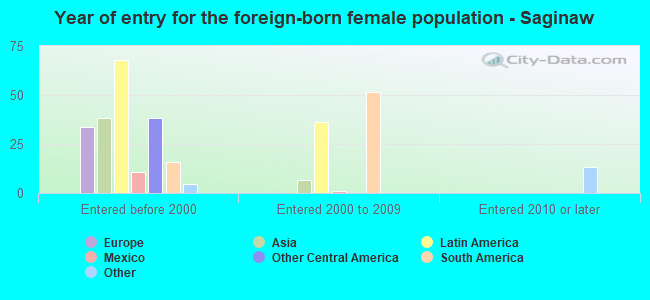
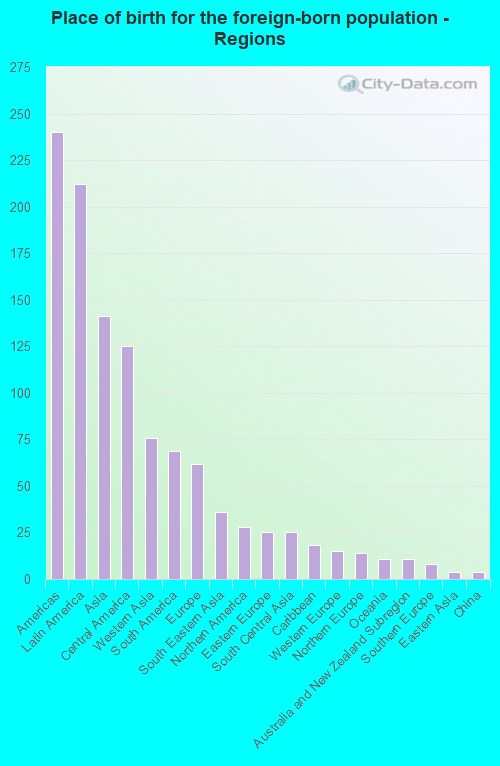
Foreign-born residents in Saginaw 454 residents are foreign born
This city:
1.0%Michigan:
6.9%
Marital status for residents in Saginaw Marital status - White (Caucasian) population 15 years and over
Males 48.2% Never married33.3% Now married1.1% Separated4.4% Widowed13.1% DivorcedFemales 34.2% Never married33.8% Now married2.4% Separated10.8% Widowed18.8% DivorcedWomen who gave birth in the past 12 months Now married:
63.2% (170)Unmarried:
36.8% (99)
Women who did not give birth in the past 12 months Now married:
29.7% (1,035)Unmarried:
70.3% (2,447)
Marital status - Black or African American population 15 years and over
Males 55.1% Never married27.2% Now married2.4% Separated3.2% Widowed12.1% DivorcedFemales 56.8% Never married18.9% Now married2.8% Separated7.3% Widowed14.2% DivorcedWomen who gave birth in the past 12 months Now married:
2.5% (5)Unmarried:
97.5% (193)
Women who did not give birth in the past 12 months Now married:
18.9% (914)Unmarried:
81.1% (3,918)
Marital status - American Indian / Alaska Native population 15 years and over
Males 51.4% Never married0.0% Now married37.1% Separated0.0% Widowed11.4% DivorcedFemales 86.4% Never married13.6% Now married0.0% Separated0.0% Widowed0.0% DivorcedWomen who did not give birth in the past 12 months Now married:
0.0% (0)Unmarried:
100.0% (19)
Marital status - Asian population 15 years and over
Males 19.6% Never married65.2% Now married0.0% Separated15.2% Widowed0.0% DivorcedFemales 90.5% Never married9.5% Now married0.0% Separated0.0% Widowed0.0% DivorcedWomen who did not give birth in the past 12 months Now married:
9.5% (2)Unmarried:
90.5% (20)
Marital status - Other race population 15 years and over
Males 32.1% Never married42.0% Now married0.0% Separated1.8% Widowed24.1% DivorcedFemales 52.7% Never married26.2% Now married0.0% Separated5.8% Widowed15.3% DivorcedWomen who gave birth in the past 12 months Now married:
0.0% (0)Unmarried:
100.0% (21)
Women who did not give birth in the past 12 months Now married:
18.6% (76)Unmarried:
81.4% (336)
Marital status - Two or more races population 15 years and over
Males 71.2% Never married18.3% Now married0.7% Separated3.8% Widowed6.0% DivorcedFemales 55.9% Never married18.3% Now married1.9% Separated1.5% Widowed22.4% DivorcedWomen who gave birth in the past 12 months Now married:
0.0% (0)Unmarried:
100.0% (285)
Women who did not give birth in the past 12 months Now married:
20.5% (257)Unmarried:
79.5% (997)
Marital status - White alone, not Hispanic / Latino population 15 years and over
Males 47.4% Never married32.4% Now married1.2% Separated4.8% Widowed14.2% DivorcedFemales 32.9% Never married32.9% Now married2.3% Separated11.6% Widowed20.3% DivorcedWomen who gave birth in the past 12 months Now married:
66.0% (176)Unmarried:
34.0% (90)
Women who did not give birth in the past 12 months Now married:
30.1% (947)Unmarried:
69.9% (2,202)
Marital status - Hispanic or Latino population 15 years and over
Males 52.1% Never married35.5% Now married0.6% Separated1.5% Widowed10.2% DivorcedFemales 49.7% Never married29.0% Now married2.0% Separated2.6% Widowed16.7% DivorcedWomen who gave birth in the past 12 months Now married:
0.0% (0)Unmarried:
100.0% (221)
Women who did not give birth in the past 12 months Now married:
24.5% (378)Unmarried:
75.5% (1,163)
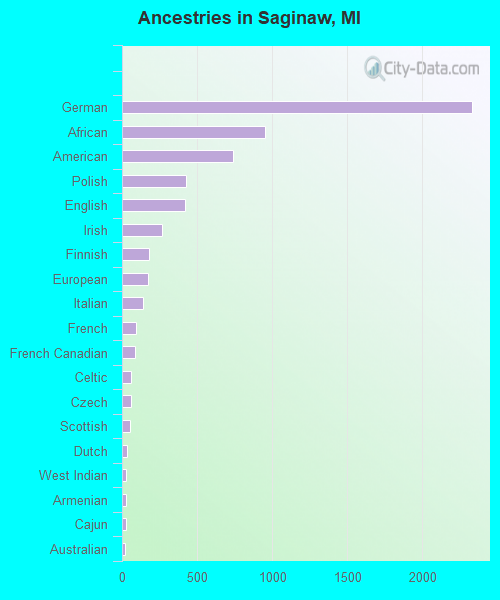
Ancestries in Saginaw
2,328 8.4% German955 3.5% African741 2.7% American428 1.6% Polish421 1.5% English265 1.0% Irish178 0.6% Finnish176 0.6% European143 0.5% Italian96 0.3% French85 0.3% French Canadian63 0.2% Celtic63 0.2% Czech53 0.2% Scottish30 0.1% Dutch29 0.1% West Indian28 0.1% Armenian26 0.09% Cajun22 0.08% Australian19 0.07% Slovak17 0.06% Scotch-Irish16 0.06% Scandinavian13 0.05% Lithuanian12 0.04% Hungarian11 0.04% Egyptian11 0.04% Ukrainian11 0.04% Welsh10 0.04% Assyrian10 0.04% Portuguese10 0.04% Senegalese8 0.03% Pennsylvania German8 0.03% Romanian8 0.03% Russian7 0.03% British7 0.03% Guyanese4 0.01% Swiss
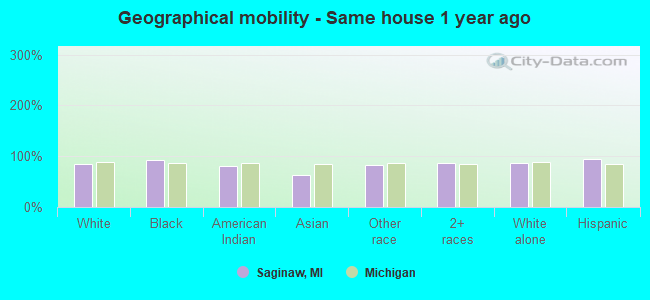
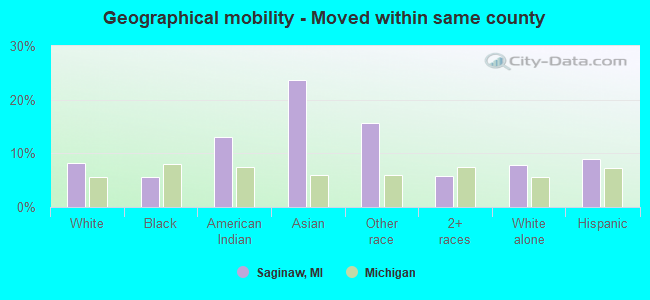
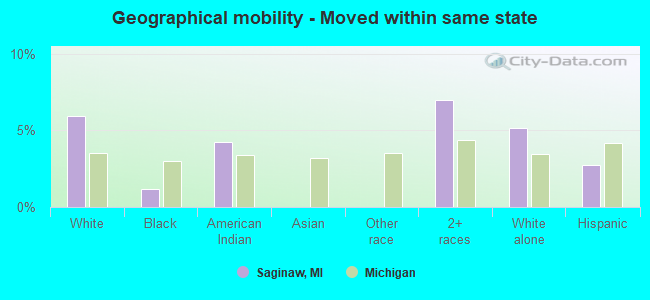
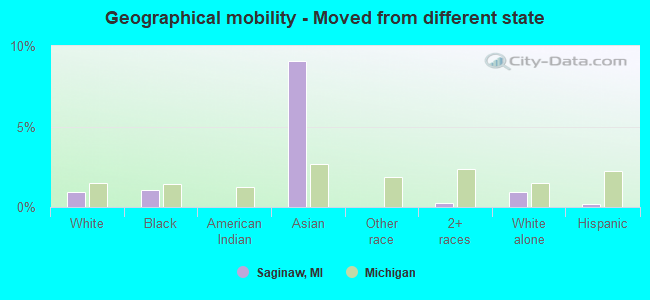
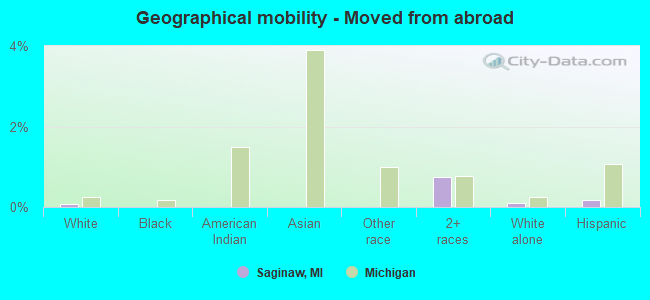
Geographical mobility in Saginaw Same house 1 year ago 14,510 85.5% White (Caucasian)18,300 92.8% Black or African American67 80.0% American Indian / Alaska Native44 62.1% Asian1,522 83.6% Other race4,444 86.6% Two or more races12,712 86.5% White alone, not Hispanic / Latino6,905 94.3% Hispanic or LatinoMoved within same county 1,392 8.2% White / Caucasian1,111 5.6% Black or African American11 13.1% American Indian / Alaska Native17 23.6% Asian283 15.6% Other race299 5.8% Two or more races1,142 7.8% White alone, not Hispanic / Latino661 9.0% Hispanic or LatinoMoved within same state 1,009 5.9% White / Caucasian226 1.1% Black or African American4 4.2% American Indian / Alaska Native360 7.0% Two or more races755 5.1% White alone, not Hispanic / Latino199 2.7% Hispanic or LatinoMoved from different state 153 0.9% White / Caucasian213 1.1% Black or African American6 9.0% Asian13 0.3% Two or more races138 0.9% White alone, not Hispanic / Latino14 0.2% Hispanic or LatinoMoved from abroad 14 0.1% White39 0.8% Two or more races15 0.1% White alone, not Hispanic / Latino13 0.2% Hispanic or Latino
Children Nativity (place of birth) in Saginaw
Children under 6 years - Living with two parents Both parents native 916 100.0% NativeOne native, one foreign-born parent 112 100.0% NativeChildren under 6 years - Living with one parent Native parent 2,951 100.0% NativeChildren 6 to 17 years - Living with two parents Both parents native 2,405 100.0% NativeBoth parents foreign-born 1 91.2% NativeOne native, one foreign-born parent 138 100.0% NativeChildren 6 to 17 years - Living with one parent Native parent 4,709 100.0% NativeForeign-born parent 3 49.3% Native3 50.7% Foreign-born
Grandparents responsible for own grandchildren in Saginaw
Grandparents (30 to 59 years) White / Caucasian 44 24.4% Responsible for grandchildren137 75.6% Not responsible for grandchildrenBlack or African American 144 70.5% Responsible for grandchildren60 29.5% Not responsible for grandchildrenOther race 8 100.0% Responsible for grandchildrenTwo or more races 2 100.0% Responsible for grandchildrenWhite alone, not Hispanic / Latino 33 19.8% Responsible for grandchildren132 80.2% Not responsible for grandchildrenHispanic or Latino 12 60.6% Responsible for grandchildren8 39.4% Not responsible for grandchildrenGrandparents (60 years and over) White / Caucasian 10 5.5% Responsible for grandchildren177 94.5% Not responsible for grandchildrenBlack or African American 127 75.4% Responsible for grandchildren42 24.6% Not responsible for grandchildrenOther race 87 76.5% Responsible for grandchildren27 23.5% Not responsible for grandchildrenWhite alone, not Hispanic / Latino 10 5.5% Responsible for grandchildren178 94.5% Not responsible for grandchildrenHispanic or Latino 38 59.7% Responsible for grandchildren26 40.3% Not responsible for grandchildren