Races in Salem, Oregon (OR) Detailed Stats
Data:
Races - White alone (%)
Races - White alone (% change since 2000)
Races - Black alone (%)
Races - Black alone (% change since 2000)
Races - American Indian alone (%)
Races - American Indian alone (% change since 2000)
Races - Asian alone (%)
Races - Asian alone (% change since 2000)
Races - Hispanic (%)
Races - Hispanic (% change since 2000)
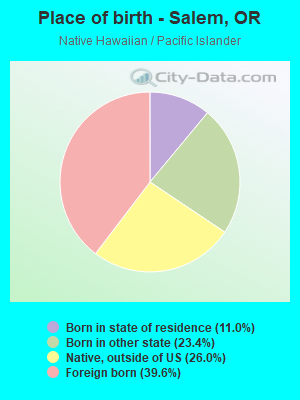
Races - Native Hawaiian and Other Pacific Islander alone (%)
Races - Native Hawaiian and Other Pacific Islander alone (% change since 2000)
Races - Two or more races(%)
Races - Two or more races(% change since 2000)
Races - Other race alone (%)
Races - Other race alone (% change since 2000)
Racial diversity
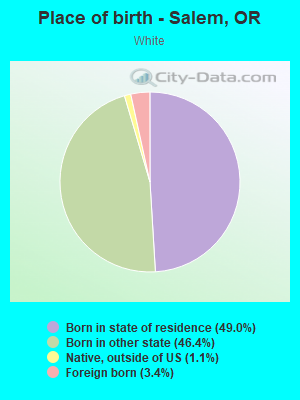
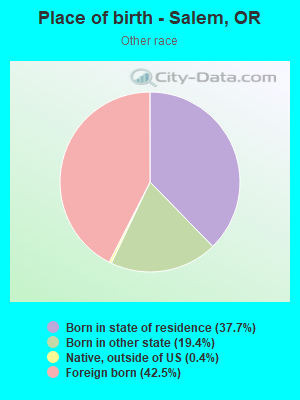
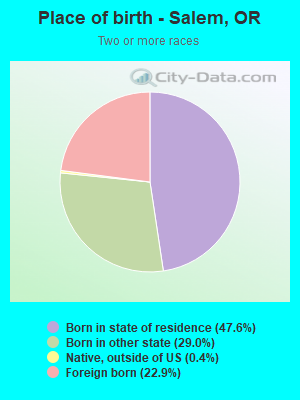
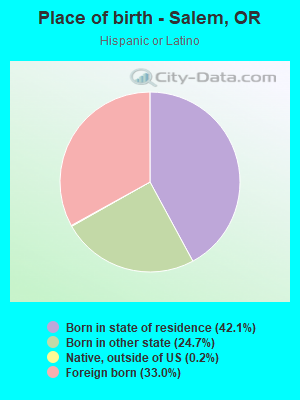
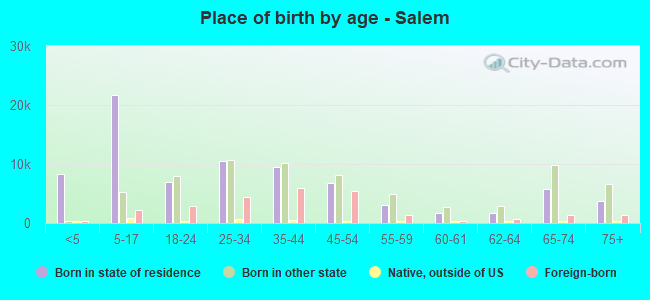
Place of birth - Born in state of residence (%)
Place of birth - Born in state of residence (%) - White
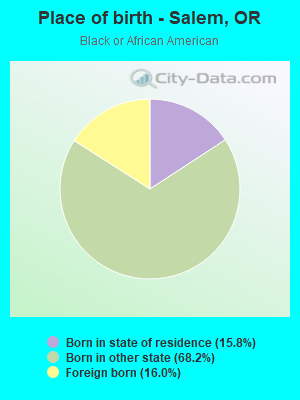
Place of birth - Born in state of residence (%) - Black or African American
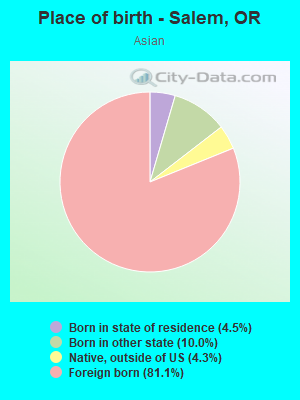
Place of birth - Born in state of residence (%) - Asian
Place of birth - Born in state of residence (%) - Hispanic or Latino
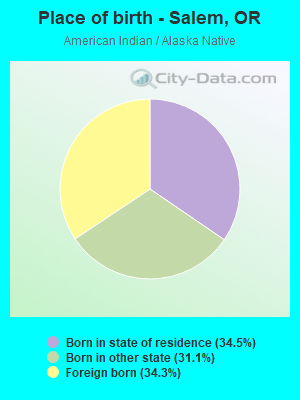
Place of birth - Born in state of residence (%) - American Indian and Alaska Native
Place of birth - Born in state of residence (%) - Multirace
Place of birth - Born in state of residence (%) - Other Race
Place of birth - Born in other state (%)
Place of birth - Born in other state (%) - White
Place of birth - Born in other state (%) - Black or African American
Place of birth - Born in other state (%) - Asian
Place of birth - Born in other state (%) - Hispanic or Latino
Place of birth - Born in other state (%) - American Indian and Alaska Native
Place of birth - Born in other state (%) - Multirace
Place of birth - Born in other state (%) - Other Race
Place of birth - Native, outside of US (%)
Place of birth - Native, outside of US (%) - White
Place of birth - Native, outside of US (%) - Black or African American
Place of birth - Native, outside of US (%) - Asian
Place of birth - Native, outside of US (%) - Hispanic or Latino
Place of birth - Native, outside of US (%) - American Indian and Alaska Native
Place of birth - Native, outside of US (%) - Multirace
Place of birth - Native, outside of US (%) - Other Race
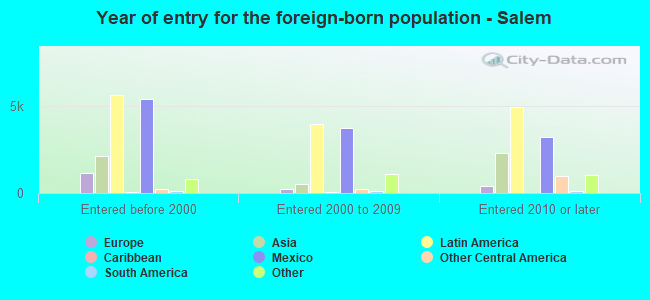
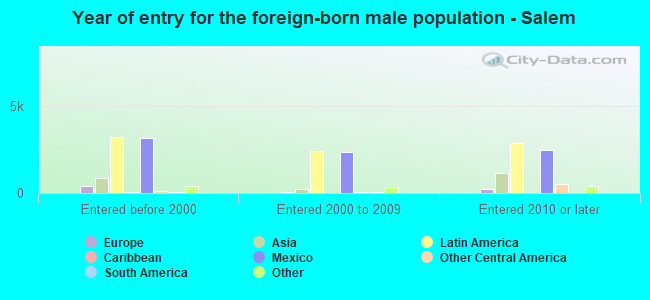
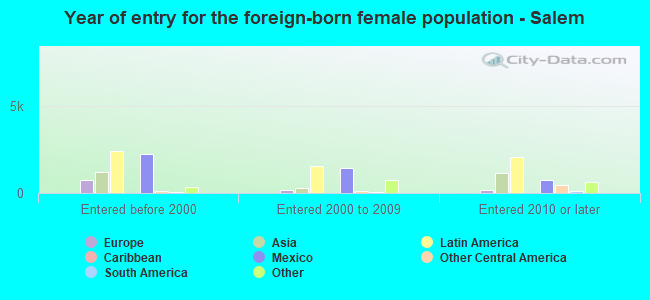
Place of birth - Foreign born (%)
Place of birth - Foreign born (%) - White
Place of birth - Foreign born (%) - Black or African American
Place of birth - Foreign born (%) - Asian
Place of birth - Foreign born (%) - Hispanic or Latino
Place of birth - Foreign born (%) - American Indian and Alaska Native
Place of birth - Foreign born (%) - Multirace
Place of birth - Foreign born (%) - Other Race
Residents speaking English at home (%)
Residents speaking English at home - Born in the United States (%)
Residents speaking English at home - Native, born elsewhere (%)
Residents speaking English at home - Foreign born (%)
Residents speaking Spanish at home (%)
Residents speaking Spanish at home - Born in the United States (%)
Residents speaking Spanish at home - Native, born elsewhere (%)
Residents speaking Spanish at home - Foreign born (%)
Residents speaking other language at home (%)
Residents speaking other language at home - Born in the United States (%)
Residents speaking other language at home - Native, born elsewhere (%)
Residents speaking other language at home - Foreign born (%)
Marital status - Never married (%)
Marital status - Now married (%)
Marital status - Separated (%)
Marital status - Widowed (%)
Marital status - Divorced (%)
Ancestries Reported - Arab (%)
Ancestries Reported - Czech (%)
Ancestries Reported - Danish (%)
Ancestries Reported - Dutch (%)
Ancestries Reported - English (%)
Ancestries Reported - French (%)
Ancestries Reported - French Canadian (%)
Ancestries Reported - German (%)
Ancestries Reported - Greek (%)
Ancestries Reported - Hungarian (%)
Ancestries Reported - Irish (%)
Ancestries Reported - Italian (%)
Ancestries Reported - Lithuanian (%)
Ancestries Reported - Norwegian (%)
Ancestries Reported - Polish (%)
Ancestries Reported - Portuguese (%)
Ancestries Reported - Russian (%)
Ancestries Reported - Scotch-Irish (%)
Ancestries Reported - Scottish (%)
Ancestries Reported - Slovak (%)
Ancestries Reported - Subsaharan African (%)
Ancestries Reported - Swedish (%)
Ancestries Reported - Swiss (%)
Ancestries Reported - Ukrainian (%)
Ancestries Reported - United States (%)
Ancestries Reported - Welsh (%)
Ancestries Reported - West Indian (%)
Ancestries Reported - Other (%)
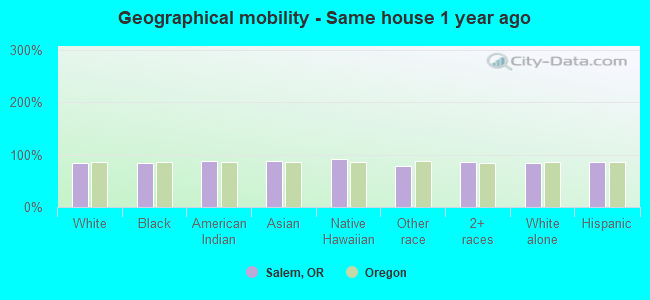
Geographical mobility - Same house 1 year ago (%)
Geographical mobility - Same house 1 year ago (%) - White
Geographical mobility - Same house 1 year ago (%) - Black or African American
Geographical mobility - Same house 1 year ago (%) - Asian
Geographical mobility - Same house 1 year ago (%) - Hispanic or Latino
Geographical mobility - Same house 1 year ago (%) - American Indian and Alaska Native
Geographical mobility - Same house 1 year ago (%) - Multirace
Geographical mobility - Same house 1 year ago (%) - Other Race
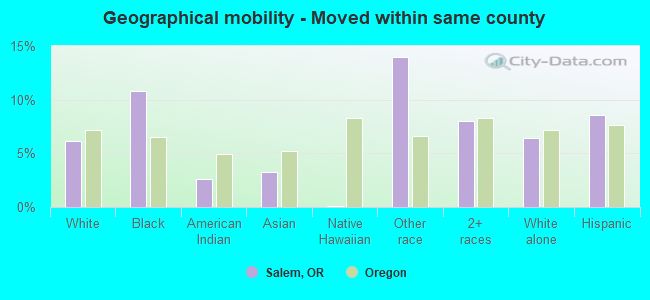
Geographical mobility - Moved within same county (%)
Geographical mobility - Moved within same county (%) - White
Geographical mobility - Moved within same county (%) - Black or African American
Geographical mobility - Moved within same county (%) - Asian
Geographical mobility - Moved within same county (%) - Hispanic or Latino
Geographical mobility - Moved within same county (%) - American Indian and Alaska Native
Geographical mobility - Moved within same county (%) - Multirace
Geographical mobility - Moved within same county (%) - Other Race
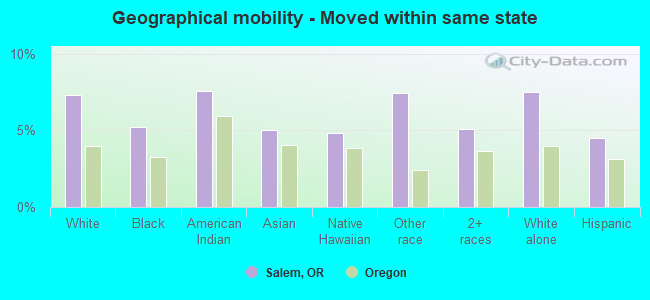
Geographical mobility - Moved from different county within same state (%)
Geographical mobility - Moved from different county within same state (%) - White
Geographical mobility - Moved from different county within same state (%) - Black or African American
Geographical mobility - Moved from different county within same state (%) - Asian
Geographical mobility - Moved from different county within same state (%) - Hispanic or Latino
Geographical mobility - Moved from different county within same state (%) - American Indian and Alaska Native
Geographical mobility - Moved from different county within same state (%) - Multirace
Geographical mobility - Moved from different county within same state (%) - Other Race
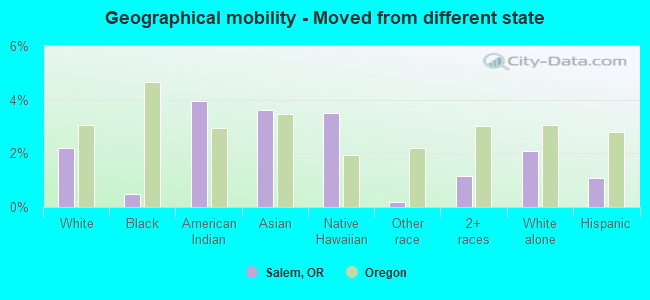
Geographical mobility - Moved from different state (%)
Geographical mobility - Moved from different state (%) - White
Geographical mobility - Moved from different state (%) - Black or African American
Geographical mobility - Moved from different state (%) - Asian
Geographical mobility - Moved from different state (%) - Hispanic or Latino
Geographical mobility - Moved from different state (%) - American Indian and Alaska Native
Geographical mobility - Moved from different state (%) - Multirace
Geographical mobility - Moved from different state (%) - Other Race
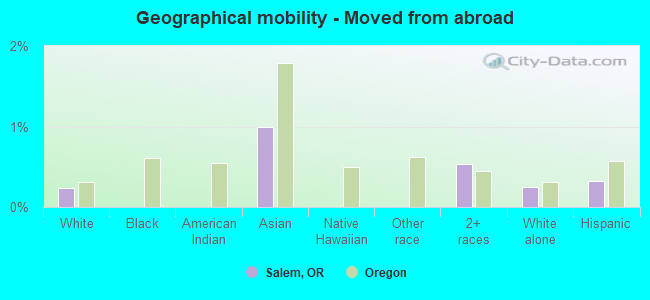
Geographical mobility - Moved from abroad (%)
Geographical mobility - Moved from abroad (%) - White
Geographical mobility - Moved from abroad (%) - Black or African American
Geographical mobility - Moved from abroad (%) - Asian
Geographical mobility - Moved from abroad (%) - Hispanic or Latino
Geographical mobility - Moved from abroad (%) - American Indian and Alaska Native
Geographical mobility - Moved from abroad (%) - Multirace
Geographical mobility - Moved from abroad (%) - Other Race
Place of birth for the foreign-born population - Ireland (%)
Place of birth for the foreign-born population - Denmark (%)
Place of birth for the foreign-born population - Norway (%)
Place of birth for the foreign-born population - Sweden (%)
Place of birth for the foreign-born population - United Kingdom (%)
Place of birth for the foreign-born population - England (%)
Place of birth for the foreign-born population - Scotland (%)
Place of birth for the foreign-born population - Other Northern Europe (%)
Place of birth for the foreign-born population - Austria (%)
Place of birth for the foreign-born population - Belgium (%)
Place of birth for the foreign-born population - France (%)
Place of birth for the foreign-born population - Germany (%)
Place of birth for the foreign-born population - Netherlands (%)
Place of birth for the foreign-born population - Switzerland (%)
Place of birth for the foreign-born population - Other Western Europe (%)
Place of birth for the foreign-born population - Greece (%)
Place of birth for the foreign-born population - Italy (%)
Place of birth for the foreign-born population - Portugal (%)
Place of birth for the foreign-born population - Spain (%)
Place of birth for the foreign-born population - Other Southern Europe (%)
Place of birth for the foreign-born population - Albania (%)
Place of birth for the foreign-born population - Belarus (%)
Place of birth for the foreign-born population - Bosnia and Herzegovina (%)
Place of birth for the foreign-born population - Bulgaria (%)
Place of birth for the foreign-born population - Croatia (%)
Place of birth for the foreign-born population - Czechoslovakia (%)
Place of birth for the foreign-born population - Hungary (%)
Place of birth for the foreign-born population - Latvia (%)
Place of birth for the foreign-born population - Lithuania (%)
Place of birth for the foreign-born population - North Macedonia (Macedonia) (%)
Place of birth for the foreign-born population - Moldova (%)
Place of birth for the foreign-born population - Poland (%)
Place of birth for the foreign-born population - Romania (%)
Place of birth for the foreign-born population - Russia (%)
Place of birth for the foreign-born population - Serbia (%)
Place of birth for the foreign-born population - Ukraine (%)
Place of birth for the foreign-born population - Other Eastern Europe (%)
Place of birth for the foreign-born population - China (%)
Place of birth for the foreign-born population - Hong Kong (%)
Place of birth for the foreign-born population - Taiwan (%)
Place of birth for the foreign-born population - Japan (%)
Place of birth for the foreign-born population - Korea (%)
Place of birth for the foreign-born population - Other Eastern Asia (%)
Place of birth for the foreign-born population - Afghanistan (%)
Place of birth for the foreign-born population - Bangladesh (%)
Place of birth for the foreign-born population - India (%)
Place of birth for the foreign-born population - Iran (%)
Place of birth for the foreign-born population - Kazakhstan (%)
Place of birth for the foreign-born population - Nepal (%)
Place of birth for the foreign-born population - Pakistan (%)
Place of birth for the foreign-born population - Sri Lanka (%)
Place of birth for the foreign-born population - Uzbekistan (%)
Place of birth for the foreign-born population - Other South Central Asia (%)
Place of birth for the foreign-born population - Burma (%)
Place of birth for the foreign-born population - Cambodia (%)
Place of birth for the foreign-born population - Indonesia (%)
Place of birth for the foreign-born population - Laos (%)
Place of birth for the foreign-born population - Malaysia (%)
Place of birth for the foreign-born population - Philippines (%)
Place of birth for the foreign-born population - Singapore (%)
Place of birth for the foreign-born population - Thailand (%)
Place of birth for the foreign-born population - Vietnam (%)
Place of birth for the foreign-born population - Other South Eastern Asia (%)
Place of birth for the foreign-born population - Armenia (%)
Place of birth for the foreign-born population - Iraq (%)
Place of birth for the foreign-born population - Israel (%)
Place of birth for the foreign-born population - Jordan (%)
Place of birth for the foreign-born population - Kuwait (%)
Place of birth for the foreign-born population - Lebanon (%)
Place of birth for the foreign-born population - Saudi Arabia (%)
Place of birth for the foreign-born population - Syria (%)
Place of birth for the foreign-born population - Turkey (%)
Place of birth for the foreign-born population - Yemen (%)
Place of birth for the foreign-born population - Other Western Asia (%)
Place of birth for the foreign-born population - Eritrea (%)
Place of birth for the foreign-born population - Ethiopia (%)
Place of birth for the foreign-born population - Kenya (%)
Place of birth for the foreign-born population - Somalia (%)
Place of birth for the foreign-born population - Uganda (%)
Place of birth for the foreign-born population - Zimbabwe (%)
Place of birth for the foreign-born population - Other Eastern Africa (%)
Place of birth for the foreign-born population - Cameroon (%)
Place of birth for the foreign-born population - Congo (%)
Place of birth for the foreign-born population - Democratic Republic of Congo (Zaire) (%)
Place of birth for the foreign-born population - Other Middle Africa (%)
Place of birth for the foreign-born population - Egypt (%)
Place of birth for the foreign-born population - Morocco (%)
Place of birth for the foreign-born population - Sudan (%)
Place of birth for the foreign-born population - Other Northern Africa (%)
Place of birth for the foreign-born population - South Africa (%)
Place of birth for the foreign-born population - Other Southern Africa (%)
Place of birth for the foreign-born population - Cabo Verde (%)
Place of birth for the foreign-born population - Ghana (%)
Place of birth for the foreign-born population - Liberia (%)
Place of birth for the foreign-born population - Nigeria (%)
Place of birth for the foreign-born population - Senegal (%)
Place of birth for the foreign-born population - Sierra Leone (%)
Place of birth for the foreign-born population - Other Western Africa (%)
Place of birth for the foreign-born population - Australia (%)
Place of birth for the foreign-born population - New Zealand (%)
Place of birth for the foreign-born population - Fiji (%)
Place of birth for the foreign-born population - Micronesia (%)
Place of birth for the foreign-born population - Bahamas (%)
Place of birth for the foreign-born population - Barbados (%)
Place of birth for the foreign-born population - Cuba (%)
Place of birth for the foreign-born population - Dominica (%)
Place of birth for the foreign-born population - Dominican Republic (%)
Place of birth for the foreign-born population - Grenada (%)
Place of birth for the foreign-born population - Haiti (%)
Place of birth for the foreign-born population - Jamaica (%)
Place of birth for the foreign-born population - St. Vincent and the Grenadines (%)
Place of birth for the foreign-born population - Trinidad and Tobago (%)
Place of birth for the foreign-born population - West Indies (%)
Place of birth for the foreign-born population - Other Caribbean (%)
Place of birth for the foreign-born population - Belize (%)
Place of birth for the foreign-born population - Costa Rica (%)
Place of birth for the foreign-born population - El Salvador (%)
Place of birth for the foreign-born population - Guatemala (%)
Place of birth for the foreign-born population - Honduras (%)
Place of birth for the foreign-born population - Mexico (%)
Place of birth for the foreign-born population - Nicaragua (%)
Place of birth for the foreign-born population - Panama (%)
Place of birth for the foreign-born population - Other Central America (%)
Place of birth for the foreign-born population - Argentina (%)
Place of birth for the foreign-born population - Bolivia (%)
Place of birth for the foreign-born population - Brazil (%)
Place of birth for the foreign-born population - Chile (%)
Place of birth for the foreign-born population - Colombia (%)
Place of birth for the foreign-born population - Ecuador (%)
Place of birth for the foreign-born population - Guyana (%)
Place of birth for the foreign-born population - Peru (%)
Place of birth for the foreign-born population - Uruguay (%)
Place of birth for the foreign-born population - Venezuela (%)
Place of birth for the foreign-born population - Other South America (%)
Place of birth for the foreign-born population - Canada (%)
Place of birth for the foreign-born population - Other Northern America (%)
Place of birth for the foreign-born population - Other (%)
Latest news about races in Salem, OR collected exclusively by city-data.com from local newspapers, TV, and radio stations
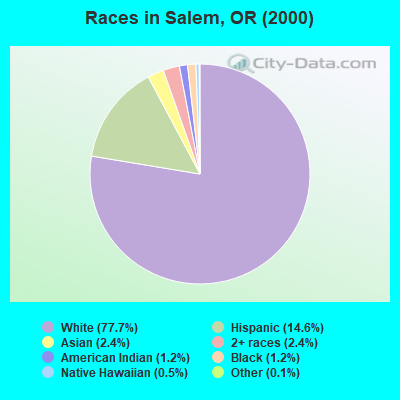
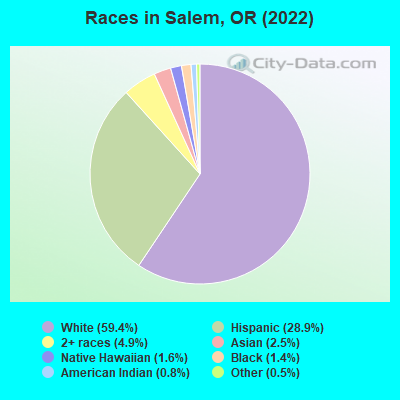
According to 2022 data, the most numerous races in Salem, OR are White alone (105,371 residents), Hispanic (51,360 residents), and Two or more races (8,638 residents). 74.6% of Salem residents speak English at home. 11.8% of Salem, OR residents are foreign-born (6.8% born in Latin America, 2.5% born in Asia), which is 23.6% greater than the foreign-born rate of 9.0% across the entire state of Oregon.
Race distribution in Salem
2000 2022
106,331 77.7% White alone 19,973 14.6% Hispanic 3,227 2.4% Two or more races 3,268 2.4% Asian alone 1,621 1.2% Black alone 1,692 1.2% American Indian alone 617 0.5% Native Hawaiian and Other 195 0.1% Other race alone
105,371 59.4% White alone 51,360 28.9% Hispanic 8,638 4.9% Two or more races 4,375 2.5% Asian alone 2,852 1.6% Native Hawaiian and Other 2,494 1.4% Black alone 1,498 0.8% American Indian alone 902 0.5% Other race alone
2000 2022
2,857,616 83.5% White alone 275,314 8.0% Hispanic 100,333 2.9% Asian alone 82,733 2.4% Two or more races 53,325 1.6% Black alone 40,130 1.2% American Indian alone 7,398 0.2% Native Hawaiian and Other 4,550 0.1% Other race alone
3,037,571 71.6% White alone 609,538 14.4% Hispanic 252,744 6.0% Two or more races 191,283 4.5% Asian alone 78,228 1.8% Black alone 29,399 0.7% American Indian alone 25,731 0.6% Other race alone 15,643 0.4% Native Hawaiian and Other
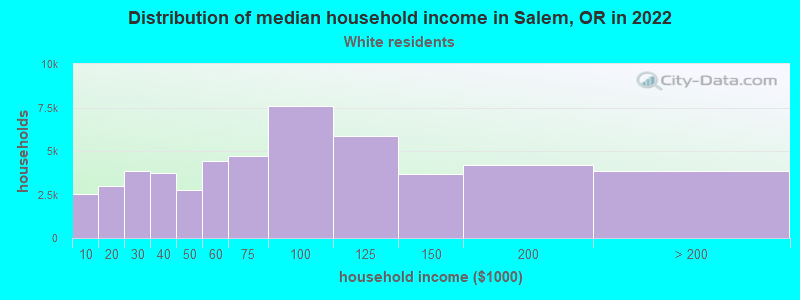
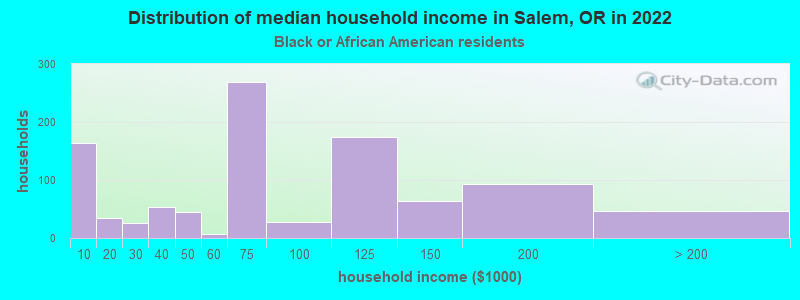
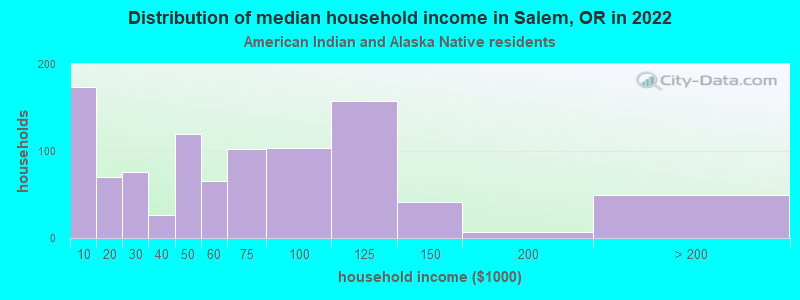
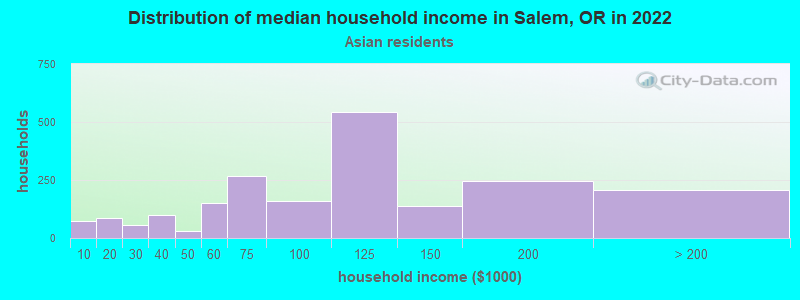
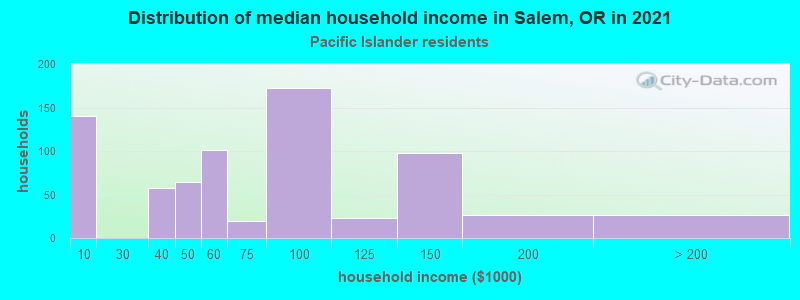
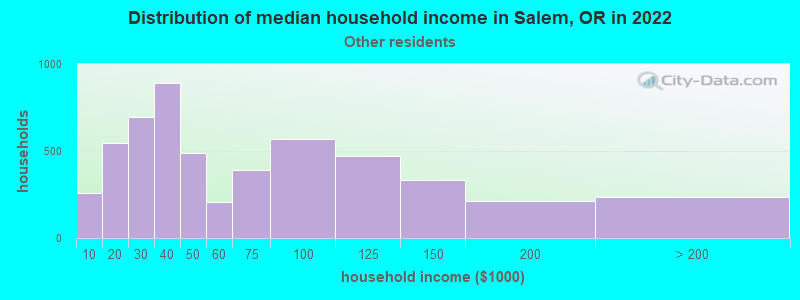
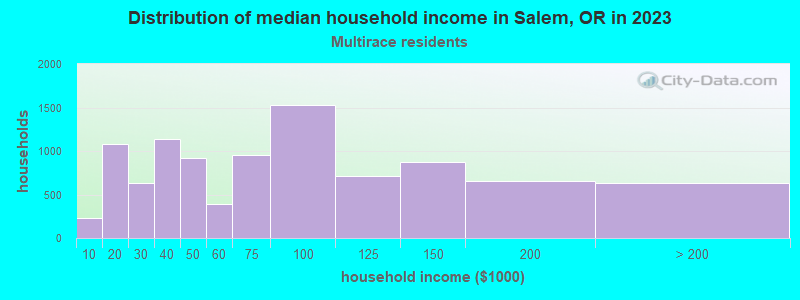
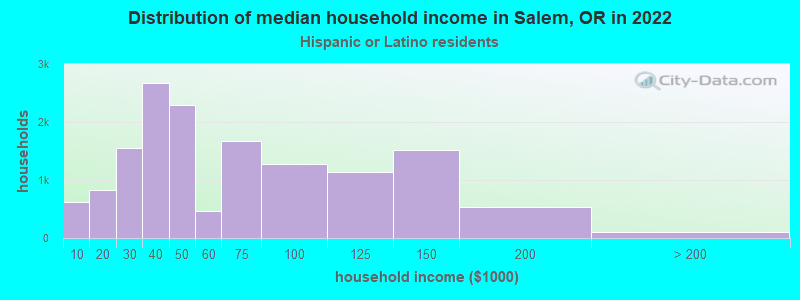
Income and house value in Salem Median household income in 2022 $78,411 White non-Hispanic householders$85,348 Black householders$96,891 American Indian and Alaska Native householders$125,366 Asian householders$40,775 Some other race householders$49,606 Two or more races householders$46,074 Hispanic or Latino race householdersMedian 2022 house value $419,113 White Non-Hispanic householders$380,955 Black or African American householders$375,594 American Indian or Alaska Native householders $406,499 Asian householders$451,595 Native Hawaiian and other Pacific Islander householders$324,505 Some other race householders$386,000 Two or more races householders$349,103 Hispanic or Latino householders
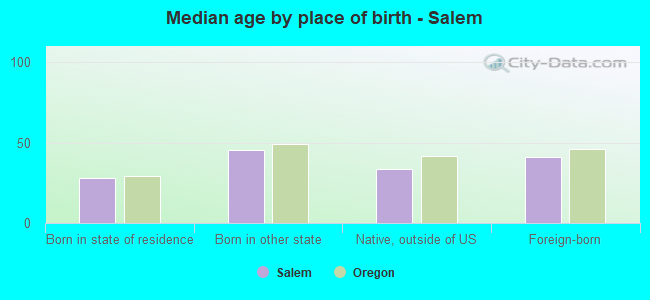
Median age by race in Salem
41.9 Median age for White residents40.3 45.5 32.1 Median age for Black or African American residents27.2 32.8 26.9 Median age for American Indian / Alaska Native residents26.6 46.1 42.8 Median age for Asian residents45.9 40.3 40.1 Median age for Native Hawaiian / Pacific Islander residents34.7 42.2 24.8 Median age for Other race residents26.2 23.6 25.8 Median age for Two or more races residents27.3 24.3 44.4 Median age for White alone residents41.1 48.0 24.7 Median age for Hispanic or Latino residents24.8 24.6
Owner/renter occupied households by race in Salem
House owners and renters - White residents 30,930 61.7% Owner occupied19,187 38.3% Renter occupiedHouse owners and renters - Black or African American residents 395 30.7% Owner occupied891 69.3% Renter occupiedHouse owners and renters - American Indian / Alaska Native residents 470 40.1% Owner occupied702 59.9% Renter occupiedHouse owners and renters - Asian residents 1,056 71.8% Owner occupied415 28.2% Renter occupiedHouse owners and renters - Native Hawaiian / Pacific Islander residents 110 11.2% Owner occupied872 88.8% Renter occupiedHouse owners and renters - Other race residents 2,104 36.2% Owner occupied3,708 63.8% Renter occupiedHouse owners and renters - Two or more races residents 2,601 33.2% Owner occupied5,226 66.8% Renter occupiedHouse owners and renters - White alone residents 29,894 63.5% Owner occupied17,177 36.5% Renter occupiedHouse owners and renters - Hispanic or Latino residents 4,996 34.0% Owner occupied9,677 66.0% Renter occupied
Language usage in Salem
English speakers - Total 74.6% of residents of Salem speak English at home.
20.1% of residents speak Spanish at home 17,070 50.3% Speak English very well16,865 49.7% Speak English less than very well5.3% of residents speak other language at home 5,732 64.4% Speak English very well3,163 35.6% Speak English less than very well
English speakers - Born in the United States 89.5% of residents of Salem speak English at home.
8.3% of residents speak Spanish at home 4,841 84.1% Speak English very well913 15.9% Speak English less than very well2.2% of residents speak other language at home 1,114 74.0% Speak English very well392 26.0% Speak English less than very well
English speakers - Native, born elsewhere 72.6% of residents of Salem speak English at home.
27.4% of residents speak other language at home 671 100.0% Speak English very well
English speakers - Foreign-born 13.5% of residents of Salem speak English at home.
63.1% of residents speak Spanish at home 3,201 19.7% Speak English very well13,049 80.3% Speak English less than very well23.4% of residents speak other language at home 3,247 54.0% Speak English very well2,771 46.0% Speak English less than very well
White (Caucasian) - Speak only English Native:
96.7% (101,683)Foreign-born:
43.0% (1,609)
White (Caucasian) - Speak another language Native:
3.3% (3,474)Foreign-born:
57.0% (2,135)
Black or African American - Speak only English Native:
73.5% (1,536)Foreign-born:
39.8% (277)
Black or African American - Speak another language Native:
10.0% (209)Foreign-born:
44.7% (311)
American Indian / Alaska Native - Speak another language Native:
27.0% (499)Foreign-born:
100.0% (413)
Asian - Speak only English Native:
95.7% (625)Foreign-born:
15.9% (565)
Asian - Speak another language Native:
4.3% (28)Foreign-born:
84.1% (2,984)
Native Hawaiian / Pacific Islander - Speak only English Native:
23.7% (349)Foreign-born:
2.9% (42)
Native Hawaiian / Pacific Islander - Speak another language Native:
80.0% (1,178)Foreign-born:
96.9% (1,395)
Other race - Speak only English Native:
34.1% (3,143)Foreign-born:
7.0% (563)
Other race - Speak another language Native:
65.9% (6,071)Foreign-born:
93.0% (7,471)
Two or more races - Speak only English Native:
61.1% (12,795)Foreign-born:
5.7% (407)
Two or more races - Speak another language Native:
38.9% (8,131)Foreign-born:
94.3% (6,706)
White alone - Speak only English Native:
98.5% (98,091)Foreign-born:
47.1% (1,609)
White alone - Speak another language Native:
1.5% (1,484)Foreign-born:
52.9% (1,810)
Hispanic or Latino - Speak only English Native:
42.7% (12,478)Foreign-born:
5.7% (970)
Hispanic or Latino - Speak another language Native:
57.3% (16,753)Foreign-born:
94.3% (15,991)
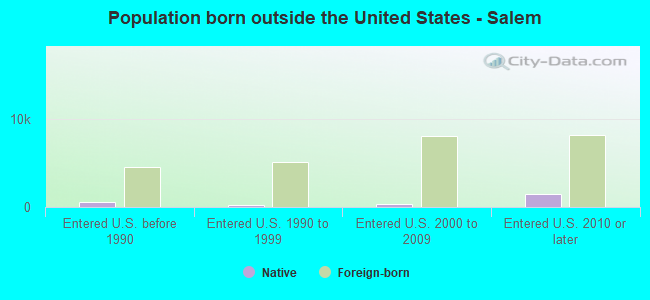
Foreign-born residents in Salem 20,757 residents are foreign born (6.8% Latin America , 2.5% Asia ).
This city:
11.8%Oregon:
9.8%
Marital status for residents in Salem Marital status - White (Caucasian) population 15 years and over
Males 34.9% Never married45.4% Now married0.9% Separated3.5% Widowed15.3% DivorcedFemales 27.6% Never married42.4% Now married1.5% Separated8.9% Widowed19.6% DivorcedWomen who gave birth in the past 12 months Now married:
50.8% (338)Unmarried:
49.2% (327)
Women who did not give birth in the past 12 months Now married:
39.7% (9,858)Unmarried:
60.3% (14,979)
Marital status - Black or African American population 15 years and over
Males 56.8% Never married30.1% Now married0.0% Separated3.3% Widowed9.8% DivorcedFemales 58.4% Never married30.3% Now married0.0% Separated0.9% Widowed10.4% DivorcedWomen who gave birth in the past 12 months Now married:
100.0% (25)Unmarried:
0.0% (0)
Women who did not give birth in the past 12 months Now married:
25.2% (156)Unmarried:
74.8% (462)
Marital status - American Indian / Alaska Native population 15 years and over
Males 53.9% Never married25.0% Now married0.0% Separated2.3% Widowed18.8% DivorcedFemales 54.9% Never married30.6% Now married1.8% Separated0.8% Widowed11.9% DivorcedWomen who gave birth in the past 12 months Now married:
83.3% (16)Unmarried:
16.7% (3)
Women who did not give birth in the past 12 months Now married:
17.6% (98)Unmarried:
82.4% (460)
Marital status - Asian population 15 years and over
Males 32.4% Never married62.0% Now married1.2% Separated1.2% Widowed3.2% DivorcedFemales 24.0% Never married59.7% Now married1.3% Separated6.5% Widowed8.5% DivorcedWomen who gave birth in the past 12 months Now married:
100.0% (308)Unmarried:
0.0% (0)
Women who did not give birth in the past 12 months Now married:
29.3% (443)Unmarried:
70.7% (1,071)
Marital status - Native Hawaiian / Pacific Islander population 15 years and over
Males 53.9% Never married33.5% Now married2.0% Separated10.1% Widowed0.5% DivorcedFemales 59.7% Never married29.1% Now married0.0% Separated9.9% Widowed1.3% DivorcedWomen who gave birth in the past 12 months Now married:
32.0% (8)Unmarried:
68.0% (18)
Women who did not give birth in the past 12 months Now married:
26.5% (298)Unmarried:
73.5% (824)
Marital status - Other race population 15 years and over
Males 55.8% Never married37.0% Now married0.0% Separated1.0% Widowed6.2% DivorcedFemales 49.1% Never married28.5% Now married7.7% Separated2.2% Widowed12.5% DivorcedWomen who gave birth in the past 12 months Now married:
49.4% (505)Unmarried:
50.6% (518)
Women who did not give birth in the past 12 months Now married:
29.9% (1,542)Unmarried:
70.1% (3,608)
Marital status - Two or more races population 15 years and over
Males 46.5% Never married36.4% Now married1.0% Separated0.0% Widowed16.1% DivorcedFemales 43.0% Never married33.6% Now married2.4% Separated1.1% Widowed19.9% DivorcedWomen who gave birth in the past 12 months Now married:
100.0% (552)Unmarried:
0.0% (0)
Women who did not give birth in the past 12 months Now married:
29.6% (2,184)Unmarried:
70.4% (5,187)
Marital status - White alone, not Hispanic / Latino population 15 years and over
Males 34.8% Never married45.4% Now married0.9% Separated3.0% Widowed15.9% DivorcedFemales 26.4% Never married43.7% Now married1.6% Separated8.7% Widowed19.7% DivorcedWomen who gave birth in the past 12 months Now married:
44.2% (259)Unmarried:
55.8% (327)
Women who did not give birth in the past 12 months Now married:
42.1% (9,443)Unmarried:
57.9% (12,993)
Marital status - Hispanic or Latino population 15 years and over
Males 50.1% Never married39.2% Now married0.4% Separated2.3% Widowed8.1% DivorcedFemales 43.7% Never married32.2% Now married3.2% Separated3.5% Widowed17.4% DivorcedWomen who gave birth in the past 12 months Now married:
70.5% (1,236)Unmarried:
29.5% (518)
Women who did not give birth in the past 12 months Now married:
27.5% (3,598)Unmarried:
72.5% (9,469)
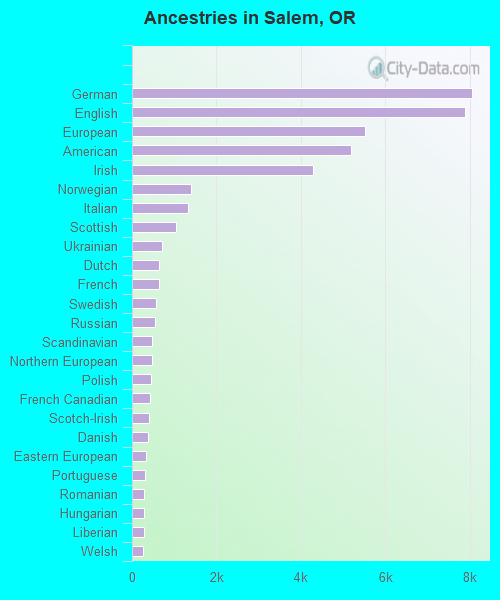
Ancestries in Salem
8,058 9.3% German7,894 9.1% English5,528 6.4% European5,196 6.0% American4,286 4.9% Irish1,405 1.6% Norwegian1,339 1.5% Italian1,032 1.2% Scottish707 0.8% Ukrainian645 0.7% Dutch644 0.7% French562 0.6% Swedish553 0.6% Russian471 0.5% Scandinavian467 0.5% Northern European454 0.5% Polish417 0.5% French Canadian401 0.5% Scotch-Irish391 0.5% Danish336 0.4% Eastern European303 0.3% Portuguese291 0.3% Romanian290 0.3% Hungarian289 0.3% Liberian260 0.3% Welsh216 0.2% Austrian195 0.2% British144 0.2% Czechoslovakian123 0.1% Czech119 0.1% African97 0.1% Ethiopian87 0.1% Palestinian86 0.10% Greek84 0.10% Swiss74 0.09% Lithuanian73 0.08% Finnish52 0.06% Australian50 0.06% Canadian41 0.05% Afghan39 0.04% Slavic38 0.04% Iranian37 0.04% Slovak36 0.04% Jordanian33 0.04% Ghanaian31 0.04% Croatian31 0.04% Jamaican27 0.03% Estonian27 0.03% Lebanese26 0.03% Celtic25 0.03% Nigerian25 0.03% Israeli23 0.03% Moroccan21 0.02% Yugoslavian21 0.02% Turkish18 0.02% Pennsylvania German17 0.02% Bulgarian17 0.02% Ugandan13 0.01% Egyptian11 0.01% Latvian8 0.01% South African7 0.01% Assyrian5 0.01% Basque5 0.01% Icelander
Geographical mobility in Salem Same house 1 year ago 94,031 84.1% White (Caucasian)2,737 83.5% Black or African American1,973 88.0% American Indian / Alaska Native5,224 88.5% Asian2,658 91.6% Native Hawaiian / Pacific Islander14,765 78.4% Other race25,743 85.2% Two or more races87,940 83.8% White alone, not Hispanic / Latino43,035 85.5% Hispanic or LatinoMoved within same county 6,903 6.2% White / Caucasian354 10.8% Black or African American59 2.6% American Indian / Alaska Native194 3.3% Asian3 0.1% Native Hawaiian / Pacific Islander2,630 14.0% Other race2,415 8.0% Two or more races6,700 6.4% White alone, not Hispanic / Latino4,302 8.5% Hispanic or LatinoMoved within same state 8,132 7.3% White / Caucasian171 5.2% Black or African American169 7.5% American Indian / Alaska Native298 5.0% Asian140 4.8% Native Hawaiian / Pacific Islander1,404 7.5% Other race1,544 5.1% Two or more races7,844 7.5% White alone, not Hispanic / Latino2,271 4.5% Hispanic or LatinoMoved from different state 2,478 2.2% White / Caucasian16 0.5% Black or African American89 4.0% American Indian / Alaska Native213 3.6% Asian102 3.5% Native Hawaiian / Pacific Islander32 0.2% Other race348 1.2% Two or more races2,175 2.1% White alone, not Hispanic / Latino552 1.1% Hispanic or LatinoMoved from abroad 266 0.2% White59 1.0% Asian162 0.5% Two or more races266 0.3% White alone, not Hispanic / Latino162 0.3% Hispanic or Latino
Children Nativity (place of birth) in Salem
Children under 6 years - Living with two parents Both parents native 3,686 100.0% NativeBoth parents foreign-born 1,550 96.7% Native53 3.3% Foreign-bornOne native, one foreign-born parent 1,593 100.0% NativeChildren under 6 years - Living with one parent Native parent 3,039 100.0% NativeForeign-born parent 745 93.4% Native53 6.6% Foreign-bornChildren 6 to 17 years - Living with two parents Both parents native 8,568 100.0% NativeBoth parents foreign-born 3,455 70.6% Native1,441 29.4% Foreign-bornOne native, one foreign-born parent 1,520 95.7% Native69 4.3% Foreign-bornChildren 6 to 17 years - Living with one parent Native parent 6,997 100.0% NativeForeign-born parent 3,374 53.0% Native2,997 47.0% Foreign-born
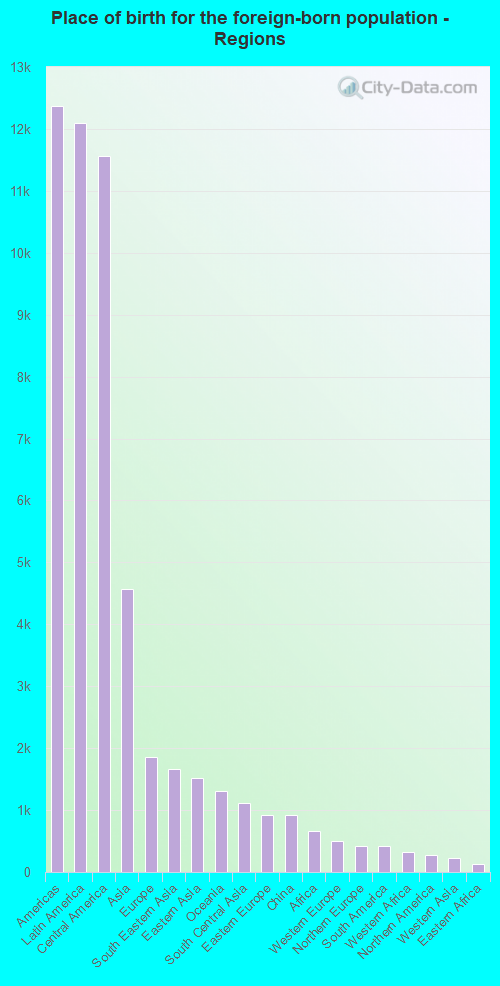
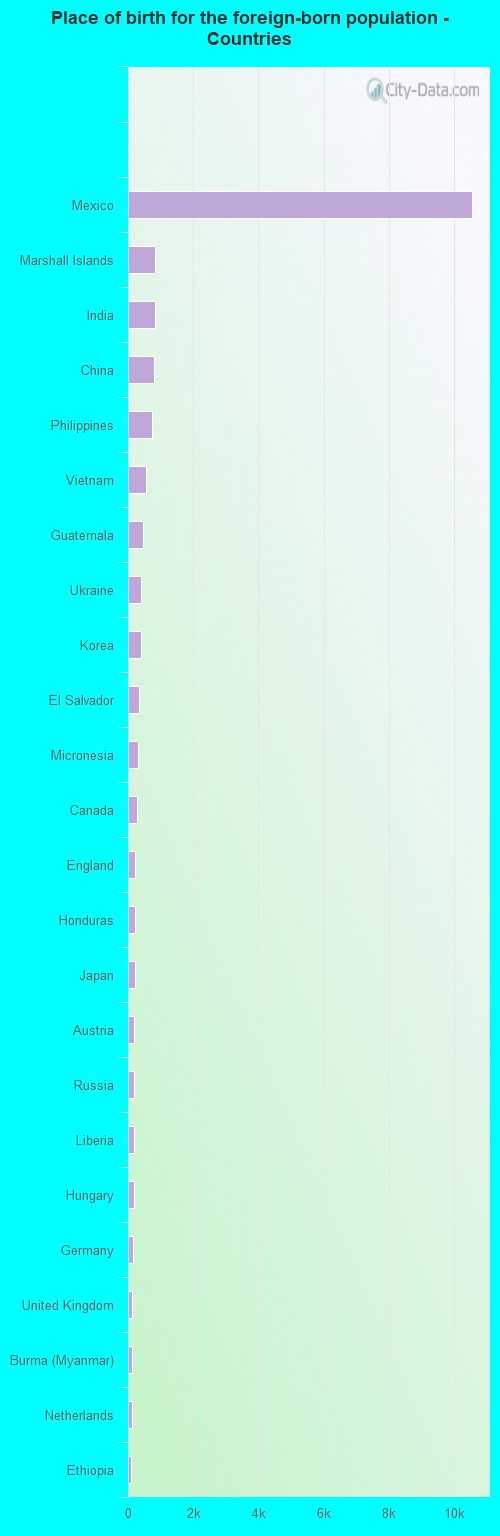
Place of birth for residents in Salem 12,375 Americas12,094 Latin America11,567 Central America4,566 Asia1,850 Europe1,666 South Eastern Asia1,513 Eastern Asia1,304 Oceania1,115 South Central Asia927 Eastern Europe914 China660 Africa497 Western Europe425 Northern Europe416 South America327 Western Africa281 Northern America226 Western Asia134 Eastern Africa110 Caribbean87 Middle Africa35 Australia and New Zealand Subregion33 Southern Africa12 Northern Africa10,539 Mexico825 Marshall Islands814 India785 China751 Philippines560 Vietnam455 Guatemala401 Ukraine395 Korea343 El Salvador301 Micronesia262 Canada226 England216 Honduras203 Japan183 Austria178 Russia172 Liberia170 Hungary165 Germany127 United Kingdom121 Burma (Myanmar)111 Netherlands101 Ethiopia92 Colombia87 Congo85 Cambodia84 Brazil83 Israel78 Nepal77 Taiwan69 Georgia66 Bolivia65 Uzbekistan64 Dominican Republic64 Ghana61 Thailand58 Laos57 Iran55 Turkey53 Nigeria53 Moldova51 Peru50 Hong Kong38 Afghanistan37 France36 Senegal36 Venezuela35 Australia33 South Africa33 Kazakhstan31 Jamaica31 Argentina29 Latvia24 Romania20 Czechoslovakia17 Uganda15 Tanzania15 Fiji14 Cuba14 Indonesia14 Malaysia13 Ecuador12 Morocco12 Nicaragua12 Belarus12 Uruguay12 Chile11 Sri Lanka9 Jordan8 Lebanon1 Sierra Leone1 Iraq
Grandparents responsible for own grandchildren in Salem
Grandparents (30 to 59 years) White / Caucasian 265 43.5% Responsible for grandchildren344 56.5% Not responsible for grandchildrenAmerican Indian / Alaska Native 8 100.0% Not responsible for grandchildrenAsian 11 100.0% Responsible for grandchildrenNative Hawaiian / Pacific Islander 36 100.0% Not responsible for grandchildrenOther race 115 37.9% Responsible for grandchildren189 62.1% Not responsible for grandchildrenTwo or more races 157 54.8% Responsible for grandchildren130 45.2% Not responsible for grandchildrenWhite alone, not Hispanic / Latino 265 43.5% Responsible for grandchildren344 56.5% Not responsible for grandchildrenHispanic or Latino 208 49.6% Responsible for grandchildren212 50.4% Not responsible for grandchildrenGrandparents (60 years and over) White / Caucasian 25 2.3% Responsible for grandchildren1,083 97.7% Not responsible for grandchildrenAmerican Indian / Alaska Native 16 41.3% Responsible for grandchildren22 58.7% Not responsible for grandchildrenAsian 120 100.0% Not responsible for grandchildrenNative Hawaiian / Pacific Islander 17 20.7% Responsible for grandchildren64 79.3% Not responsible for grandchildrenOther race 70 21.3% Responsible for grandchildren259 78.7% Not responsible for grandchildrenTwo or more races 35 8.7% Responsible for grandchildren370 91.3% Not responsible for grandchildrenWhite alone, not Hispanic / Latino 25 2.3% Responsible for grandchildren1,083 97.7% Not responsible for grandchildrenHispanic or Latino 36 6.0% Responsible for grandchildren568 94.0% Not responsible for grandchildren