Races in Salina, Kansas (KS) Detailed Stats
Data:
Races - White alone (%)
Races - White alone (% change since 2000)
Races - Black alone (%)
Races - Black alone (% change since 2000)
Races - American Indian alone (%)
Races - American Indian alone (% change since 2000)
Races - Asian alone (%)
Races - Asian alone (% change since 2000)
Races - Hispanic (%)
Races - Hispanic (% change since 2000)
Races - Native Hawaiian and Other Pacific Islander alone (%)
Races - Native Hawaiian and Other Pacific Islander alone (% change since 2000)
Races - Two or more races(%)
Races - Two or more races(% change since 2000)
Races - Other race alone (%)
Races - Other race alone (% change since 2000)
Racial diversity
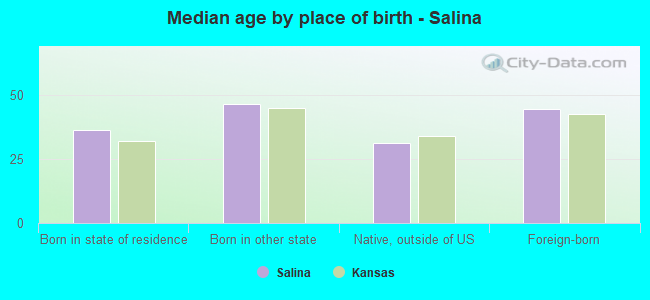
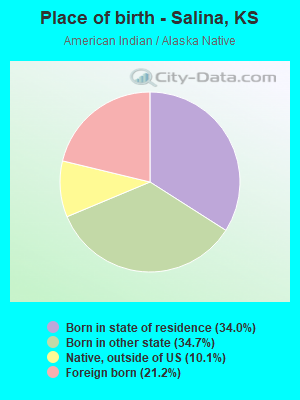
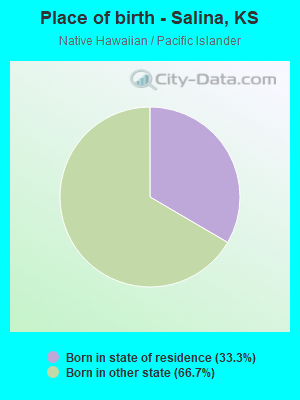
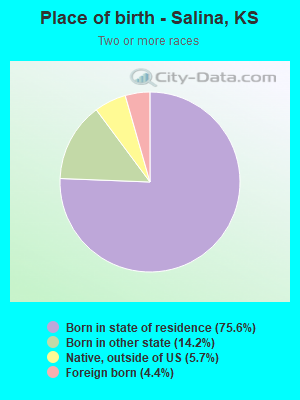
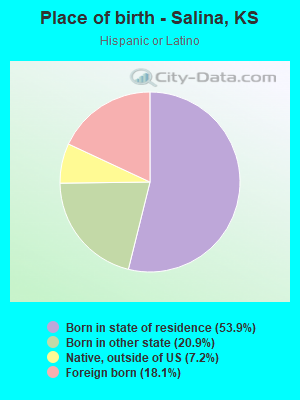
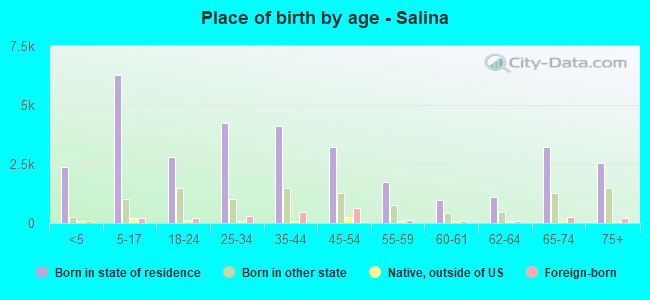
Place of birth - Born in state of residence (%)
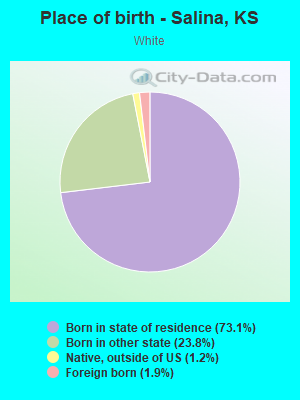
Place of birth - Born in state of residence (%) - White
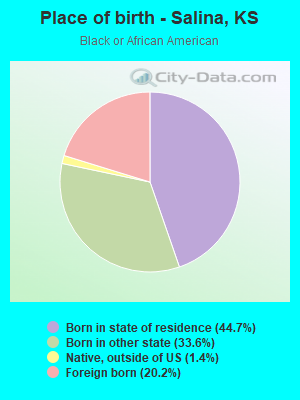
Place of birth - Born in state of residence (%) - Black or African American
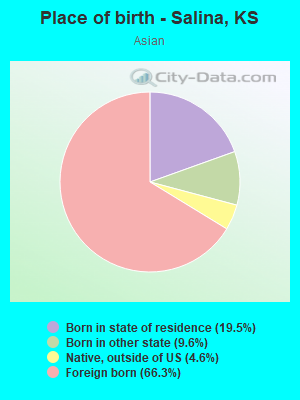
Place of birth - Born in state of residence (%) - Asian
Place of birth - Born in state of residence (%) - Hispanic or Latino
Place of birth - Born in state of residence (%) - American Indian and Alaska Native
Place of birth - Born in state of residence (%) - Multirace
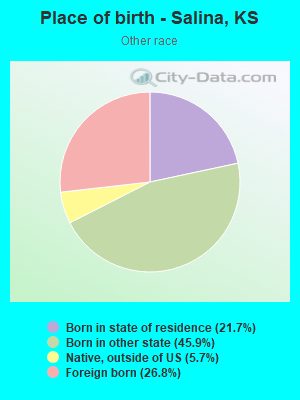
Place of birth - Born in state of residence (%) - Other Race
Place of birth - Born in other state (%)
Place of birth - Born in other state (%) - White
Place of birth - Born in other state (%) - Black or African American
Place of birth - Born in other state (%) - Asian
Place of birth - Born in other state (%) - Hispanic or Latino
Place of birth - Born in other state (%) - American Indian and Alaska Native
Place of birth - Born in other state (%) - Multirace
Place of birth - Born in other state (%) - Other Race
Place of birth - Native, outside of US (%)
Place of birth - Native, outside of US (%) - White
Place of birth - Native, outside of US (%) - Black or African American
Place of birth - Native, outside of US (%) - Asian
Place of birth - Native, outside of US (%) - Hispanic or Latino
Place of birth - Native, outside of US (%) - American Indian and Alaska Native
Place of birth - Native, outside of US (%) - Multirace
Place of birth - Native, outside of US (%) - Other Race
Place of birth - Foreign born (%)
Place of birth - Foreign born (%) - White
Place of birth - Foreign born (%) - Black or African American
Place of birth - Foreign born (%) - Asian
Place of birth - Foreign born (%) - Hispanic or Latino
Place of birth - Foreign born (%) - American Indian and Alaska Native
Place of birth - Foreign born (%) - Multirace
Place of birth - Foreign born (%) - Other Race
Residents speaking English at home (%)
Residents speaking English at home - Born in the United States (%)
Residents speaking English at home - Native, born elsewhere (%)
Residents speaking English at home - Foreign born (%)
Residents speaking Spanish at home (%)
Residents speaking Spanish at home - Born in the United States (%)
Residents speaking Spanish at home - Native, born elsewhere (%)
Residents speaking Spanish at home - Foreign born (%)
Residents speaking other language at home (%)
Residents speaking other language at home - Born in the United States (%)
Residents speaking other language at home - Native, born elsewhere (%)
Residents speaking other language at home - Foreign born (%)
Marital status - Never married (%)
Marital status - Now married (%)
Marital status - Separated (%)
Marital status - Widowed (%)
Marital status - Divorced (%)
Ancestries Reported - Arab (%)
Ancestries Reported - Czech (%)
Ancestries Reported - Danish (%)
Ancestries Reported - Dutch (%)
Ancestries Reported - English (%)
Ancestries Reported - French (%)
Ancestries Reported - French Canadian (%)
Ancestries Reported - German (%)
Ancestries Reported - Greek (%)
Ancestries Reported - Hungarian (%)
Ancestries Reported - Irish (%)
Ancestries Reported - Italian (%)
Ancestries Reported - Lithuanian (%)
Ancestries Reported - Norwegian (%)
Ancestries Reported - Polish (%)
Ancestries Reported - Portuguese (%)
Ancestries Reported - Russian (%)
Ancestries Reported - Scotch-Irish (%)
Ancestries Reported - Scottish (%)
Ancestries Reported - Slovak (%)
Ancestries Reported - Subsaharan African (%)
Ancestries Reported - Swedish (%)
Ancestries Reported - Swiss (%)
Ancestries Reported - Ukrainian (%)
Ancestries Reported - United States (%)
Ancestries Reported - Welsh (%)
Ancestries Reported - West Indian (%)
Ancestries Reported - Other (%)
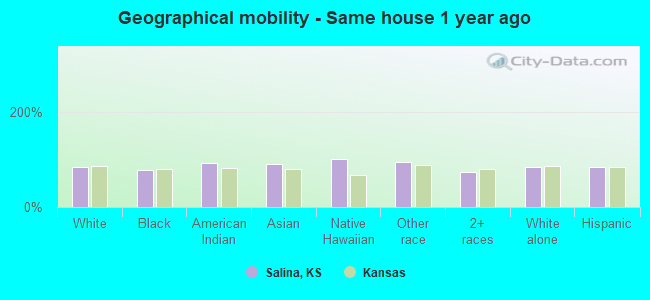
Geographical mobility - Same house 1 year ago (%)
Geographical mobility - Same house 1 year ago (%) - White
Geographical mobility - Same house 1 year ago (%) - Black or African American
Geographical mobility - Same house 1 year ago (%) - Asian
Geographical mobility - Same house 1 year ago (%) - Hispanic or Latino
Geographical mobility - Same house 1 year ago (%) - American Indian and Alaska Native
Geographical mobility - Same house 1 year ago (%) - Multirace
Geographical mobility - Same house 1 year ago (%) - Other Race
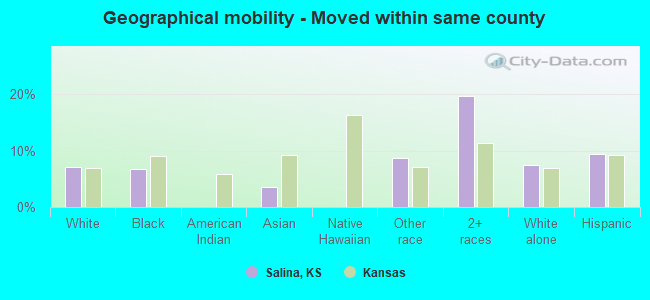
Geographical mobility - Moved within same county (%)
Geographical mobility - Moved within same county (%) - White
Geographical mobility - Moved within same county (%) - Black or African American
Geographical mobility - Moved within same county (%) - Asian
Geographical mobility - Moved within same county (%) - Hispanic or Latino
Geographical mobility - Moved within same county (%) - American Indian and Alaska Native
Geographical mobility - Moved within same county (%) - Multirace
Geographical mobility - Moved within same county (%) - Other Race
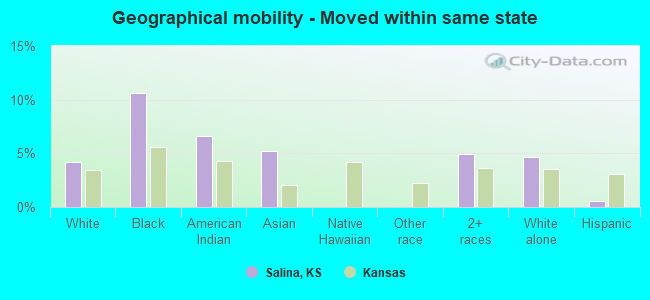
Geographical mobility - Moved from different county within same state (%)
Geographical mobility - Moved from different county within same state (%) - White
Geographical mobility - Moved from different county within same state (%) - Black or African American
Geographical mobility - Moved from different county within same state (%) - Asian
Geographical mobility - Moved from different county within same state (%) - Hispanic or Latino
Geographical mobility - Moved from different county within same state (%) - American Indian and Alaska Native
Geographical mobility - Moved from different county within same state (%) - Multirace
Geographical mobility - Moved from different county within same state (%) - Other Race
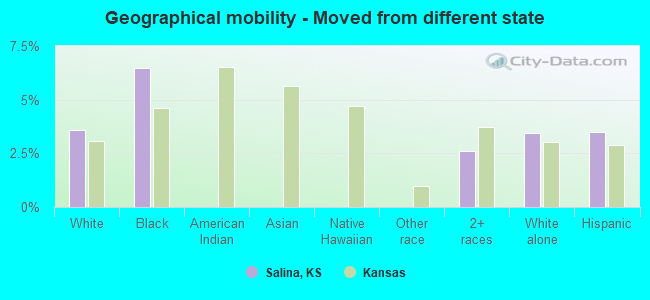
Geographical mobility - Moved from different state (%)
Geographical mobility - Moved from different state (%) - White
Geographical mobility - Moved from different state (%) - Black or African American
Geographical mobility - Moved from different state (%) - Asian
Geographical mobility - Moved from different state (%) - Hispanic or Latino
Geographical mobility - Moved from different state (%) - American Indian and Alaska Native
Geographical mobility - Moved from different state (%) - Multirace
Geographical mobility - Moved from different state (%) - Other Race
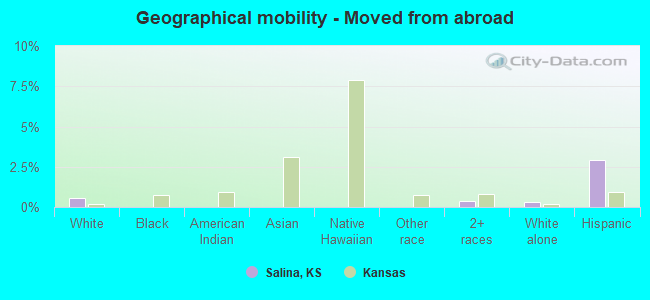
Geographical mobility - Moved from abroad (%)
Geographical mobility - Moved from abroad (%) - White
Geographical mobility - Moved from abroad (%) - Black or African American
Geographical mobility - Moved from abroad (%) - Asian
Geographical mobility - Moved from abroad (%) - Hispanic or Latino
Geographical mobility - Moved from abroad (%) - American Indian and Alaska Native
Geographical mobility - Moved from abroad (%) - Multirace
Geographical mobility - Moved from abroad (%) - Other Race
Place of birth for the foreign-born population - Ireland (%)
Place of birth for the foreign-born population - Denmark (%)
Place of birth for the foreign-born population - Norway (%)
Place of birth for the foreign-born population - Sweden (%)
Place of birth for the foreign-born population - United Kingdom (%)
Place of birth for the foreign-born population - England (%)
Place of birth for the foreign-born population - Scotland (%)
Place of birth for the foreign-born population - Other Northern Europe (%)
Place of birth for the foreign-born population - Austria (%)
Place of birth for the foreign-born population - Belgium (%)
Place of birth for the foreign-born population - France (%)
Place of birth for the foreign-born population - Germany (%)
Place of birth for the foreign-born population - Netherlands (%)
Place of birth for the foreign-born population - Switzerland (%)
Place of birth for the foreign-born population - Other Western Europe (%)
Place of birth for the foreign-born population - Greece (%)
Place of birth for the foreign-born population - Italy (%)
Place of birth for the foreign-born population - Portugal (%)
Place of birth for the foreign-born population - Spain (%)
Place of birth for the foreign-born population - Other Southern Europe (%)
Place of birth for the foreign-born population - Albania (%)
Place of birth for the foreign-born population - Belarus (%)
Place of birth for the foreign-born population - Bosnia and Herzegovina (%)
Place of birth for the foreign-born population - Bulgaria (%)
Place of birth for the foreign-born population - Croatia (%)
Place of birth for the foreign-born population - Czechoslovakia (%)
Place of birth for the foreign-born population - Hungary (%)
Place of birth for the foreign-born population - Latvia (%)
Place of birth for the foreign-born population - Lithuania (%)
Place of birth for the foreign-born population - North Macedonia (Macedonia) (%)
Place of birth for the foreign-born population - Moldova (%)
Place of birth for the foreign-born population - Poland (%)
Place of birth for the foreign-born population - Romania (%)
Place of birth for the foreign-born population - Russia (%)
Place of birth for the foreign-born population - Serbia (%)
Place of birth for the foreign-born population - Ukraine (%)
Place of birth for the foreign-born population - Other Eastern Europe (%)
Place of birth for the foreign-born population - China (%)
Place of birth for the foreign-born population - Hong Kong (%)
Place of birth for the foreign-born population - Taiwan (%)
Place of birth for the foreign-born population - Japan (%)
Place of birth for the foreign-born population - Korea (%)
Place of birth for the foreign-born population - Other Eastern Asia (%)
Place of birth for the foreign-born population - Afghanistan (%)
Place of birth for the foreign-born population - Bangladesh (%)
Place of birth for the foreign-born population - India (%)
Place of birth for the foreign-born population - Iran (%)
Place of birth for the foreign-born population - Kazakhstan (%)
Place of birth for the foreign-born population - Nepal (%)
Place of birth for the foreign-born population - Pakistan (%)
Place of birth for the foreign-born population - Sri Lanka (%)
Place of birth for the foreign-born population - Uzbekistan (%)
Place of birth for the foreign-born population - Other South Central Asia (%)
Place of birth for the foreign-born population - Burma (%)
Place of birth for the foreign-born population - Cambodia (%)
Place of birth for the foreign-born population - Indonesia (%)
Place of birth for the foreign-born population - Laos (%)
Place of birth for the foreign-born population - Malaysia (%)
Place of birth for the foreign-born population - Philippines (%)
Place of birth for the foreign-born population - Singapore (%)
Place of birth for the foreign-born population - Thailand (%)
Place of birth for the foreign-born population - Vietnam (%)
Place of birth for the foreign-born population - Other South Eastern Asia (%)
Place of birth for the foreign-born population - Armenia (%)
Place of birth for the foreign-born population - Iraq (%)
Place of birth for the foreign-born population - Israel (%)
Place of birth for the foreign-born population - Jordan (%)
Place of birth for the foreign-born population - Kuwait (%)
Place of birth for the foreign-born population - Lebanon (%)
Place of birth for the foreign-born population - Saudi Arabia (%)
Place of birth for the foreign-born population - Syria (%)
Place of birth for the foreign-born population - Turkey (%)
Place of birth for the foreign-born population - Yemen (%)
Place of birth for the foreign-born population - Other Western Asia (%)
Place of birth for the foreign-born population - Eritrea (%)
Place of birth for the foreign-born population - Ethiopia (%)
Place of birth for the foreign-born population - Kenya (%)
Place of birth for the foreign-born population - Somalia (%)
Place of birth for the foreign-born population - Uganda (%)
Place of birth for the foreign-born population - Zimbabwe (%)
Place of birth for the foreign-born population - Other Eastern Africa (%)
Place of birth for the foreign-born population - Cameroon (%)
Place of birth for the foreign-born population - Congo (%)
Place of birth for the foreign-born population - Democratic Republic of Congo (Zaire) (%)
Place of birth for the foreign-born population - Other Middle Africa (%)
Place of birth for the foreign-born population - Egypt (%)
Place of birth for the foreign-born population - Morocco (%)
Place of birth for the foreign-born population - Sudan (%)
Place of birth for the foreign-born population - Other Northern Africa (%)
Place of birth for the foreign-born population - South Africa (%)
Place of birth for the foreign-born population - Other Southern Africa (%)
Place of birth for the foreign-born population - Cabo Verde (%)
Place of birth for the foreign-born population - Ghana (%)
Place of birth for the foreign-born population - Liberia (%)
Place of birth for the foreign-born population - Nigeria (%)
Place of birth for the foreign-born population - Senegal (%)
Place of birth for the foreign-born population - Sierra Leone (%)
Place of birth for the foreign-born population - Other Western Africa (%)
Place of birth for the foreign-born population - Australia (%)
Place of birth for the foreign-born population - New Zealand (%)
Place of birth for the foreign-born population - Fiji (%)
Place of birth for the foreign-born population - Micronesia (%)
Place of birth for the foreign-born population - Bahamas (%)
Place of birth for the foreign-born population - Barbados (%)
Place of birth for the foreign-born population - Cuba (%)
Place of birth for the foreign-born population - Dominica (%)
Place of birth for the foreign-born population - Dominican Republic (%)
Place of birth for the foreign-born population - Grenada (%)
Place of birth for the foreign-born population - Haiti (%)
Place of birth for the foreign-born population - Jamaica (%)
Place of birth for the foreign-born population - St. Vincent and the Grenadines (%)
Place of birth for the foreign-born population - Trinidad and Tobago (%)
Place of birth for the foreign-born population - West Indies (%)
Place of birth for the foreign-born population - Other Caribbean (%)
Place of birth for the foreign-born population - Belize (%)
Place of birth for the foreign-born population - Costa Rica (%)
Place of birth for the foreign-born population - El Salvador (%)
Place of birth for the foreign-born population - Guatemala (%)
Place of birth for the foreign-born population - Honduras (%)
Place of birth for the foreign-born population - Mexico (%)
Place of birth for the foreign-born population - Nicaragua (%)
Place of birth for the foreign-born population - Panama (%)
Place of birth for the foreign-born population - Other Central America (%)
Place of birth for the foreign-born population - Argentina (%)
Place of birth for the foreign-born population - Bolivia (%)
Place of birth for the foreign-born population - Brazil (%)
Place of birth for the foreign-born population - Chile (%)
Place of birth for the foreign-born population - Colombia (%)
Place of birth for the foreign-born population - Ecuador (%)
Place of birth for the foreign-born population - Guyana (%)
Place of birth for the foreign-born population - Peru (%)
Place of birth for the foreign-born population - Uruguay (%)
Place of birth for the foreign-born population - Venezuela (%)
Place of birth for the foreign-born population - Other South America (%)
Place of birth for the foreign-born population - Canada (%)
Place of birth for the foreign-born population - Other Northern America (%)
Place of birth for the foreign-born population - Other (%)
Latest news about races in Salina, KS collected exclusively by city-data.com from local newspapers, TV, and radio stations
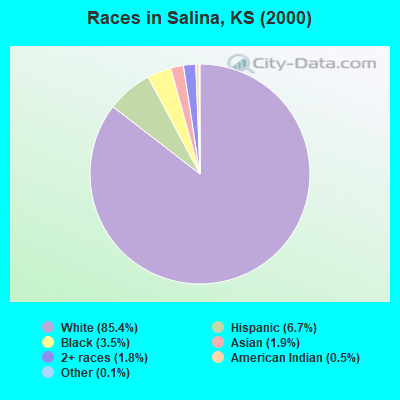
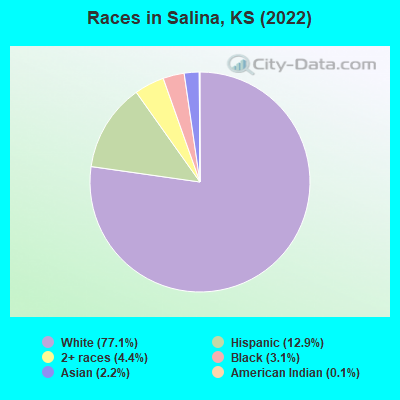
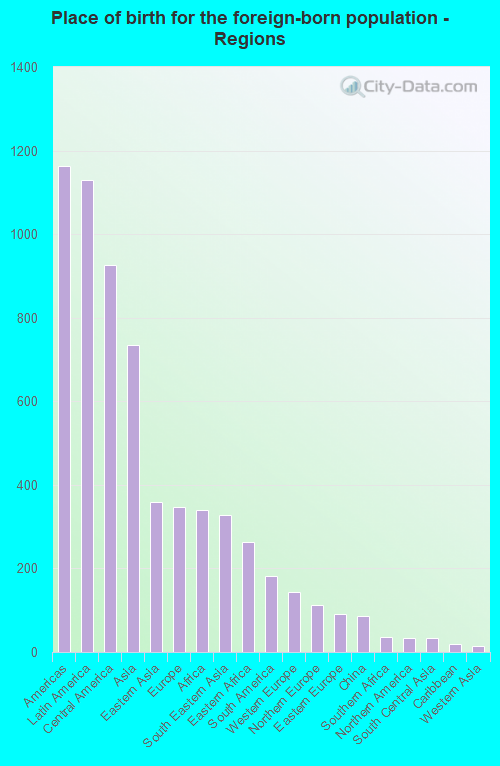
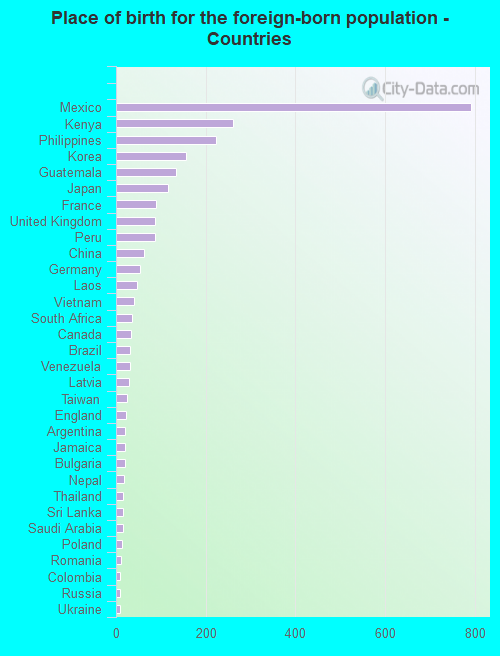
According to 2022 data, the most numerous races in Salina, KS are White alone (36,034 residents), Hispanic (6,019 residents), and Black alone (1,450 residents). 90.9% of Salina residents speak English at home. 5.5% of Salina, KS residents are foreign-born (2.4% born in Latin America, 1.5% born in Asia, 0.7% born in Europe, 0.7% born in Africa), which is 26.5% less than the foreign-born rate of 7.0% across the entire state of Kansas.
Race distribution in Salina
2000 2022
2,233,997 83.1% White alone 188,252 7.0% Hispanic 151,407 5.6% Black alone 46,301 1.7% Asian alone 42,508 1.6% Two or more races 22,322 0.8% American Indian alone 2,477 0.09% Other race alone 1,154 0.04% Native Hawaiian and Other
2,147,943 73.1% White alone 381,746 13.0% Hispanic 147,666 5.0% Black alone 145,362 4.9% Two or more races 85,085 2.9% Asian alone 13,263 0.5% Other race alone 12,065 0.4% American Indian alone 4,020 0.1% Native Hawaiian and Other
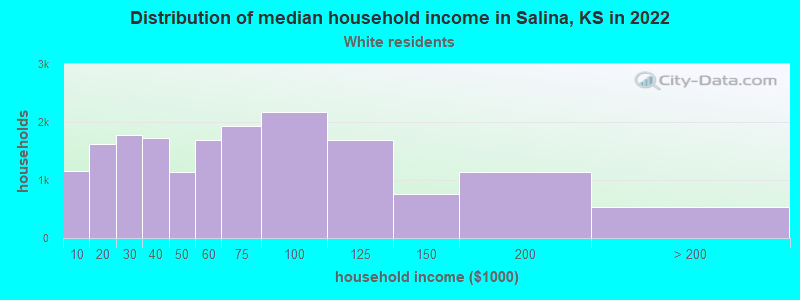
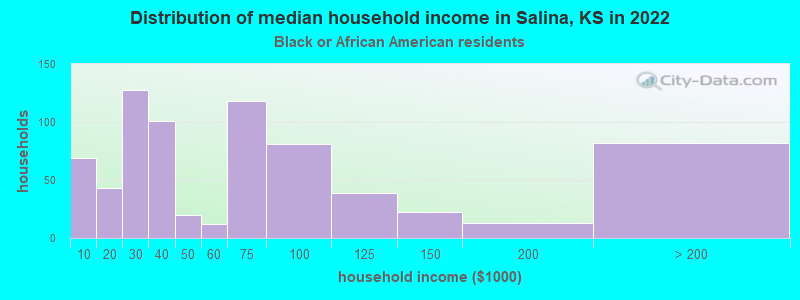
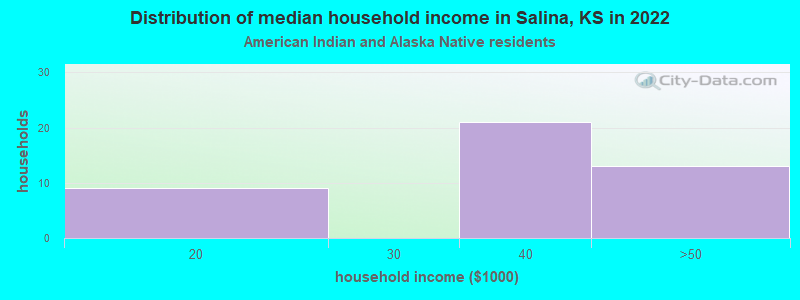
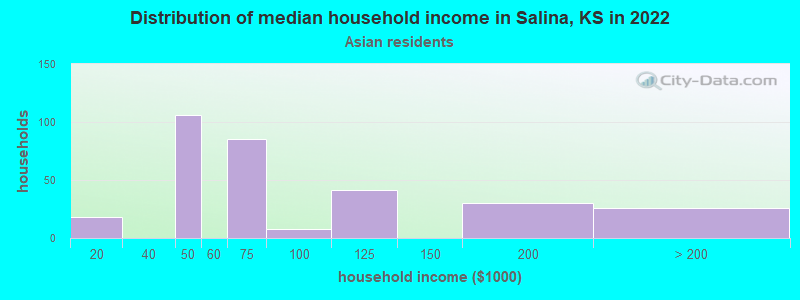
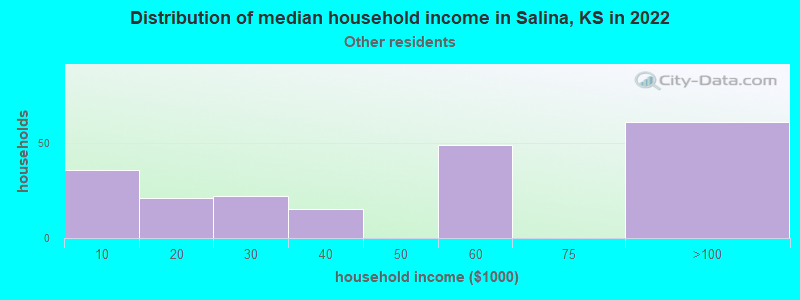
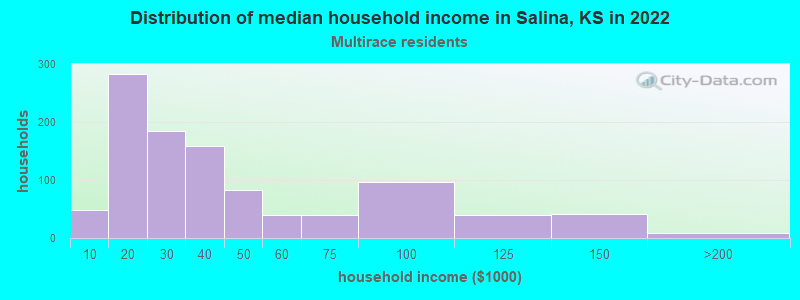
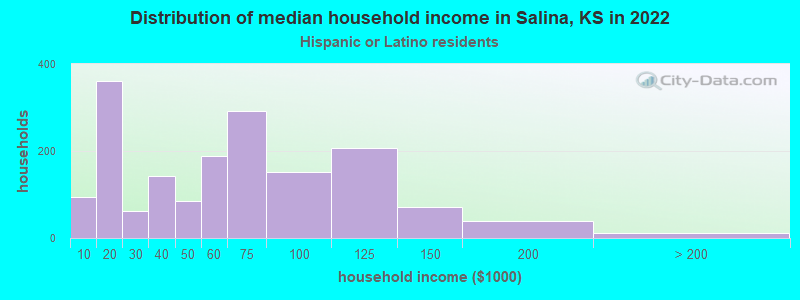
Income and house value in Salina Median household income in 2022 $56,281 White non-Hispanic householders$50,819 Black householders$37,980 American Indian and Alaska Native householders$64,096 Asian householders$52,924 Some other race householders$30,394 Two or more races householders$55,702 Hispanic or Latino race householdersMedian 2022 house value $177,862 White Non-Hispanic householders$142,331 Black or African American householders$164,276 American Indian or Alaska Native householders $195,418 Asian householders$235,129 Native Hawaiian and other Pacific Islander householders$117,251 Some other race householders$119,968 Two or more races householders$135,852 Hispanic or Latino householders
Median age by race in Salina
41.1 Median age for White residents39.1 43.4 42.3 Median age for Black or African American residents38.6 47.8 56.4 Median age for American Indian / Alaska Native residents59.2 50.6 46.2 Median age for Asian residents39.9 52.6 -627,039,626.4 Median age for Native Hawaiian / Pacific Islander residents-669,240,668.6 -641,269,840.6 35.1 Median age for Other race residents51.6 21.4 20.5 Median age for Two or more races residents19.4 21.0 43.5 Median age for White alone residents40.5 45.5 22.1 Median age for Hispanic or Latino residents22.7 22.2
Owner/renter occupied households by race in Salina
House owners and renters - White residents 11,702 68.0% Owner occupied5,508 32.0% Renter occupiedHouse owners and renters - Black or African American residents 358 50.8% Owner occupied346 49.2% Renter occupiedHouse owners and renters - American Indian / Alaska Native residents 15 28.9% Owner occupied38 71.1% Renter occupiedHouse owners and renters - Asian residents 197 57.5% Owner occupied146 42.5% Renter occupiedHouse owners and renters - Other race residents 152 69.6% Owner occupied66 30.4% Renter occupiedHouse owners and renters - Two or more races residents 294 26.9% Owner occupied797 73.1% Renter occupiedHouse owners and renters - White alone residents 11,224 67.8% Owner occupied5,327 32.2% Renter occupiedHouse owners and renters - Hispanic or Latino residents 867 52.8% Owner occupied774 47.2% Renter occupied
Language usage in Salina
English speakers - Total 90.9% of residents of Salina speak English at home.
5.9% of residents speak Spanish at home 1,884 72.6% Speak English very well710 27.4% Speak English less than very well3.2% of residents speak other language at home 1,075 75.7% Speak English very well345 24.3% Speak English less than very well
English speakers - Born in the United States 92.9% of residents of Salina speak English at home.
6.3% of residents speak Spanish at home 545 81.1% Speak English very well127 18.9% Speak English less than very well0.8% of residents speak other language at home 56 64.4% Speak English very well31 35.6% Speak English less than very well
English speakers - Native, born elsewhere 78.6% of residents of Salina speak English at home.
15.9% of residents speak Spanish at home 91 69.5% Speak English very well40 30.5% Speak English less than very well5.9% of residents speak other language at home 49 100.0% Speak English very well
English speakers - Foreign-born 20.8% of residents of Salina speak English at home.
37.2% of residents speak Spanish at home 663 71.4% Speak English very well266 28.6% Speak English less than very well43.1% of residents speak other language at home 804 74.7% Speak English very well272 25.3% Speak English less than very well
White (Caucasian) - Speak only English Native:
97.4% (35,098)Foreign-born:
34.9% (249)
White (Caucasian) - Speak another language Native:
2.5% (886)Foreign-born:
66.5% (475)
Black or African American - Speak only English Native:
92.0% (1,070)Foreign-born:
7.2% (22)
Black or African American - Speak another language Native:
8.6% (100)Foreign-born:
91.7% (287)
American Indian / Alaska Native - Speak only English Native:
67.5% (83)Foreign-born:
64.2% (22)
Asian - Speak only English Native:
22.9% (83)Foreign-born:
13.6% (87)
Asian - Speak another language Native:
67.4% (246)Foreign-born:
86.4% (553)
Other race - Speak only English Native:
48.2% (231)Foreign-born:
15.2% (27)
Other race - Speak another language Native:
51.5% (247)Foreign-born:
87.0% (154)
Two or more races - Speak only English Native:
93.3% (2,918)Foreign-born:
57.6% (98)
Two or more races - Speak another language Native:
2.8% (88)Foreign-born:
35.1% (60)
White alone - Speak only English Native:
99.5% (33,752)Foreign-born:
43.5% (174)
White alone - Speak another language Native:
0.6% (218)Foreign-born:
56.3% (226)
Hispanic or Latino - Speak only English Native:
64.8% (2,773)Foreign-born:
19.5% (212)
Hispanic or Latino - Speak another language Native:
35.3% (1,510)Foreign-born:
83.1% (905)
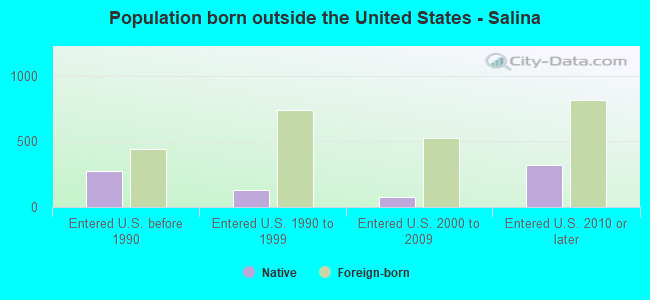
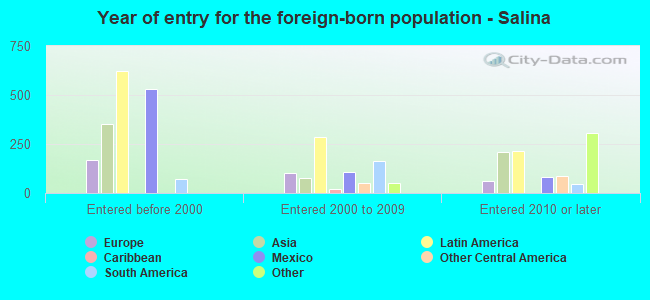
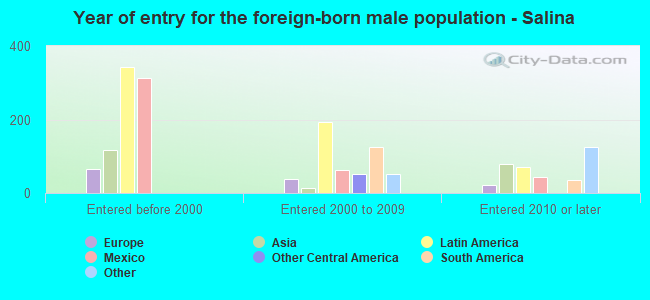
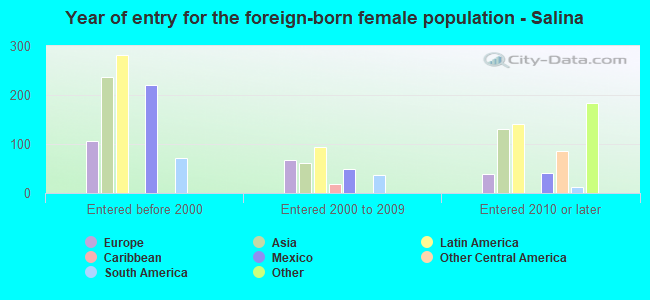
Foreign-born residents in Salina 2,587 residents are foreign born (2.4% Latin America , 1.5% Asia , 0.7% Europe , 0.7% Africa ).
This city:
5.5%Kansas:
7.1%
Marital status for residents in Salina Marital status - White (Caucasian) population 15 years and over
Males 31.5% Never married49.6% Now married1.0% Separated2.8% Widowed15.1% DivorcedFemales 24.7% Never married47.8% Now married2.2% Separated10.6% Widowed14.6% DivorcedWomen who gave birth in the past 12 months Now married:
64.0% (378)Unmarried:
36.0% (213)
Women who did not give birth in the past 12 months Now married:
45.6% (3,582)Unmarried:
54.4% (4,276)
Marital status - Black or African American population 15 years and over
Males 53.9% Never married36.4% Now married3.0% Separated0.0% Widowed6.7% DivorcedFemales 18.1% Never married37.3% Now married32.4% Separated2.0% Widowed10.2% DivorcedWomen who did not give birth in the past 12 months Now married:
70.4% (146)Unmarried:
29.6% (61)
Marital status - American Indian / Alaska Native population 15 years and over
Males 50.0% Never married0.0% Now married0.0% Separated0.0% Widowed50.0% DivorcedFemales 33.3% Never married0.0% Now married0.0% Separated0.0% Widowed66.7% DivorcedWomen who did not give birth in the past 12 months Now married:
0.0% (0)Unmarried:
100.0% (7)
Marital status - Asian population 15 years and over
Males 51.0% Never married45.0% Now married0.0% Separated0.0% Widowed4.0% DivorcedFemales 20.4% Never married50.8% Now married0.0% Separated18.7% Widowed10.1% DivorcedWomen who did not give birth in the past 12 months Now married:
36.8% (93)Unmarried:
63.2% (160)
Marital status - Other race population 15 years and over
Males 6.4% Never married54.5% Now married0.0% Separated0.0% Widowed39.0% DivorcedFemales 38.7% Never married61.3% Now married0.0% Separated0.0% Widowed0.0% DivorcedWomen who gave birth in the past 12 months Now married:
100.0% (29)Unmarried:
0.0% (0)
Women who did not give birth in the past 12 months Now married:
42.4% (91)Unmarried:
57.6% (124)
Marital status - Two or more races population 15 years and over
Males 61.0% Never married32.6% Now married1.8% Separated0.0% Widowed4.5% DivorcedFemales 54.1% Never married17.3% Now married17.6% Separated6.0% Widowed5.0% DivorcedWomen who gave birth in the past 12 months Now married:
0.0% (0)Unmarried:
100.0% (90)
Women who did not give birth in the past 12 months Now married:
18.4% (123)Unmarried:
81.6% (545)
Marital status - White alone, not Hispanic / Latino population 15 years and over
Males 30.5% Never married50.4% Now married0.5% Separated3.1% Widowed15.5% DivorcedFemales 23.0% Never married48.3% Now married2.4% Separated11.1% Widowed15.2% DivorcedWomen who gave birth in the past 12 months Now married:
70.3% (354)Unmarried:
29.7% (149)
Women who did not give birth in the past 12 months Now married:
45.8% (3,223)Unmarried:
54.2% (3,809)
Marital status - Hispanic or Latino population 15 years and over
Males 39.3% Never married44.0% Now married4.2% Separated0.0% Widowed12.6% DivorcedFemales 45.7% Never married37.7% Now married7.2% Separated3.2% Widowed6.2% DivorcedWomen who gave birth in the past 12 months Now married:
37.7% (64)Unmarried:
62.3% (106)
Women who did not give birth in the past 12 months Now married:
39.5% (629)Unmarried:
60.5% (965)
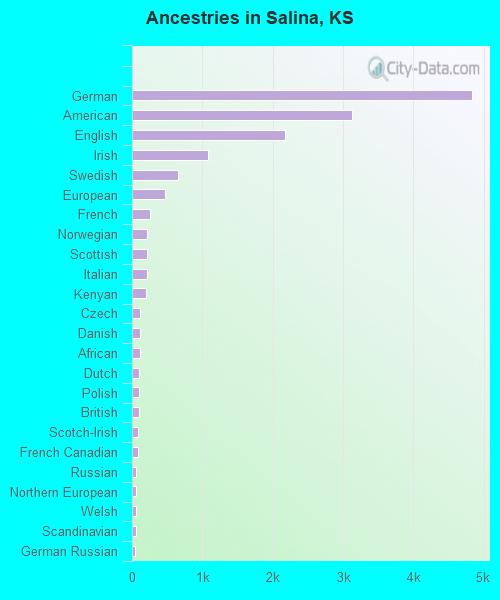
Ancestries in Salina
4,832 23.9% German3,131 15.5% American2,181 10.8% English1,081 5.3% Irish658 3.3% Swedish468 2.3% European257 1.3% French219 1.1% Norwegian212 1.0% Scottish210 1.0% Italian202 1.0% Kenyan113 0.6% Czech109 0.5% Danish107 0.5% African97 0.5% Dutch97 0.5% Polish97 0.5% British91 0.5% Scotch-Irish90 0.4% French Canadian63 0.3% Russian59 0.3% Northern European56 0.3% Welsh50 0.2% Scandinavian49 0.2% German Russian40 0.2% South African36 0.2% Pennsylvania German34 0.2% Jamaican29 0.1% Swiss28 0.1% Ukrainian25 0.1% Austrian25 0.1% Slovak21 0.1% Iranian18 0.09% Bulgarian18 0.09% Czechoslovakian17 0.08% Brazilian17 0.08% Turkish16 0.08% Canadian11 0.05% Ethiopian10 0.05% Armenian9 0.04% Australian9 0.04% Greek6 0.03% Eastern European5 0.02% Romanian
Geographical mobility in Salina Same house 1 year ago 32,376 84.4% White (Caucasian)1,193 77.7% Black or African American146 92.9% American Indian / Alaska Native943 90.2% Asian17 100.0% Native Hawaiian / Pacific Islander619 94.9% Other race2,817 72.5% Two or more races29,978 84.1% White alone, not Hispanic / Latino4,995 84.0% Hispanic or LatinoMoved within same county 2,706 7.1% White / Caucasian102 6.7% Black or African American38 3.6% Asian57 8.7% Other race764 19.7% Two or more races2,638 7.4% White alone, not Hispanic / Latino558 9.4% Hispanic or LatinoMoved within same state 1,610 4.2% White / Caucasian164 10.7% Black or African American10 6.6% American Indian / Alaska Native55 5.2% Asian190 4.9% Two or more races1,677 4.7% White alone, not Hispanic / Latino35 0.6% Hispanic or LatinoMoved from different state 1,380 3.6% White / Caucasian100 6.5% Black or African American101 2.6% Two or more races1,225 3.4% White alone, not Hispanic / Latino207 3.5% Hispanic or LatinoMoved from abroad 204 0.5% White14 0.4% Two or more races114 0.3% White alone, not Hispanic / Latino172 2.9% Hispanic or Latino
Children Nativity (place of birth) in Salina
Children under 6 years - Living with two parents Both parents native 1,766 100.0% Native0 0.0% Foreign-bornBoth parents foreign-born 13 20.1% Native51 79.9% Foreign-bornOne native, one foreign-born parent 194 100.0% NativeChildren under 6 years - Living with one parent Native parent 1,006 100.0% NativeForeign-born parent 37 100.0% NativeChildren 6 to 17 years - Living with two parents Both parents native 3,601 99.7% Native9 0.3% Foreign-bornBoth parents foreign-born 384 74.8% Native129 25.2% Foreign-bornOne native, one foreign-born parent 175 72.8% Native65 27.2% Foreign-bornChildren 6 to 17 years - Living with one parent Native parent 2,398 100.0% NativeForeign-born parent 285 50.2% Native283 49.8% Foreign-born
Grandparents responsible for own grandchildren in Salina
Grandparents (30 to 59 years) White / Caucasian 89 31.8% Responsible for grandchildren191 68.2% Not responsible for grandchildrenBlack or African American 16 70.6% Responsible for grandchildren7 29.4% Not responsible for grandchildrenWhite alone, not Hispanic / Latino 62 25.6% Responsible for grandchildren181 74.4% Not responsible for grandchildrenHispanic or Latino 32 51.0% Responsible for grandchildren31 49.0% Not responsible for grandchildrenGrandparents (60 years and over) White / Caucasian 49 14.7% Responsible for grandchildren287 85.3% Not responsible for grandchildrenWhite alone, not Hispanic / Latino 51 19.6% Responsible for grandchildren208 80.4% Not responsible for grandchildrenHispanic or Latino 90 100.0% Not responsible for grandchildren