Races in San Juan, Texas (TX) Detailed Stats
Data:
Races - White alone (%)
Races - White alone (% change since 2000)
Races - Black alone (%)
Races - Black alone (% change since 2000)
Races - American Indian alone (%)
Races - American Indian alone (% change since 2000)
Races - Asian alone (%)
Races - Asian alone (% change since 2000)
Races - Hispanic (%)
Races - Hispanic (% change since 2000)
Races - Native Hawaiian and Other Pacific Islander alone (%)
Races - Native Hawaiian and Other Pacific Islander alone (% change since 2000)
Races - Two or more races(%)
Races - Two or more races(% change since 2000)
Races - Other race alone (%)
Races - Other race alone (% change since 2000)
Racial diversity
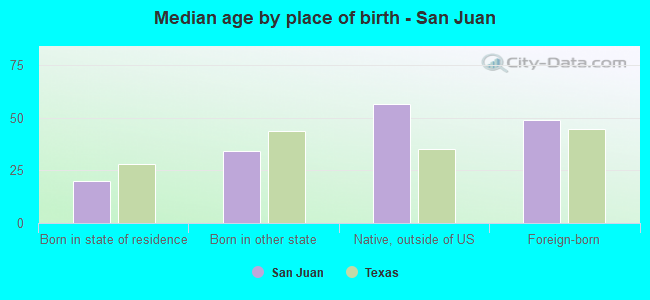
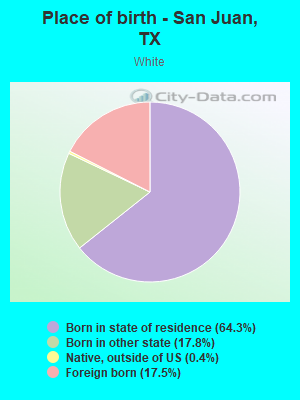
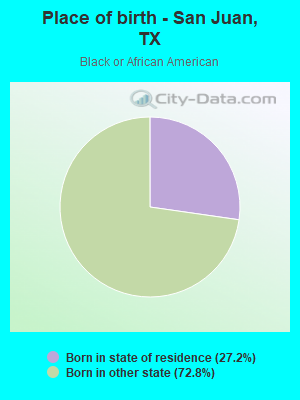
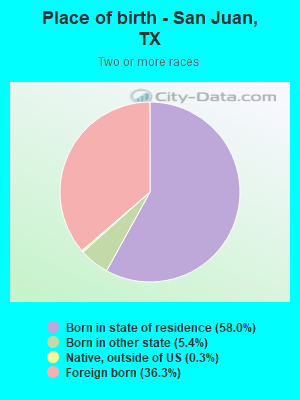
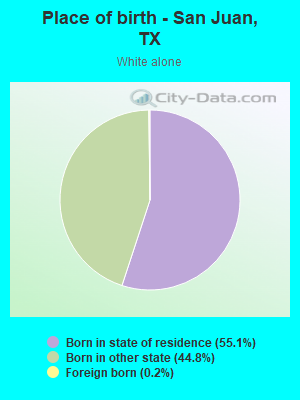
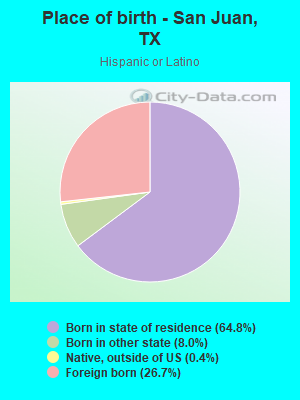
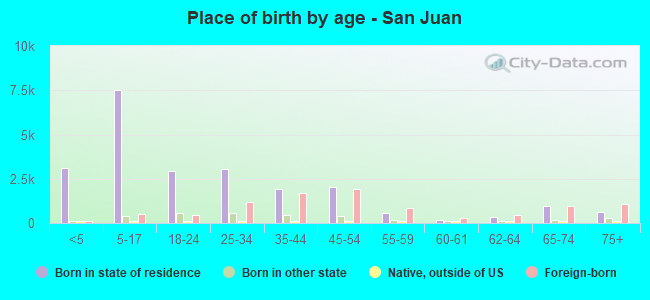
Place of birth - Born in state of residence (%)
Place of birth - Born in state of residence (%) - White
Place of birth - Born in state of residence (%) - Black or African American
Place of birth - Born in state of residence (%) - Asian
Place of birth - Born in state of residence (%) - Hispanic or Latino
Place of birth - Born in state of residence (%) - American Indian and Alaska Native
Place of birth - Born in state of residence (%) - Multirace
Place of birth - Born in state of residence (%) - Other Race
Place of birth - Born in other state (%)
Place of birth - Born in other state (%) - White
Place of birth - Born in other state (%) - Black or African American
Place of birth - Born in other state (%) - Asian
Place of birth - Born in other state (%) - Hispanic or Latino
Place of birth - Born in other state (%) - American Indian and Alaska Native
Place of birth - Born in other state (%) - Multirace
Place of birth - Born in other state (%) - Other Race
Place of birth - Native, outside of US (%)
Place of birth - Native, outside of US (%) - White
Place of birth - Native, outside of US (%) - Black or African American
Place of birth - Native, outside of US (%) - Asian
Place of birth - Native, outside of US (%) - Hispanic or Latino
Place of birth - Native, outside of US (%) - American Indian and Alaska Native
Place of birth - Native, outside of US (%) - Multirace
Place of birth - Native, outside of US (%) - Other Race
Place of birth - Foreign born (%)
Place of birth - Foreign born (%) - White
Place of birth - Foreign born (%) - Black or African American
Place of birth - Foreign born (%) - Asian
Place of birth - Foreign born (%) - Hispanic or Latino
Place of birth - Foreign born (%) - American Indian and Alaska Native
Place of birth - Foreign born (%) - Multirace
Place of birth - Foreign born (%) - Other Race
Residents speaking English at home (%)
Residents speaking English at home - Born in the United States (%)
Residents speaking English at home - Native, born elsewhere (%)
Residents speaking English at home - Foreign born (%)
Residents speaking Spanish at home (%)
Residents speaking Spanish at home - Born in the United States (%)
Residents speaking Spanish at home - Native, born elsewhere (%)
Residents speaking Spanish at home - Foreign born (%)
Residents speaking other language at home (%)
Residents speaking other language at home - Born in the United States (%)
Residents speaking other language at home - Native, born elsewhere (%)
Residents speaking other language at home - Foreign born (%)
Marital status - Never married (%)
Marital status - Now married (%)
Marital status - Separated (%)
Marital status - Widowed (%)
Marital status - Divorced (%)
Ancestries Reported - Arab (%)
Ancestries Reported - Czech (%)
Ancestries Reported - Danish (%)
Ancestries Reported - Dutch (%)
Ancestries Reported - English (%)
Ancestries Reported - French (%)
Ancestries Reported - French Canadian (%)
Ancestries Reported - German (%)
Ancestries Reported - Greek (%)
Ancestries Reported - Hungarian (%)
Ancestries Reported - Irish (%)
Ancestries Reported - Italian (%)
Ancestries Reported - Lithuanian (%)
Ancestries Reported - Norwegian (%)
Ancestries Reported - Polish (%)
Ancestries Reported - Portuguese (%)
Ancestries Reported - Russian (%)
Ancestries Reported - Scotch-Irish (%)
Ancestries Reported - Scottish (%)
Ancestries Reported - Slovak (%)
Ancestries Reported - Subsaharan African (%)
Ancestries Reported - Swedish (%)
Ancestries Reported - Swiss (%)
Ancestries Reported - Ukrainian (%)
Ancestries Reported - United States (%)
Ancestries Reported - Welsh (%)
Ancestries Reported - West Indian (%)
Ancestries Reported - Other (%)
Geographical mobility - Same house 1 year ago (%)
Geographical mobility - Same house 1 year ago (%) - White
Geographical mobility - Same house 1 year ago (%) - Black or African American
Geographical mobility - Same house 1 year ago (%) - Asian
Geographical mobility - Same house 1 year ago (%) - Hispanic or Latino
Geographical mobility - Same house 1 year ago (%) - American Indian and Alaska Native
Geographical mobility - Same house 1 year ago (%) - Multirace
Geographical mobility - Same house 1 year ago (%) - Other Race
Geographical mobility - Moved within same county (%)
Geographical mobility - Moved within same county (%) - White
Geographical mobility - Moved within same county (%) - Black or African American
Geographical mobility - Moved within same county (%) - Asian
Geographical mobility - Moved within same county (%) - Hispanic or Latino
Geographical mobility - Moved within same county (%) - American Indian and Alaska Native
Geographical mobility - Moved within same county (%) - Multirace
Geographical mobility - Moved within same county (%) - Other Race
Geographical mobility - Moved from different county within same state (%)
Geographical mobility - Moved from different county within same state (%) - White
Geographical mobility - Moved from different county within same state (%) - Black or African American
Geographical mobility - Moved from different county within same state (%) - Asian
Geographical mobility - Moved from different county within same state (%) - Hispanic or Latino
Geographical mobility - Moved from different county within same state (%) - American Indian and Alaska Native
Geographical mobility - Moved from different county within same state (%) - Multirace
Geographical mobility - Moved from different county within same state (%) - Other Race
Geographical mobility - Moved from different state (%)
Geographical mobility - Moved from different state (%) - White
Geographical mobility - Moved from different state (%) - Black or African American
Geographical mobility - Moved from different state (%) - Asian
Geographical mobility - Moved from different state (%) - Hispanic or Latino
Geographical mobility - Moved from different state (%) - American Indian and Alaska Native
Geographical mobility - Moved from different state (%) - Multirace
Geographical mobility - Moved from different state (%) - Other Race
Geographical mobility - Moved from abroad (%)
Geographical mobility - Moved from abroad (%) - White
Geographical mobility - Moved from abroad (%) - Black or African American
Geographical mobility - Moved from abroad (%) - Asian
Geographical mobility - Moved from abroad (%) - Hispanic or Latino
Geographical mobility - Moved from abroad (%) - American Indian and Alaska Native
Geographical mobility - Moved from abroad (%) - Multirace
Geographical mobility - Moved from abroad (%) - Other Race
Place of birth for the foreign-born population - Ireland (%)
Place of birth for the foreign-born population - Denmark (%)
Place of birth for the foreign-born population - Norway (%)
Place of birth for the foreign-born population - Sweden (%)
Place of birth for the foreign-born population - United Kingdom (%)
Place of birth for the foreign-born population - England (%)
Place of birth for the foreign-born population - Scotland (%)
Place of birth for the foreign-born population - Other Northern Europe (%)
Place of birth for the foreign-born population - Austria (%)
Place of birth for the foreign-born population - Belgium (%)
Place of birth for the foreign-born population - France (%)
Place of birth for the foreign-born population - Germany (%)
Place of birth for the foreign-born population - Netherlands (%)
Place of birth for the foreign-born population - Switzerland (%)
Place of birth for the foreign-born population - Other Western Europe (%)
Place of birth for the foreign-born population - Greece (%)
Place of birth for the foreign-born population - Italy (%)
Place of birth for the foreign-born population - Portugal (%)
Place of birth for the foreign-born population - Spain (%)
Place of birth for the foreign-born population - Other Southern Europe (%)
Place of birth for the foreign-born population - Albania (%)
Place of birth for the foreign-born population - Belarus (%)
Place of birth for the foreign-born population - Bosnia and Herzegovina (%)
Place of birth for the foreign-born population - Bulgaria (%)
Place of birth for the foreign-born population - Croatia (%)
Place of birth for the foreign-born population - Czechoslovakia (%)
Place of birth for the foreign-born population - Hungary (%)
Place of birth for the foreign-born population - Latvia (%)
Place of birth for the foreign-born population - Lithuania (%)
Place of birth for the foreign-born population - North Macedonia (Macedonia) (%)
Place of birth for the foreign-born population - Moldova (%)
Place of birth for the foreign-born population - Poland (%)
Place of birth for the foreign-born population - Romania (%)
Place of birth for the foreign-born population - Russia (%)
Place of birth for the foreign-born population - Serbia (%)
Place of birth for the foreign-born population - Ukraine (%)
Place of birth for the foreign-born population - Other Eastern Europe (%)
Place of birth for the foreign-born population - China (%)
Place of birth for the foreign-born population - Hong Kong (%)
Place of birth for the foreign-born population - Taiwan (%)
Place of birth for the foreign-born population - Japan (%)
Place of birth for the foreign-born population - Korea (%)
Place of birth for the foreign-born population - Other Eastern Asia (%)
Place of birth for the foreign-born population - Afghanistan (%)
Place of birth for the foreign-born population - Bangladesh (%)
Place of birth for the foreign-born population - India (%)
Place of birth for the foreign-born population - Iran (%)
Place of birth for the foreign-born population - Kazakhstan (%)
Place of birth for the foreign-born population - Nepal (%)
Place of birth for the foreign-born population - Pakistan (%)
Place of birth for the foreign-born population - Sri Lanka (%)
Place of birth for the foreign-born population - Uzbekistan (%)
Place of birth for the foreign-born population - Other South Central Asia (%)
Place of birth for the foreign-born population - Burma (%)
Place of birth for the foreign-born population - Cambodia (%)
Place of birth for the foreign-born population - Indonesia (%)
Place of birth for the foreign-born population - Laos (%)
Place of birth for the foreign-born population - Malaysia (%)
Place of birth for the foreign-born population - Philippines (%)
Place of birth for the foreign-born population - Singapore (%)
Place of birth for the foreign-born population - Thailand (%)
Place of birth for the foreign-born population - Vietnam (%)
Place of birth for the foreign-born population - Other South Eastern Asia (%)
Place of birth for the foreign-born population - Armenia (%)
Place of birth for the foreign-born population - Iraq (%)
Place of birth for the foreign-born population - Israel (%)
Place of birth for the foreign-born population - Jordan (%)
Place of birth for the foreign-born population - Kuwait (%)
Place of birth for the foreign-born population - Lebanon (%)
Place of birth for the foreign-born population - Saudi Arabia (%)
Place of birth for the foreign-born population - Syria (%)
Place of birth for the foreign-born population - Turkey (%)
Place of birth for the foreign-born population - Yemen (%)
Place of birth for the foreign-born population - Other Western Asia (%)
Place of birth for the foreign-born population - Eritrea (%)
Place of birth for the foreign-born population - Ethiopia (%)
Place of birth for the foreign-born population - Kenya (%)
Place of birth for the foreign-born population - Somalia (%)
Place of birth for the foreign-born population - Uganda (%)
Place of birth for the foreign-born population - Zimbabwe (%)
Place of birth for the foreign-born population - Other Eastern Africa (%)
Place of birth for the foreign-born population - Cameroon (%)
Place of birth for the foreign-born population - Congo (%)
Place of birth for the foreign-born population - Democratic Republic of Congo (Zaire) (%)
Place of birth for the foreign-born population - Other Middle Africa (%)
Place of birth for the foreign-born population - Egypt (%)
Place of birth for the foreign-born population - Morocco (%)
Place of birth for the foreign-born population - Sudan (%)
Place of birth for the foreign-born population - Other Northern Africa (%)
Place of birth for the foreign-born population - South Africa (%)
Place of birth for the foreign-born population - Other Southern Africa (%)
Place of birth for the foreign-born population - Cabo Verde (%)
Place of birth for the foreign-born population - Ghana (%)
Place of birth for the foreign-born population - Liberia (%)
Place of birth for the foreign-born population - Nigeria (%)
Place of birth for the foreign-born population - Senegal (%)
Place of birth for the foreign-born population - Sierra Leone (%)
Place of birth for the foreign-born population - Other Western Africa (%)
Place of birth for the foreign-born population - Australia (%)
Place of birth for the foreign-born population - New Zealand (%)
Place of birth for the foreign-born population - Fiji (%)
Place of birth for the foreign-born population - Micronesia (%)
Place of birth for the foreign-born population - Bahamas (%)
Place of birth for the foreign-born population - Barbados (%)
Place of birth for the foreign-born population - Cuba (%)
Place of birth for the foreign-born population - Dominica (%)
Place of birth for the foreign-born population - Dominican Republic (%)
Place of birth for the foreign-born population - Grenada (%)
Place of birth for the foreign-born population - Haiti (%)
Place of birth for the foreign-born population - Jamaica (%)
Place of birth for the foreign-born population - St. Vincent and the Grenadines (%)
Place of birth for the foreign-born population - Trinidad and Tobago (%)
Place of birth for the foreign-born population - West Indies (%)
Place of birth for the foreign-born population - Other Caribbean (%)
Place of birth for the foreign-born population - Belize (%)
Place of birth for the foreign-born population - Costa Rica (%)
Place of birth for the foreign-born population - El Salvador (%)
Place of birth for the foreign-born population - Guatemala (%)
Place of birth for the foreign-born population - Honduras (%)
Place of birth for the foreign-born population - Mexico (%)
Place of birth for the foreign-born population - Nicaragua (%)
Place of birth for the foreign-born population - Panama (%)
Place of birth for the foreign-born population - Other Central America (%)
Place of birth for the foreign-born population - Argentina (%)
Place of birth for the foreign-born population - Bolivia (%)
Place of birth for the foreign-born population - Brazil (%)
Place of birth for the foreign-born population - Chile (%)
Place of birth for the foreign-born population - Colombia (%)
Place of birth for the foreign-born population - Ecuador (%)
Place of birth for the foreign-born population - Guyana (%)
Place of birth for the foreign-born population - Peru (%)
Place of birth for the foreign-born population - Uruguay (%)
Place of birth for the foreign-born population - Venezuela (%)
Place of birth for the foreign-born population - Other South America (%)
Place of birth for the foreign-born population - Canada (%)
Place of birth for the foreign-born population - Other Northern America (%)
Place of birth for the foreign-born population - Other (%)
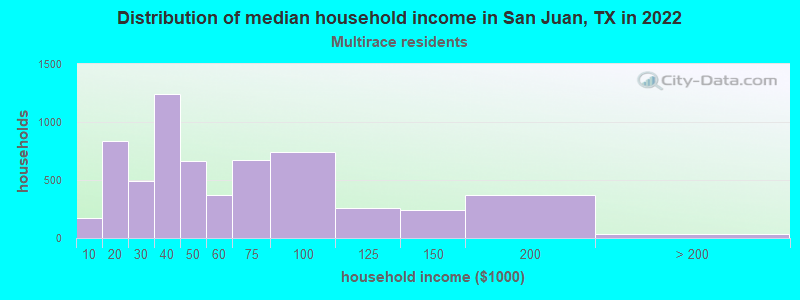
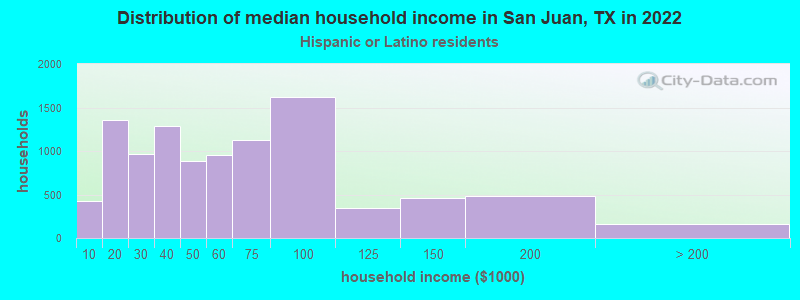
According to 2022 data, the most numerous races in San Juan, TX are Hispanic (34,881 residents), White alone (1,044 residents), and Black alone (5 residents). 18.5% of San Juan residents speak English at home. 26.4% of San Juan, TX residents are foreign-born (25.8% born in Latin America), which is 35.5% greater than the foreign-born rate of 17.0% across the entire state of Texas.
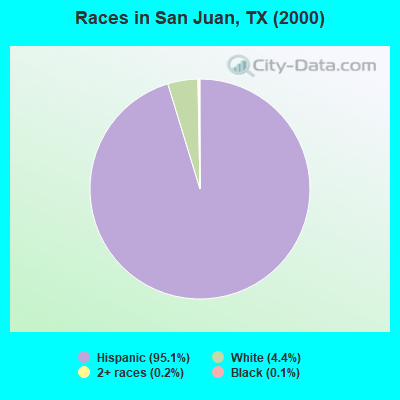
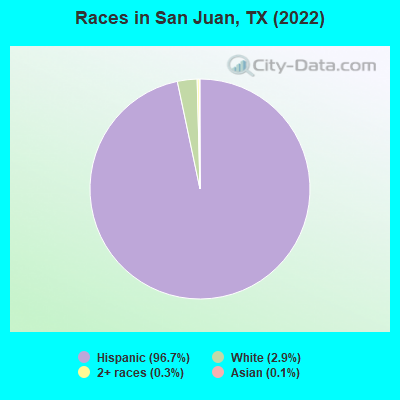
Race distribution in San Juan
2000 2022
10,933,313 52.4% White alone 6,669,666 32.0% Hispanic 2,364,255 11.3% Black alone 554,445 2.7% Asian alone 230,567 1.1% Two or more races 68,859 0.3% American Indian alone 19,958 0.10% Other race alone 10,757 0.05% Native Hawaiian and Other
12,070,642 40.2% Hispanic 11,683,430 38.9% White alone 3,508,706 11.7% Black alone 1,608,173 5.4% Asian alone 956,560 3.2% Two or more races 125,763 0.4% Other race alone 47,023 0.2% American Indian alone 29,275 0.10% Native Hawaiian and Other
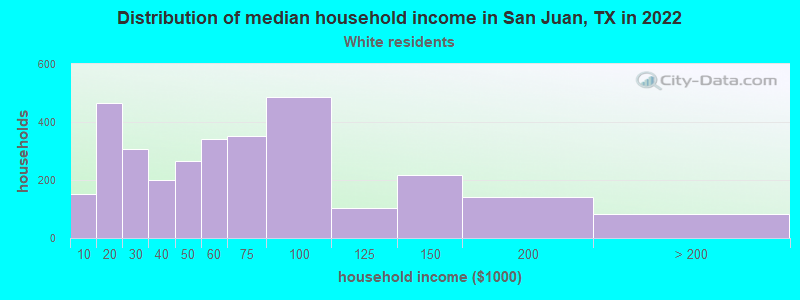
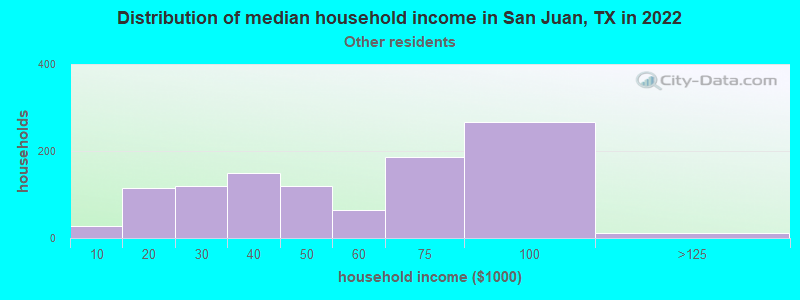
Income and house value in San Juan Median household income in 2022 $56,732 White non-Hispanic householders$54,239 Some other race householders$45,712 Two or more races householders$50,740 Hispanic or Latino race householdersMedian 2022 house value $174,401 White Non-Hispanic householders$159,072 Black or African American householders$120,605 American Indian or Alaska Native householders$115,110 Some other race householders$163,410 Two or more races householders$137,380 Hispanic or Latino householders
Median age by race in San Juan
27.7 Median age for White residents25.2 31.2 -636,150,234.1 Median age for Black or African American residents-682,648,401.1 -489,388,264.2 -560,747,663.0 Median age for American Indian / Alaska Native residents-575,645,755.9 -627,650,550.7 49.8 Median age for Asian residents-602,763,384.5 -710,659,897.8 -581,560,283.1 Median age for Native Hawaiian / Pacific Islander residents-612,729,233.5 -577,777,777.2 36.8 Median age for Other race residents36.1 36.8 33.7 Median age for Two or more races residents31.4 36.5 62.3 Median age for White alone residents65.3 58.1 29.8 Median age for Hispanic or Latino residents27.8 31.8
Owner/renter occupied households by race in San Juan
House owners and renters - White residents 2,249 78.2% Owner occupied627 21.8% Renter occupiedHouse owners and renters - Black or African American residents 19 100.0% Owner occupiedHouse owners and renters - American Indian / Alaska Native residents 12 100.0% Owner occupiedHouse owners and renters - Asian residents 10 100.0% Owner occupiedHouse owners and renters - Native Hawaiian / Pacific Islander residents 21 100.0% Renter occupiedHouse owners and renters - Other race residents 848 81.5% Owner occupied193 18.5% Renter occupiedHouse owners and renters - Two or more races residents 4,652 75.4% Owner occupied1,516 24.6% Renter occupiedHouse owners and renters - White alone residents 340 95.6% Owner occupied16 4.4% Renter occupiedHouse owners and renters - Hispanic or Latino residents 7,686 77.0% Owner occupied2,296 23.0% Renter occupied
Language usage in San Juan
English speakers - Total 18.5% of residents of San Juan speak English at home.
81.3% of residents speak Spanish at home 16,421 61.5% Speak English very well10,275 38.5% Speak English less than very well0.2% of residents speak other language at home 23 44.2% Speak English very well29 55.8% Speak English less than very well
English speakers - Born in the United States 31.6% of residents of San Juan speak English at home.
68.3% of residents speak Spanish at home 2,034 91.2% Speak English very well197 8.8% Speak English less than very well
English speakers - Native, born elsewhere 25.0% of residents of San Juan speak English at home.
63.6% of residents speak Spanish at home 45 50.6% Speak English very well44 49.4% Speak English less than very well
English speakers - Foreign-born 6.3% of residents of San Juan speak English at home.
93.1% of residents speak Spanish at home 2,228 25.5% Speak English very well6,513 74.5% Speak English less than very well0.4% of residents speak other language at home 14 35.0% Speak English very well26 65.0% Speak English less than very well
White (Caucasian) - Speak only English Native:
44.6% (3,571)Foreign-born:
11.0% (207)
White (Caucasian) - Speak another language Native:
56.7% (4,537)Foreign-born:
79.8% (1,508)
Other race - Speak only English Native:
17.7% (350)Foreign-born:
2.4% (20)
Other race - Speak another language Native:
81.5% (1,612)Foreign-born:
97.5% (819)
Two or more races - Speak only English Native:
9.0% (1,043)Foreign-born:
2.8% (214)
Two or more races - Speak another language Native:
91.7% (10,583)Foreign-born:
97.0% (7,321)
White alone - Speak only English Native:
67.0% (687)Foreign-born:
28.5% (1)
White alone - Speak another language Native:
32.7% (335)Foreign-born:
69.4% (1)
Hispanic or Latino - Speak only English Native:
20.9% (4,662)Foreign-born:
6.5% (608)
Hispanic or Latino - Speak another language Native:
79.1% (17,676)Foreign-born:
93.7% (8,745)
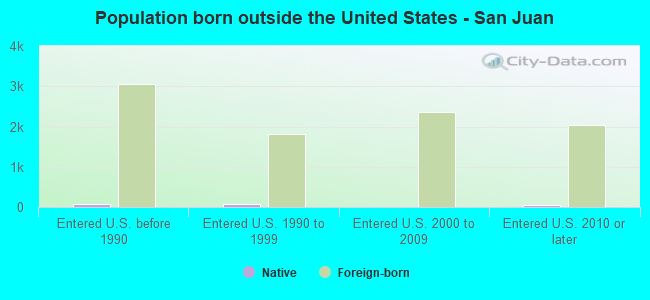
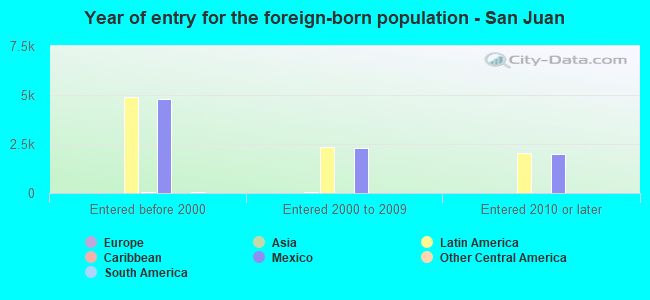
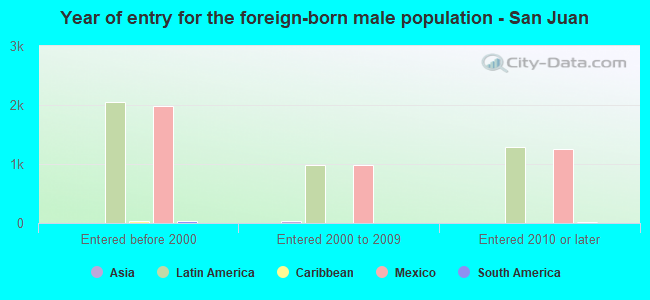
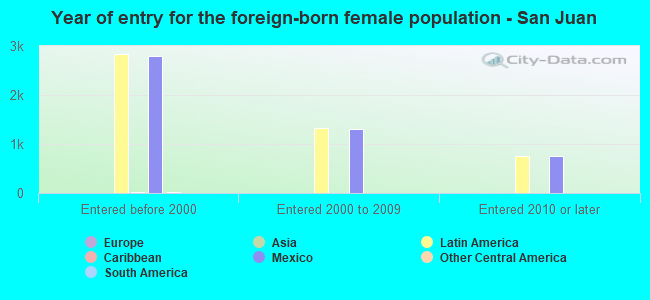
Foreign-born residents in San Juan 9,512 residents are foreign born (25.8% Latin America ).
This city:
26.4%Texas:
17.1%
Marital status for residents in San Juan Marital status - White (Caucasian) population 15 years and over
Males 39.2% Never married50.0% Now married2.3% Separated2.5% Widowed6.0% DivorcedFemales 34.6% Never married41.7% Now married5.2% Separated6.8% Widowed11.6% DivorcedWomen who gave birth in the past 12 months Now married:
42.2% (15)Unmarried:
57.8% (21)
Women who did not give birth in the past 12 months Now married:
43.0% (948)Unmarried:
57.0% (1,258)
Marital status - American Indian / Alaska Native population 15 years and over
Males 100.0% Never married0.0% Now married0.0% Separated0.0% Widowed0.0% DivorcedFemales 0.0% Never married100.0% Now married0.0% Separated0.0% Widowed0.0% DivorcedMarital status - Asian population 15 years and over
Males 56.0% Never married44.0% Now married0.0% Separated0.0% Widowed0.0% DivorcedFemales 50.0% Never married50.0% Now married0.0% Separated0.0% Widowed0.0% DivorcedWomen who did not give birth in the past 12 months Now married:
100.0% (9)Unmarried:
0.0% (0)
Marital status - Other race population 15 years and over
Males 33.0% Never married48.1% Now married4.4% Separated4.4% Widowed10.1% DivorcedFemales 23.3% Never married61.0% Now married2.2% Separated3.7% Widowed9.8% DivorcedWomen who gave birth in the past 12 months Now married:
54.3% (44)Unmarried:
45.7% (37)
Women who did not give birth in the past 12 months Now married:
46.9% (224)Unmarried:
53.1% (253)
Marital status - Two or more races population 15 years and over
Males 36.6% Never married57.3% Now married1.2% Separated2.2% Widowed2.7% DivorcedFemales 30.3% Never married53.0% Now married5.3% Separated3.9% Widowed7.6% DivorcedWomen who gave birth in the past 12 months Now married:
66.3% (312)Unmarried:
33.7% (159)
Women who did not give birth in the past 12 months Now married:
51.6% (2,121)Unmarried:
48.4% (1,993)
Marital status - White alone, not Hispanic / Latino population 15 years and over
Males 4.4% Never married67.6% Now married0.0% Separated2.2% Widowed25.8% DivorcedFemales 27.7% Never married51.2% Now married2.7% Separated13.7% Widowed4.7% DivorcedWomen who did not give birth in the past 12 months Now married:
1.9% (3)Unmarried:
98.1% (163)
Marital status - Hispanic or Latino population 15 years and over
Males 38.3% Never married52.0% Now married2.2% Separated2.7% Widowed4.7% DivorcedFemales 32.3% Never married47.3% Now married5.0% Separated5.2% Widowed10.1% DivorcedWomen who gave birth in the past 12 months Now married:
59.1% (261)Unmarried:
40.9% (180)
Women who did not give birth in the past 12 months Now married:
46.6% (3,643)Unmarried:
53.4% (4,172)
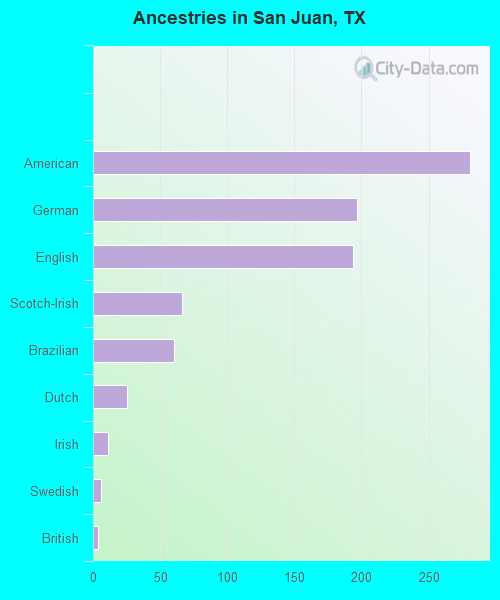
Ancestries in San Juan
281 0.9% American197 0.6% German194 0.6% English66 0.2% Scotch-Irish60 0.2% Brazilian25 0.08% Dutch11 0.04% Irish6 0.02% Swedish4 0.01% British
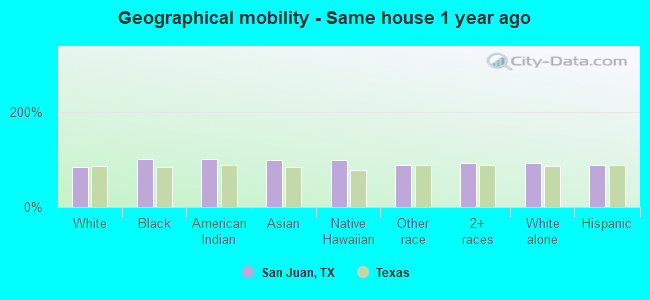
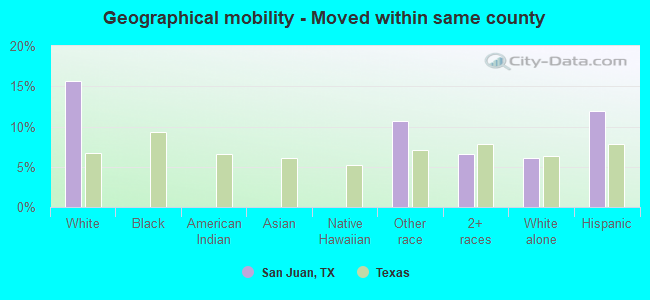
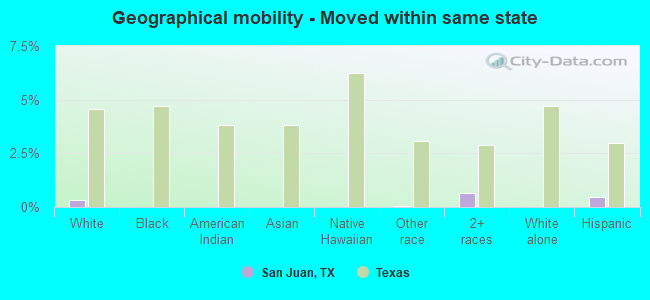
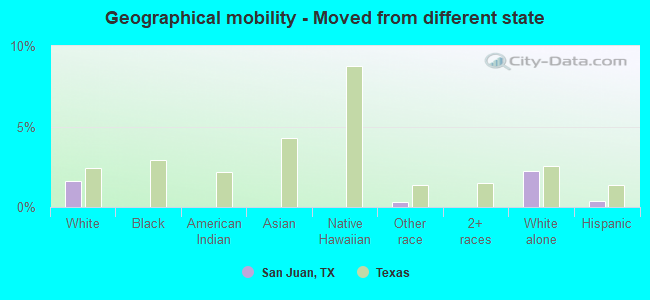
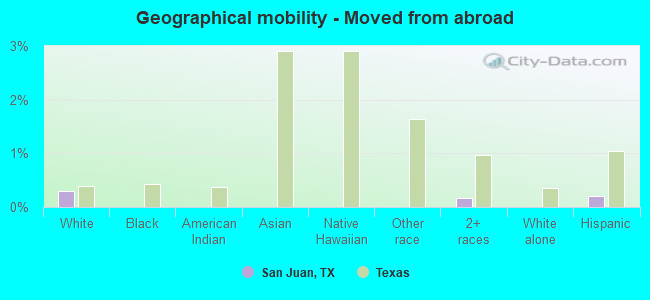
Geographical mobility in San Juan Same house 1 year ago 8,120 84.0% White (Caucasian)22 100.0% Black or African American24 100.0% American Indian / Alaska Native46 99.3% Asian21 98.2% Native Hawaiian / Pacific Islander2,634 88.1% Other race18,790 92.4% Two or more races964 92.4% White alone, not Hispanic / Latino30,224 87.5% Hispanic or LatinoMoved within same county 1,507 15.6% White / Caucasian320 10.7% Other race1,334 6.6% Two or more races64 6.1% White alone, not Hispanic / Latino4,102 11.9% Hispanic or LatinoMoved within same state 29 0.3% White / Caucasian1 0.0% Other race137 0.7% Two or more races155 0.4% Hispanic or LatinoMoved from different state 158 1.6% White / Caucasian9 0.3% Other race23 2.2% White alone, not Hispanic / Latino128 0.4% Hispanic or LatinoMoved from abroad 29 0.3% White34 0.2% Two or more races68 0.2% Hispanic or Latino
Children Nativity (place of birth) in San Juan
Children under 6 years - Living with two parents Both parents native 783 100.0% NativeBoth parents foreign-born 388 100.0% NativeOne native, one foreign-born parent 492 100.0% NativeChildren under 6 years - Living with one parent Native parent 1,280 100.0% NativeForeign-born parent 650 97.9% Native14 2.1% Foreign-bornChildren 6 to 17 years - Living with two parents Both parents native 1,401 99.9% Native1 0.1% Foreign-bornBoth parents foreign-born 1,125 83.2% Native227 16.8% Foreign-bornOne native, one foreign-born parent 1,665 98.3% Native28 1.7% Foreign-bornChildren 6 to 17 years - Living with one parent Native parent 1,683 100.0% NativeForeign-born parent 1,192 54.7% Native987 45.3% Foreign-born
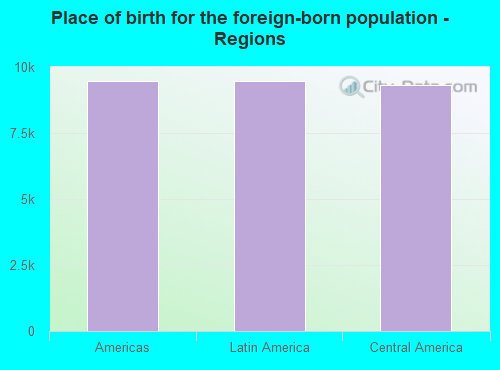
Place of birth for residents in San Juan 9,465 Americas9,465 Latin America9,309 Central America78 Caribbean77 South America44 Asia35 South Eastern Asia9 Eastern Asia2 Europe2 Northern Europe
Grandparents responsible for own grandchildren in San Juan
Grandparents (30 to 59 years) White / Caucasian 33 30.2% Responsible for grandchildren77 69.8% Not responsible for grandchildrenOther race 9 100.0% Not responsible for grandchildrenTwo or more races 298 37.9% Responsible for grandchildren488 62.1% Not responsible for grandchildrenHispanic or Latino 260 40.4% Responsible for grandchildren384 59.6% Not responsible for grandchildrenGrandparents (60 years and over) White / Caucasian 17 6.2% Responsible for grandchildren255 93.8% Not responsible for grandchildrenOther race 50 100.0% Not responsible for grandchildrenTwo or more races 101 38.2% Responsible for grandchildren163 61.8% Not responsible for grandchildrenHispanic or Latino 94 15.9% Responsible for grandchildren500 84.1% Not responsible for grandchildren