Races in Sanford, Maine (ME) Detailed Stats
Data:
Races - White alone (%)
Races - White alone (% change since 2000)
Races - Black alone (%)
Races - Black alone (% change since 2000)
Races - American Indian alone (%)
Races - American Indian alone (% change since 2000)
Races - Asian alone (%)
Races - Asian alone (% change since 2000)
Races - Hispanic (%)
Races - Hispanic (% change since 2000)
Races - Native Hawaiian and Other Pacific Islander alone (%)
Races - Native Hawaiian and Other Pacific Islander alone (% change since 2000)
Races - Two or more races(%)
Races - Two or more races(% change since 2000)
Races - Other race alone (%)
Races - Other race alone (% change since 2000)
Racial diversity
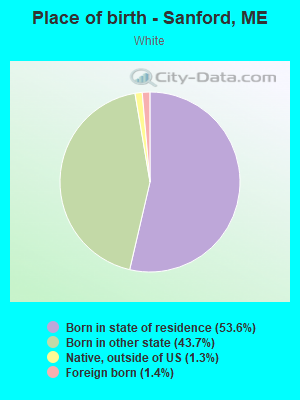
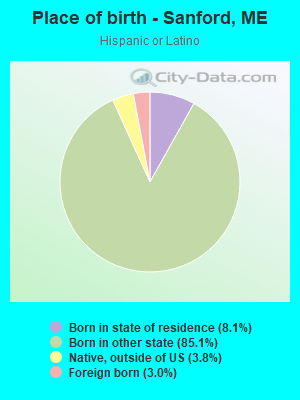
Place of birth - Born in state of residence (%)
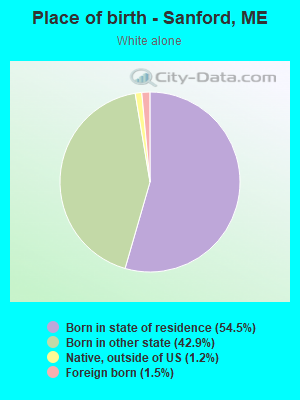
Place of birth - Born in state of residence (%) - White
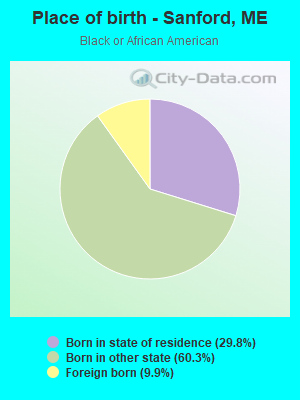
Place of birth - Born in state of residence (%) - Black or African American
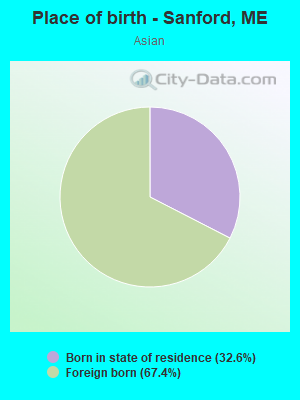
Place of birth - Born in state of residence (%) - Asian
Place of birth - Born in state of residence (%) - Hispanic or Latino
Place of birth - Born in state of residence (%) - American Indian and Alaska Native
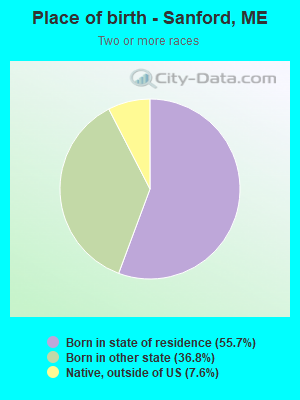
Place of birth - Born in state of residence (%) - Multirace
Place of birth - Born in state of residence (%) - Other Race
Place of birth - Born in other state (%)
Place of birth - Born in other state (%) - White
Place of birth - Born in other state (%) - Black or African American
Place of birth - Born in other state (%) - Asian
Place of birth - Born in other state (%) - Hispanic or Latino
Place of birth - Born in other state (%) - American Indian and Alaska Native
Place of birth - Born in other state (%) - Multirace
Place of birth - Born in other state (%) - Other Race
Place of birth - Native, outside of US (%)
Place of birth - Native, outside of US (%) - White
Place of birth - Native, outside of US (%) - Black or African American
Place of birth - Native, outside of US (%) - Asian
Place of birth - Native, outside of US (%) - Hispanic or Latino
Place of birth - Native, outside of US (%) - American Indian and Alaska Native
Place of birth - Native, outside of US (%) - Multirace
Place of birth - Native, outside of US (%) - Other Race
Place of birth - Foreign born (%)
Place of birth - Foreign born (%) - White
Place of birth - Foreign born (%) - Black or African American
Place of birth - Foreign born (%) - Asian
Place of birth - Foreign born (%) - Hispanic or Latino
Place of birth - Foreign born (%) - American Indian and Alaska Native
Place of birth - Foreign born (%) - Multirace
Place of birth - Foreign born (%) - Other Race
Residents speaking English at home (%)
Residents speaking English at home - Born in the United States (%)
Residents speaking English at home - Native, born elsewhere (%)
Residents speaking English at home - Foreign born (%)
Residents speaking Spanish at home (%)
Residents speaking Spanish at home - Born in the United States (%)
Residents speaking Spanish at home - Native, born elsewhere (%)
Residents speaking Spanish at home - Foreign born (%)
Residents speaking other language at home (%)
Residents speaking other language at home - Born in the United States (%)
Residents speaking other language at home - Native, born elsewhere (%)
Residents speaking other language at home - Foreign born (%)
Marital status - Never married (%)
Marital status - Now married (%)
Marital status - Separated (%)
Marital status - Widowed (%)
Marital status - Divorced (%)
Ancestries Reported - Arab (%)
Ancestries Reported - Czech (%)
Ancestries Reported - Danish (%)
Ancestries Reported - Dutch (%)
Ancestries Reported - English (%)
Ancestries Reported - French (%)
Ancestries Reported - French Canadian (%)
Ancestries Reported - German (%)
Ancestries Reported - Greek (%)
Ancestries Reported - Hungarian (%)
Ancestries Reported - Irish (%)
Ancestries Reported - Italian (%)
Ancestries Reported - Lithuanian (%)
Ancestries Reported - Norwegian (%)
Ancestries Reported - Polish (%)
Ancestries Reported - Portuguese (%)
Ancestries Reported - Russian (%)
Ancestries Reported - Scotch-Irish (%)
Ancestries Reported - Scottish (%)
Ancestries Reported - Slovak (%)
Ancestries Reported - Subsaharan African (%)
Ancestries Reported - Swedish (%)
Ancestries Reported - Swiss (%)
Ancestries Reported - Ukrainian (%)
Ancestries Reported - United States (%)
Ancestries Reported - Welsh (%)
Ancestries Reported - West Indian (%)
Ancestries Reported - Other (%)
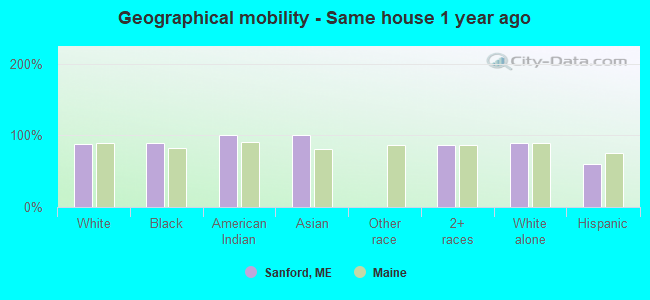
Geographical mobility - Same house 1 year ago (%)
Geographical mobility - Same house 1 year ago (%) - White
Geographical mobility - Same house 1 year ago (%) - Black or African American
Geographical mobility - Same house 1 year ago (%) - Asian
Geographical mobility - Same house 1 year ago (%) - Hispanic or Latino
Geographical mobility - Same house 1 year ago (%) - American Indian and Alaska Native
Geographical mobility - Same house 1 year ago (%) - Multirace
Geographical mobility - Same house 1 year ago (%) - Other Race
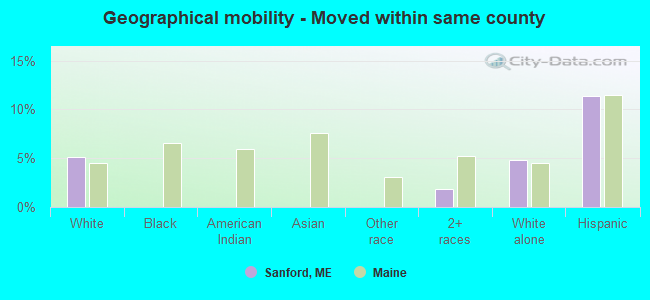
Geographical mobility - Moved within same county (%)
Geographical mobility - Moved within same county (%) - White
Geographical mobility - Moved within same county (%) - Black or African American
Geographical mobility - Moved within same county (%) - Asian
Geographical mobility - Moved within same county (%) - Hispanic or Latino
Geographical mobility - Moved within same county (%) - American Indian and Alaska Native
Geographical mobility - Moved within same county (%) - Multirace
Geographical mobility - Moved within same county (%) - Other Race
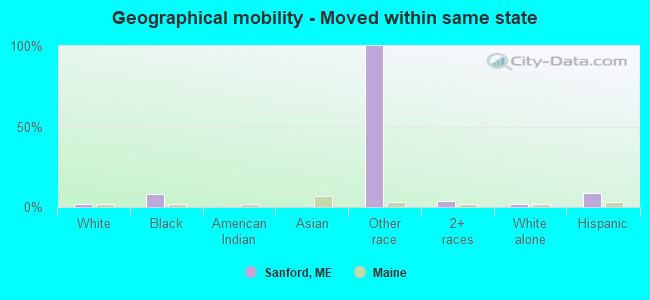
Geographical mobility - Moved from different county within same state (%)
Geographical mobility - Moved from different county within same state (%) - White
Geographical mobility - Moved from different county within same state (%) - Black or African American
Geographical mobility - Moved from different county within same state (%) - Asian
Geographical mobility - Moved from different county within same state (%) - Hispanic or Latino
Geographical mobility - Moved from different county within same state (%) - American Indian and Alaska Native
Geographical mobility - Moved from different county within same state (%) - Multirace
Geographical mobility - Moved from different county within same state (%) - Other Race
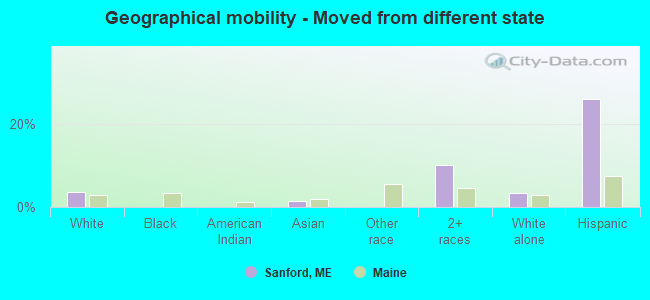
Geographical mobility - Moved from different state (%)
Geographical mobility - Moved from different state (%) - White
Geographical mobility - Moved from different state (%) - Black or African American
Geographical mobility - Moved from different state (%) - Asian
Geographical mobility - Moved from different state (%) - Hispanic or Latino
Geographical mobility - Moved from different state (%) - American Indian and Alaska Native
Geographical mobility - Moved from different state (%) - Multirace
Geographical mobility - Moved from different state (%) - Other Race
Geographical mobility - Moved from abroad (%)
Geographical mobility - Moved from abroad (%) - White
Geographical mobility - Moved from abroad (%) - Black or African American
Geographical mobility - Moved from abroad (%) - Asian
Geographical mobility - Moved from abroad (%) - Hispanic or Latino
Geographical mobility - Moved from abroad (%) - American Indian and Alaska Native
Geographical mobility - Moved from abroad (%) - Multirace
Geographical mobility - Moved from abroad (%) - Other Race
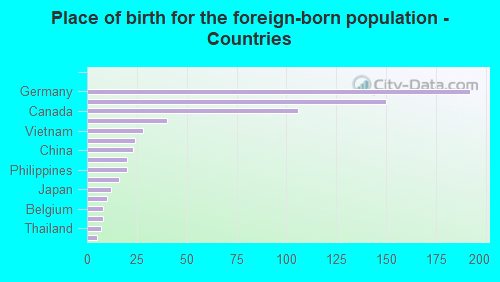
Place of birth for the foreign-born population - Ireland (%)
Place of birth for the foreign-born population - Denmark (%)
Place of birth for the foreign-born population - Norway (%)
Place of birth for the foreign-born population - Sweden (%)
Place of birth for the foreign-born population - United Kingdom (%)
Place of birth for the foreign-born population - England (%)
Place of birth for the foreign-born population - Scotland (%)
Place of birth for the foreign-born population - Other Northern Europe (%)
Place of birth for the foreign-born population - Austria (%)
Place of birth for the foreign-born population - Belgium (%)
Place of birth for the foreign-born population - France (%)
Place of birth for the foreign-born population - Germany (%)
Place of birth for the foreign-born population - Netherlands (%)
Place of birth for the foreign-born population - Switzerland (%)
Place of birth for the foreign-born population - Other Western Europe (%)
Place of birth for the foreign-born population - Greece (%)
Place of birth for the foreign-born population - Italy (%)
Place of birth for the foreign-born population - Portugal (%)
Place of birth for the foreign-born population - Spain (%)
Place of birth for the foreign-born population - Other Southern Europe (%)
Place of birth for the foreign-born population - Albania (%)
Place of birth for the foreign-born population - Belarus (%)
Place of birth for the foreign-born population - Bosnia and Herzegovina (%)
Place of birth for the foreign-born population - Bulgaria (%)
Place of birth for the foreign-born population - Croatia (%)
Place of birth for the foreign-born population - Czechoslovakia (%)
Place of birth for the foreign-born population - Hungary (%)
Place of birth for the foreign-born population - Latvia (%)
Place of birth for the foreign-born population - Lithuania (%)
Place of birth for the foreign-born population - North Macedonia (Macedonia) (%)
Place of birth for the foreign-born population - Moldova (%)
Place of birth for the foreign-born population - Poland (%)
Place of birth for the foreign-born population - Romania (%)
Place of birth for the foreign-born population - Russia (%)
Place of birth for the foreign-born population - Serbia (%)
Place of birth for the foreign-born population - Ukraine (%)
Place of birth for the foreign-born population - Other Eastern Europe (%)
Place of birth for the foreign-born population - China (%)
Place of birth for the foreign-born population - Hong Kong (%)
Place of birth for the foreign-born population - Taiwan (%)
Place of birth for the foreign-born population - Japan (%)
Place of birth for the foreign-born population - Korea (%)
Place of birth for the foreign-born population - Other Eastern Asia (%)
Place of birth for the foreign-born population - Afghanistan (%)
Place of birth for the foreign-born population - Bangladesh (%)
Place of birth for the foreign-born population - India (%)
Place of birth for the foreign-born population - Iran (%)
Place of birth for the foreign-born population - Kazakhstan (%)
Place of birth for the foreign-born population - Nepal (%)
Place of birth for the foreign-born population - Pakistan (%)
Place of birth for the foreign-born population - Sri Lanka (%)
Place of birth for the foreign-born population - Uzbekistan (%)
Place of birth for the foreign-born population - Other South Central Asia (%)
Place of birth for the foreign-born population - Burma (%)
Place of birth for the foreign-born population - Cambodia (%)
Place of birth for the foreign-born population - Indonesia (%)
Place of birth for the foreign-born population - Laos (%)
Place of birth for the foreign-born population - Malaysia (%)
Place of birth for the foreign-born population - Philippines (%)
Place of birth for the foreign-born population - Singapore (%)
Place of birth for the foreign-born population - Thailand (%)
Place of birth for the foreign-born population - Vietnam (%)
Place of birth for the foreign-born population - Other South Eastern Asia (%)
Place of birth for the foreign-born population - Armenia (%)
Place of birth for the foreign-born population - Iraq (%)
Place of birth for the foreign-born population - Israel (%)
Place of birth for the foreign-born population - Jordan (%)
Place of birth for the foreign-born population - Kuwait (%)
Place of birth for the foreign-born population - Lebanon (%)
Place of birth for the foreign-born population - Saudi Arabia (%)
Place of birth for the foreign-born population - Syria (%)
Place of birth for the foreign-born population - Turkey (%)
Place of birth for the foreign-born population - Yemen (%)
Place of birth for the foreign-born population - Other Western Asia (%)
Place of birth for the foreign-born population - Eritrea (%)
Place of birth for the foreign-born population - Ethiopia (%)
Place of birth for the foreign-born population - Kenya (%)
Place of birth for the foreign-born population - Somalia (%)
Place of birth for the foreign-born population - Uganda (%)
Place of birth for the foreign-born population - Zimbabwe (%)
Place of birth for the foreign-born population - Other Eastern Africa (%)
Place of birth for the foreign-born population - Cameroon (%)
Place of birth for the foreign-born population - Congo (%)
Place of birth for the foreign-born population - Democratic Republic of Congo (Zaire) (%)
Place of birth for the foreign-born population - Other Middle Africa (%)
Place of birth for the foreign-born population - Egypt (%)
Place of birth for the foreign-born population - Morocco (%)
Place of birth for the foreign-born population - Sudan (%)
Place of birth for the foreign-born population - Other Northern Africa (%)
Place of birth for the foreign-born population - South Africa (%)
Place of birth for the foreign-born population - Other Southern Africa (%)
Place of birth for the foreign-born population - Cabo Verde (%)
Place of birth for the foreign-born population - Ghana (%)
Place of birth for the foreign-born population - Liberia (%)
Place of birth for the foreign-born population - Nigeria (%)
Place of birth for the foreign-born population - Senegal (%)
Place of birth for the foreign-born population - Sierra Leone (%)
Place of birth for the foreign-born population - Other Western Africa (%)
Place of birth for the foreign-born population - Australia (%)
Place of birth for the foreign-born population - New Zealand (%)
Place of birth for the foreign-born population - Fiji (%)
Place of birth for the foreign-born population - Micronesia (%)
Place of birth for the foreign-born population - Bahamas (%)
Place of birth for the foreign-born population - Barbados (%)
Place of birth for the foreign-born population - Cuba (%)
Place of birth for the foreign-born population - Dominica (%)
Place of birth for the foreign-born population - Dominican Republic (%)
Place of birth for the foreign-born population - Grenada (%)
Place of birth for the foreign-born population - Haiti (%)
Place of birth for the foreign-born population - Jamaica (%)
Place of birth for the foreign-born population - St. Vincent and the Grenadines (%)
Place of birth for the foreign-born population - Trinidad and Tobago (%)
Place of birth for the foreign-born population - West Indies (%)
Place of birth for the foreign-born population - Other Caribbean (%)
Place of birth for the foreign-born population - Belize (%)
Place of birth for the foreign-born population - Costa Rica (%)
Place of birth for the foreign-born population - El Salvador (%)
Place of birth for the foreign-born population - Guatemala (%)
Place of birth for the foreign-born population - Honduras (%)
Place of birth for the foreign-born population - Mexico (%)
Place of birth for the foreign-born population - Nicaragua (%)
Place of birth for the foreign-born population - Panama (%)
Place of birth for the foreign-born population - Other Central America (%)
Place of birth for the foreign-born population - Argentina (%)
Place of birth for the foreign-born population - Bolivia (%)
Place of birth for the foreign-born population - Brazil (%)
Place of birth for the foreign-born population - Chile (%)
Place of birth for the foreign-born population - Colombia (%)
Place of birth for the foreign-born population - Ecuador (%)
Place of birth for the foreign-born population - Guyana (%)
Place of birth for the foreign-born population - Peru (%)
Place of birth for the foreign-born population - Uruguay (%)
Place of birth for the foreign-born population - Venezuela (%)
Place of birth for the foreign-born population - Other South America (%)
Place of birth for the foreign-born population - Canada (%)
Place of birth for the foreign-born population - Other Northern America (%)
Place of birth for the foreign-born population - Other (%)
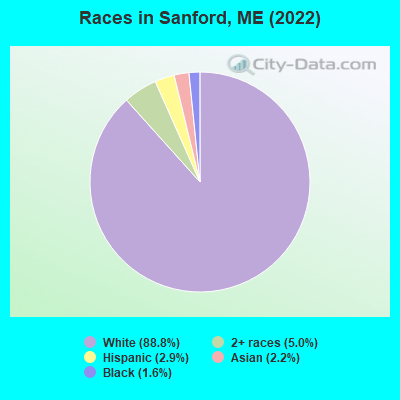
According to 2022 data, the most numerous races in Sanford, ME are White alone (19,905 residents), Two or more races (1,109 residents), and Hispanic (644 residents). 93.8% of Sanford residents speak English at home. 3.1% of Sanford, ME residents are foreign-born (1.3% born in Europe, 1.1% born in Asia, 0.5% born in North America), which is about the same as the foreign-born rate of 3.0% across the entire state of Maine.
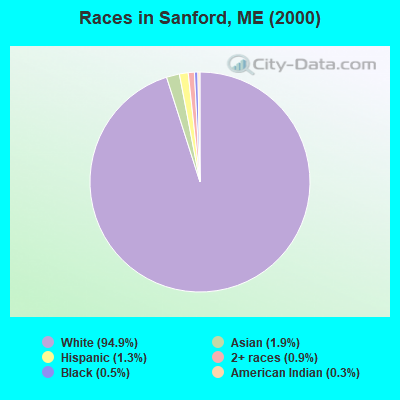
Race distribution in Sanford
2000 2022
1,230,297 96.5% White alone 11,731 0.9% Two or more races 9,360 0.7% Hispanic 9,014 0.7% Asian alone 6,440 0.5% Black alone 6,911 0.5% American Indian alone 836 0.07% Other race alone 334 0.03% Native Hawaiian and Other
1,249,233 90.2% White alone 58,357 4.2% Two or more races 28,717 2.1% Hispanic 21,583 1.6% Black alone 16,151 1.2% Asian alone 5,873 0.4% Other race alone 5,205 0.4% American Indian alone 221 0.02% Native Hawaiian and Other
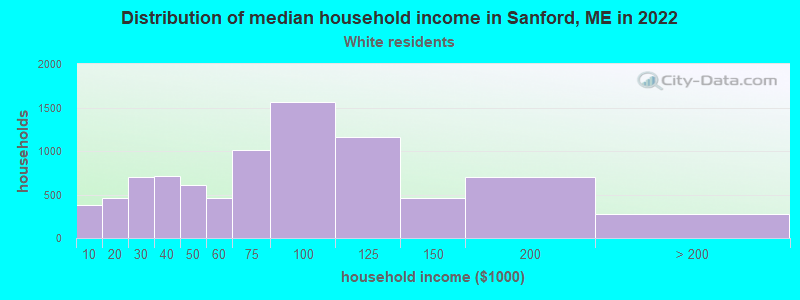
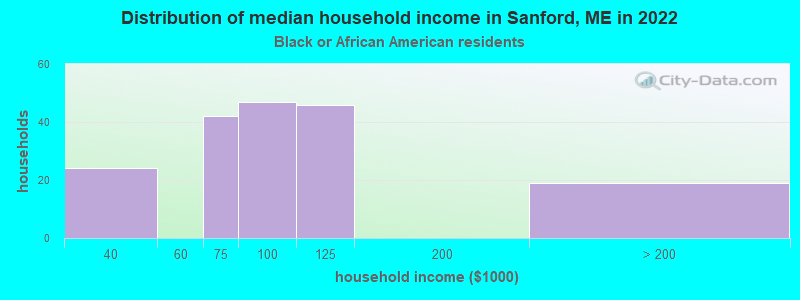
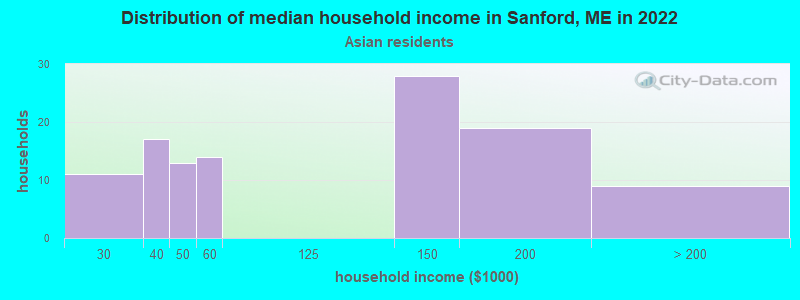
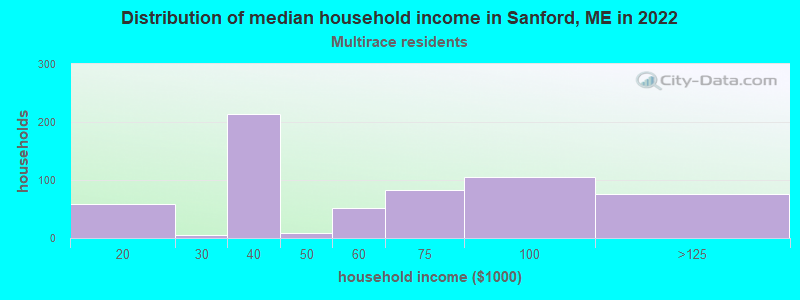
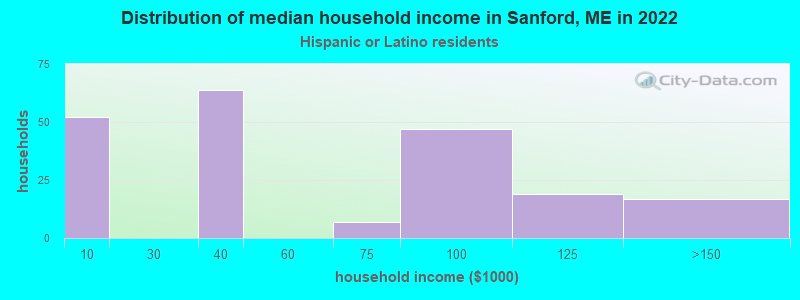
Income and house value in Sanford Median household income in 2022 $74,748 White non-Hispanic householders$84,404 Black householders$54,327 Two or more races householders$71,902 Hispanic or Latino race householdersMedian 2022 house value $278,596 White Non-Hispanic householders$409,962 Two or more races householders$555,289 Hispanic or Latino householders
Median age by race in Sanford
40.2 Median age for White residents40.7 39.5 38.6 Median age for Black or African American residents38.3 30.2 -896,024,463.9 Median age for American Indian / Alaska Native residents-673,777,777.1 -1,172,897,195.1 38.1 Median age for Asian residents28.9 39.4 -442,352,940.7 Median age for Native Hawaiian / Pacific Islander residents-666,666,666.0 -666,666,666.0 -892,753,622.3 Median age for Other race residents-939,393,938.5 -682,080,924.2 27.4 Median age for Two or more races residents30.8 24.5 40.7 Median age for White alone residents41.4 39.8 23.8 Median age for Hispanic or Latino residents29.9 21.8
Owner/renter occupied households by race in Sanford
House owners and renters - White residents 6,064 71.6% Owner occupied2,407 28.4% Renter occupiedHouse owners and renters - Black or African American residents 83 75.3% Owner occupied27 24.7% Renter occupiedHouse owners and renters - American Indian / Alaska Native residents 8 100.0% Owner occupiedHouse owners and renters - Asian residents 188 83.7% Owner occupied37 16.3% Renter occupiedHouse owners and renters - Other race residents 27 100.0% Owner occupiedHouse owners and renters - Two or more races residents 225 43.9% Owner occupied288 56.1% Renter occupiedHouse owners and renters - White alone residents 6,025 71.3% Owner occupied2,423 28.7% Renter occupiedHouse owners and renters - Hispanic or Latino residents 62 62.6% Owner occupied37 37.4% Renter occupied
Language usage in Sanford
English speakers - Total 93.8% of residents of Sanford speak English at home.
1.1% of residents speak Spanish at home 207 90.8% Speak English very well21 9.2% Speak English less than very well5.1% of residents speak other language at home 778 72.8% Speak English very well290 27.2% Speak English less than very well
English speakers - Born in the United States 96.7% of residents of Sanford speak English at home.
2.1% of residents speak Spanish at home 136 72.3% Speak English very well52 27.7% Speak English less than very well1.6% of residents speak other language at home 136 91.9% Speak English very well12 8.1% Speak English less than very well
English speakers - Native, born elsewhere 87.8% of residents of Sanford speak English at home.
11.6% of residents speak Spanish at home 42 100.0% Speak English very well
English speakers - Foreign-born 41.6% of residents of Sanford speak English at home.
3.4% of residents speak Spanish at home 23 100.0% Speak English very well56.9% of residents speak other language at home 234 60.3% Speak English very well154 39.7% Speak English less than very well
White (Caucasian) - Speak only English Native:
96.1% (18,134)Foreign-born:
55.1% (153)
White (Caucasian) - Speak another language Native:
3.8% (723)Foreign-born:
44.9% (125)
Asian - Speak only English Native:
64.8% (86)Foreign-born:
15.7% (55)
Asian - Speak another language Native:
31.5% (42)Foreign-born:
87.5% (304)
White alone - Speak only English Native:
96.6% (17,920)Foreign-born:
54.0% (156)
White alone - Speak another language Native:
3.4% (630)Foreign-born:
46.2% (133)
Hispanic or Latino - Speak another language Native:
15.9% (94)Foreign-born:
93.5% (22)
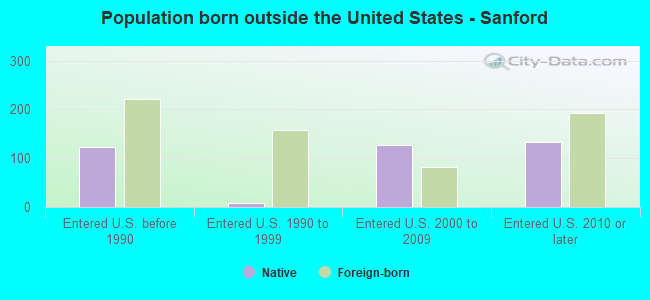
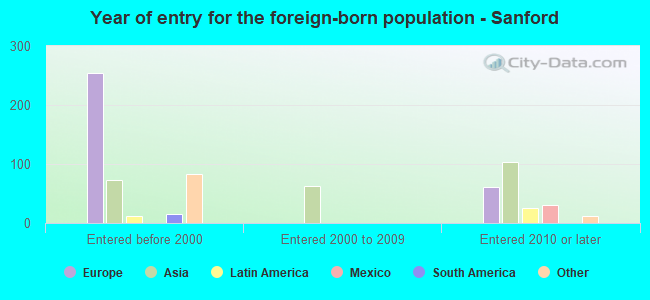
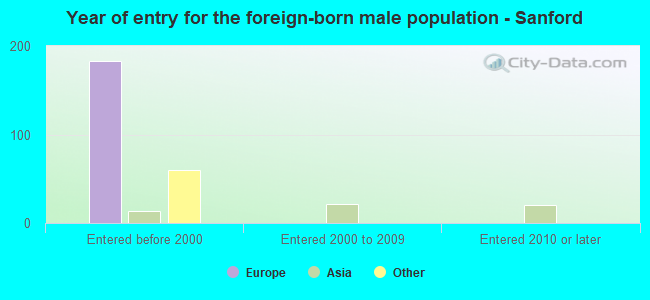
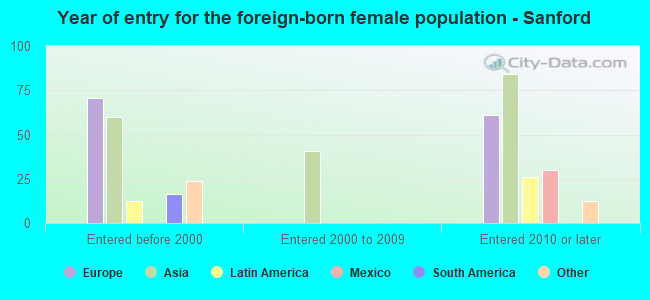
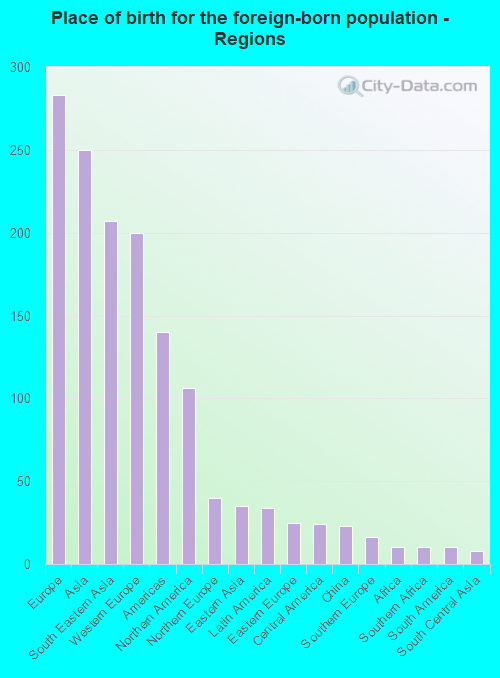
Foreign-born residents in Sanford 685 residents are foreign born (1.3% Europe , 1.1% Asia , 0.5% North America ).
Marital status for residents in Sanford Marital status - White (Caucasian) population 15 years and over
Males 29.6% Never married48.5% Now married3.1% Separated1.6% Widowed17.3% DivorcedFemales 30.6% Never married43.0% Now married1.2% Separated8.5% Widowed16.7% DivorcedWomen who gave birth in the past 12 months Now married:
52.7% (169)Unmarried:
47.3% (152)
Women who did not give birth in the past 12 months Now married:
37.2% (1,703)Unmarried:
62.8% (2,880)
Marital status - Black or African American population 15 years and over
Males 31.2% Never married53.8% Now married0.0% Separated0.0% Widowed15.1% DivorcedFemales 16.1% Never married24.2% Now married30.6% Separated0.0% Widowed29.0% DivorcedWomen who did not give birth in the past 12 months Now married:
0.0% (0)Unmarried:
100.0% (28)
Marital status - Asian population 15 years and over
Males 71.2% Never married18.9% Now married0.0% Separated0.0% Widowed9.8% DivorcedFemales 9.4% Never married52.5% Now married0.0% Separated16.8% Widowed21.3% DivorcedWomen who did not give birth in the past 12 months Now married:
59.9% (77)Unmarried:
40.1% (52)
Marital status - Two or more races population 15 years and over
Males 39.2% Never married39.4% Now married5.8% Separated0.0% Widowed15.6% DivorcedFemales 31.3% Never married26.6% Now married0.0% Separated9.1% Widowed33.0% DivorcedWomen who gave birth in the past 12 months Now married:
100.0% (10)Unmarried:
0.0% (0)
Women who did not give birth in the past 12 months Now married:
29.2% (77)Unmarried:
70.8% (186)
Marital status - White alone, not Hispanic / Latino population 15 years and over
Males 27.8% Never married49.6% Now married3.2% Separated1.6% Widowed17.9% DivorcedFemales 30.4% Never married43.5% Now married1.2% Separated8.6% Widowed16.3% DivorcedWomen who gave birth in the past 12 months Now married:
55.9% (169)Unmarried:
44.1% (134)
Women who did not give birth in the past 12 months Now married:
37.7% (1,704)Unmarried:
62.3% (2,812)
Marital status - Hispanic or Latino population 15 years and over
Males 72.8% Never married27.2% Now married0.0% Separated0.0% Widowed0.0% DivorcedFemales 28.5% Never married12.6% Now married0.0% Separated13.2% Widowed45.7% DivorcedWomen who gave birth in the past 12 months Now married:
28.0% (11)Unmarried:
72.0% (29)
Women who did not give birth in the past 12 months Now married:
0.0% (0)Unmarried:
100.0% (153)
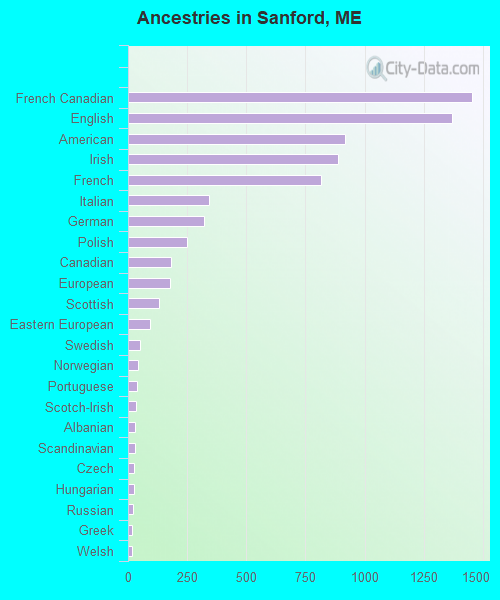
Ancestries in Sanford
1,453 17.0% French Canadian1,370 16.0% English915 10.7% American887 10.4% Irish817 9.6% French341 4.0% Italian322 3.8% German251 2.9% Polish181 2.1% Canadian179 2.1% European130 1.5% Scottish94 1.1% Eastern European49 0.6% Swedish44 0.5% Norwegian40 0.5% Portuguese33 0.4% Scotch-Irish31 0.4% Albanian31 0.4% Scandinavian25 0.3% Czech24 0.3% Hungarian23 0.3% Russian18 0.2% Greek15 0.2% Welsh11 0.1% British10 0.1% Cajun9 0.1% African8 0.09% Lebanese6 0.07% Lithuanian5 0.06% Slovene
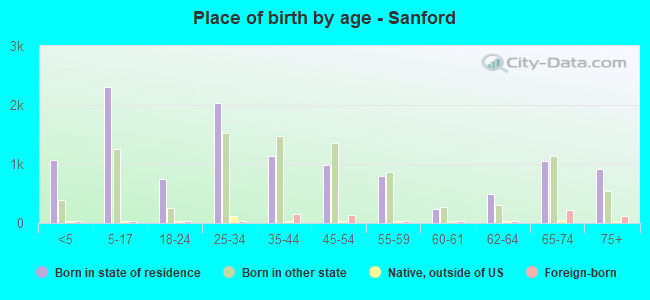
Children Nativity (place of birth) in Sanford
Children under 6 years - Living with two parents Both parents native 957 100.0% NativeOne native, one foreign-born parent 68 100.0% NativeChildren under 6 years - Living with one parent Native parent 725 100.0% NativeChildren 6 to 17 years - Living with two parents Both parents native 1,635 100.0% NativeOne native, one foreign-born parent 34 100.0% NativeChildren 6 to 17 years - Living with one parent Native parent 1,306 100.0% NativeForeign-born parent 89 50.0% Native89 50.0% Foreign-born
Grandparents responsible for own grandchildren in Sanford
Grandparents (30 to 59 years) White / Caucasian 14 26.9% Responsible for grandchildren39 73.1% Not responsible for grandchildrenTwo or more races 82 100.0% Not responsible for grandchildrenWhite alone, not Hispanic / Latino 14 26.9% Responsible for grandchildren39 73.1% Not responsible for grandchildrenGrandparents (60 years and over) White / Caucasian 111 51.1% Responsible for grandchildren107 48.9% Not responsible for grandchildrenWhite alone, not Hispanic / Latino 111 51.1% Responsible for grandchildren107 48.9% Not responsible for grandchildren