Races in Santa Clara, Utah (UT) Detailed Stats
Data:
Races - White alone (%)
Races - White alone (% change since 2000)
Races - Black alone (%)
Races - Black alone (% change since 2000)
Races - American Indian alone (%)
Races - American Indian alone (% change since 2000)
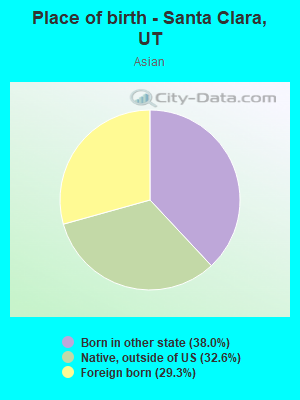
Races - Asian alone (%)
Races - Asian alone (% change since 2000)
Races - Hispanic (%)
Races - Hispanic (% change since 2000)
Races - Native Hawaiian and Other Pacific Islander alone (%)
Races - Native Hawaiian and Other Pacific Islander alone (% change since 2000)
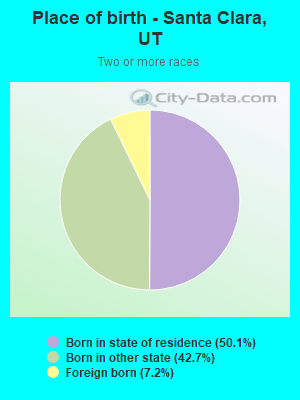
Races - Two or more races(%)
Races - Two or more races(% change since 2000)
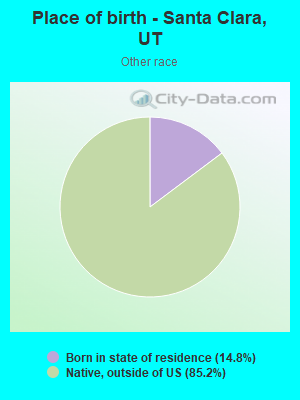
Races - Other race alone (%)
Races - Other race alone (% change since 2000)
Racial diversity
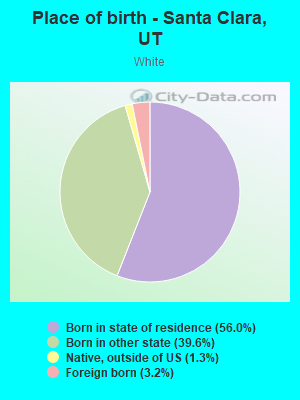
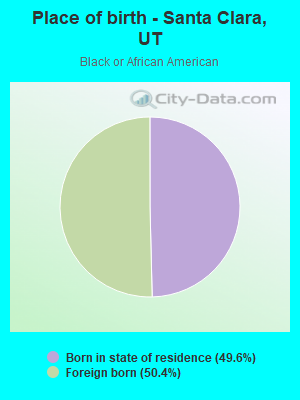
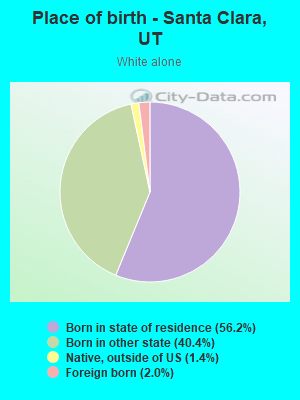
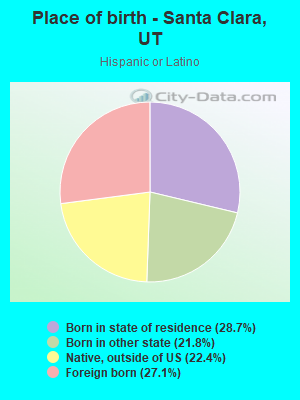
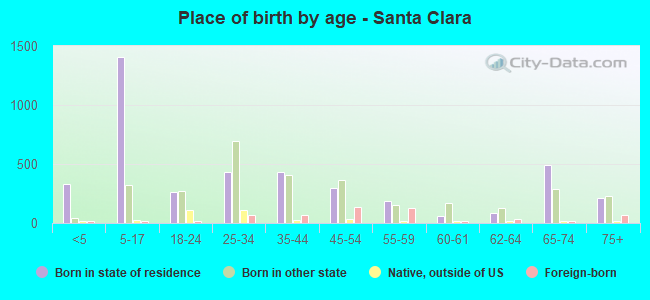
Place of birth - Born in state of residence (%)
Place of birth - Born in state of residence (%) - White
Place of birth - Born in state of residence (%) - Black or African American
Place of birth - Born in state of residence (%) - Asian
Place of birth - Born in state of residence (%) - Hispanic or Latino
Place of birth - Born in state of residence (%) - American Indian and Alaska Native
Place of birth - Born in state of residence (%) - Multirace
Place of birth - Born in state of residence (%) - Other Race
Place of birth - Born in other state (%)
Place of birth - Born in other state (%) - White
Place of birth - Born in other state (%) - Black or African American
Place of birth - Born in other state (%) - Asian
Place of birth - Born in other state (%) - Hispanic or Latino
Place of birth - Born in other state (%) - American Indian and Alaska Native
Place of birth - Born in other state (%) - Multirace
Place of birth - Born in other state (%) - Other Race
Place of birth - Native, outside of US (%)
Place of birth - Native, outside of US (%) - White
Place of birth - Native, outside of US (%) - Black or African American
Place of birth - Native, outside of US (%) - Asian
Place of birth - Native, outside of US (%) - Hispanic or Latino
Place of birth - Native, outside of US (%) - American Indian and Alaska Native
Place of birth - Native, outside of US (%) - Multirace
Place of birth - Native, outside of US (%) - Other Race
Place of birth - Foreign born (%)
Place of birth - Foreign born (%) - White
Place of birth - Foreign born (%) - Black or African American
Place of birth - Foreign born (%) - Asian
Place of birth - Foreign born (%) - Hispanic or Latino
Place of birth - Foreign born (%) - American Indian and Alaska Native
Place of birth - Foreign born (%) - Multirace
Place of birth - Foreign born (%) - Other Race
Residents speaking English at home (%)
Residents speaking English at home - Born in the United States (%)
Residents speaking English at home - Native, born elsewhere (%)
Residents speaking English at home - Foreign born (%)
Residents speaking Spanish at home (%)
Residents speaking Spanish at home - Born in the United States (%)
Residents speaking Spanish at home - Native, born elsewhere (%)
Residents speaking Spanish at home - Foreign born (%)
Residents speaking other language at home (%)
Residents speaking other language at home - Born in the United States (%)
Residents speaking other language at home - Native, born elsewhere (%)
Residents speaking other language at home - Foreign born (%)
Marital status - Never married (%)
Marital status - Now married (%)
Marital status - Separated (%)
Marital status - Widowed (%)
Marital status - Divorced (%)
Ancestries Reported - Arab (%)
Ancestries Reported - Czech (%)
Ancestries Reported - Danish (%)
Ancestries Reported - Dutch (%)
Ancestries Reported - English (%)
Ancestries Reported - French (%)
Ancestries Reported - French Canadian (%)
Ancestries Reported - German (%)
Ancestries Reported - Greek (%)
Ancestries Reported - Hungarian (%)
Ancestries Reported - Irish (%)
Ancestries Reported - Italian (%)
Ancestries Reported - Lithuanian (%)
Ancestries Reported - Norwegian (%)
Ancestries Reported - Polish (%)
Ancestries Reported - Portuguese (%)
Ancestries Reported - Russian (%)
Ancestries Reported - Scotch-Irish (%)
Ancestries Reported - Scottish (%)
Ancestries Reported - Slovak (%)
Ancestries Reported - Subsaharan African (%)
Ancestries Reported - Swedish (%)
Ancestries Reported - Swiss (%)
Ancestries Reported - Ukrainian (%)
Ancestries Reported - United States (%)
Ancestries Reported - Welsh (%)
Ancestries Reported - West Indian (%)
Ancestries Reported - Other (%)
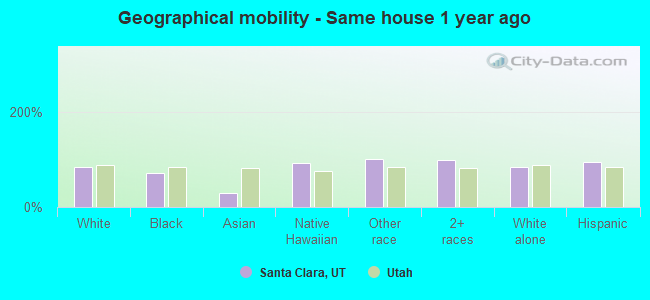
Geographical mobility - Same house 1 year ago (%)
Geographical mobility - Same house 1 year ago (%) - White
Geographical mobility - Same house 1 year ago (%) - Black or African American
Geographical mobility - Same house 1 year ago (%) - Asian
Geographical mobility - Same house 1 year ago (%) - Hispanic or Latino
Geographical mobility - Same house 1 year ago (%) - American Indian and Alaska Native
Geographical mobility - Same house 1 year ago (%) - Multirace
Geographical mobility - Same house 1 year ago (%) - Other Race
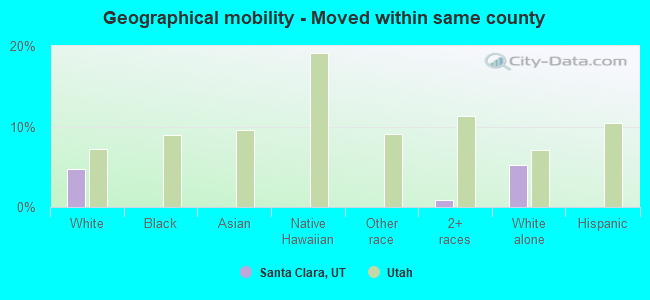
Geographical mobility - Moved within same county (%)
Geographical mobility - Moved within same county (%) - White
Geographical mobility - Moved within same county (%) - Black or African American
Geographical mobility - Moved within same county (%) - Asian
Geographical mobility - Moved within same county (%) - Hispanic or Latino
Geographical mobility - Moved within same county (%) - American Indian and Alaska Native
Geographical mobility - Moved within same county (%) - Multirace
Geographical mobility - Moved within same county (%) - Other Race
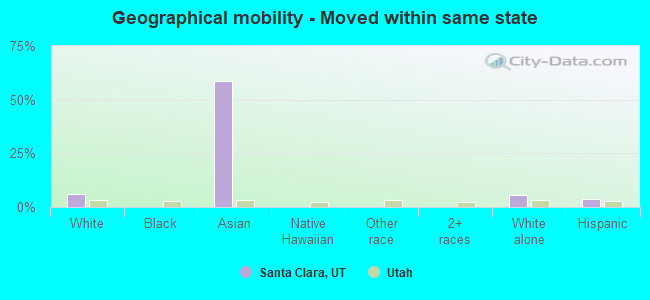
Geographical mobility - Moved from different county within same state (%)
Geographical mobility - Moved from different county within same state (%) - White
Geographical mobility - Moved from different county within same state (%) - Black or African American
Geographical mobility - Moved from different county within same state (%) - Asian
Geographical mobility - Moved from different county within same state (%) - Hispanic or Latino
Geographical mobility - Moved from different county within same state (%) - American Indian and Alaska Native
Geographical mobility - Moved from different county within same state (%) - Multirace
Geographical mobility - Moved from different county within same state (%) - Other Race
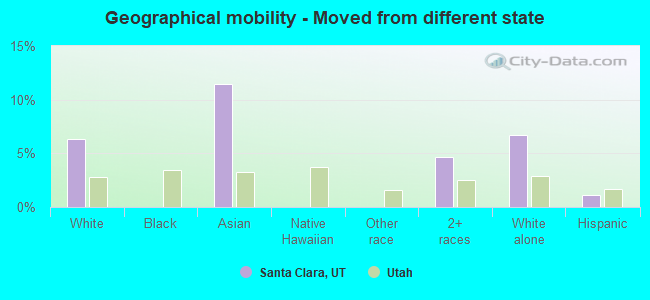
Geographical mobility - Moved from different state (%)
Geographical mobility - Moved from different state (%) - White
Geographical mobility - Moved from different state (%) - Black or African American
Geographical mobility - Moved from different state (%) - Asian
Geographical mobility - Moved from different state (%) - Hispanic or Latino
Geographical mobility - Moved from different state (%) - American Indian and Alaska Native
Geographical mobility - Moved from different state (%) - Multirace
Geographical mobility - Moved from different state (%) - Other Race
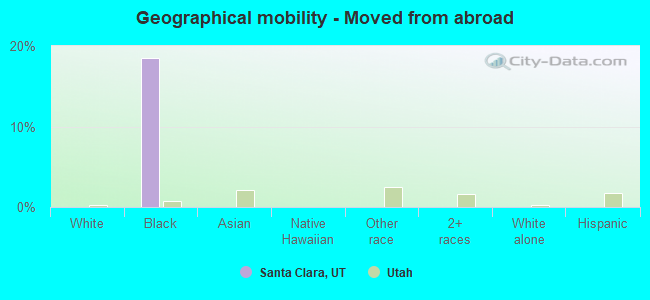
Geographical mobility - Moved from abroad (%)
Geographical mobility - Moved from abroad (%) - White
Geographical mobility - Moved from abroad (%) - Black or African American
Geographical mobility - Moved from abroad (%) - Asian
Geographical mobility - Moved from abroad (%) - Hispanic or Latino
Geographical mobility - Moved from abroad (%) - American Indian and Alaska Native
Geographical mobility - Moved from abroad (%) - Multirace
Geographical mobility - Moved from abroad (%) - Other Race
Place of birth for the foreign-born population - Ireland (%)
Place of birth for the foreign-born population - Denmark (%)
Place of birth for the foreign-born population - Norway (%)
Place of birth for the foreign-born population - Sweden (%)
Place of birth for the foreign-born population - United Kingdom (%)
Place of birth for the foreign-born population - England (%)
Place of birth for the foreign-born population - Scotland (%)
Place of birth for the foreign-born population - Other Northern Europe (%)
Place of birth for the foreign-born population - Austria (%)
Place of birth for the foreign-born population - Belgium (%)
Place of birth for the foreign-born population - France (%)
Place of birth for the foreign-born population - Germany (%)
Place of birth for the foreign-born population - Netherlands (%)
Place of birth for the foreign-born population - Switzerland (%)
Place of birth for the foreign-born population - Other Western Europe (%)
Place of birth for the foreign-born population - Greece (%)
Place of birth for the foreign-born population - Italy (%)
Place of birth for the foreign-born population - Portugal (%)
Place of birth for the foreign-born population - Spain (%)
Place of birth for the foreign-born population - Other Southern Europe (%)
Place of birth for the foreign-born population - Albania (%)
Place of birth for the foreign-born population - Belarus (%)
Place of birth for the foreign-born population - Bosnia and Herzegovina (%)
Place of birth for the foreign-born population - Bulgaria (%)
Place of birth for the foreign-born population - Croatia (%)
Place of birth for the foreign-born population - Czechoslovakia (%)
Place of birth for the foreign-born population - Hungary (%)
Place of birth for the foreign-born population - Latvia (%)
Place of birth for the foreign-born population - Lithuania (%)
Place of birth for the foreign-born population - North Macedonia (Macedonia) (%)
Place of birth for the foreign-born population - Moldova (%)
Place of birth for the foreign-born population - Poland (%)
Place of birth for the foreign-born population - Romania (%)
Place of birth for the foreign-born population - Russia (%)
Place of birth for the foreign-born population - Serbia (%)
Place of birth for the foreign-born population - Ukraine (%)
Place of birth for the foreign-born population - Other Eastern Europe (%)
Place of birth for the foreign-born population - China (%)
Place of birth for the foreign-born population - Hong Kong (%)
Place of birth for the foreign-born population - Taiwan (%)
Place of birth for the foreign-born population - Japan (%)
Place of birth for the foreign-born population - Korea (%)
Place of birth for the foreign-born population - Other Eastern Asia (%)
Place of birth for the foreign-born population - Afghanistan (%)
Place of birth for the foreign-born population - Bangladesh (%)
Place of birth for the foreign-born population - India (%)
Place of birth for the foreign-born population - Iran (%)
Place of birth for the foreign-born population - Kazakhstan (%)
Place of birth for the foreign-born population - Nepal (%)
Place of birth for the foreign-born population - Pakistan (%)
Place of birth for the foreign-born population - Sri Lanka (%)
Place of birth for the foreign-born population - Uzbekistan (%)
Place of birth for the foreign-born population - Other South Central Asia (%)
Place of birth for the foreign-born population - Burma (%)
Place of birth for the foreign-born population - Cambodia (%)
Place of birth for the foreign-born population - Indonesia (%)
Place of birth for the foreign-born population - Laos (%)
Place of birth for the foreign-born population - Malaysia (%)
Place of birth for the foreign-born population - Philippines (%)
Place of birth for the foreign-born population - Singapore (%)
Place of birth for the foreign-born population - Thailand (%)
Place of birth for the foreign-born population - Vietnam (%)
Place of birth for the foreign-born population - Other South Eastern Asia (%)
Place of birth for the foreign-born population - Armenia (%)
Place of birth for the foreign-born population - Iraq (%)
Place of birth for the foreign-born population - Israel (%)
Place of birth for the foreign-born population - Jordan (%)
Place of birth for the foreign-born population - Kuwait (%)
Place of birth for the foreign-born population - Lebanon (%)
Place of birth for the foreign-born population - Saudi Arabia (%)
Place of birth for the foreign-born population - Syria (%)
Place of birth for the foreign-born population - Turkey (%)
Place of birth for the foreign-born population - Yemen (%)
Place of birth for the foreign-born population - Other Western Asia (%)
Place of birth for the foreign-born population - Eritrea (%)
Place of birth for the foreign-born population - Ethiopia (%)
Place of birth for the foreign-born population - Kenya (%)
Place of birth for the foreign-born population - Somalia (%)
Place of birth for the foreign-born population - Uganda (%)
Place of birth for the foreign-born population - Zimbabwe (%)
Place of birth for the foreign-born population - Other Eastern Africa (%)
Place of birth for the foreign-born population - Cameroon (%)
Place of birth for the foreign-born population - Congo (%)
Place of birth for the foreign-born population - Democratic Republic of Congo (Zaire) (%)
Place of birth for the foreign-born population - Other Middle Africa (%)
Place of birth for the foreign-born population - Egypt (%)
Place of birth for the foreign-born population - Morocco (%)
Place of birth for the foreign-born population - Sudan (%)
Place of birth for the foreign-born population - Other Northern Africa (%)
Place of birth for the foreign-born population - South Africa (%)
Place of birth for the foreign-born population - Other Southern Africa (%)
Place of birth for the foreign-born population - Cabo Verde (%)
Place of birth for the foreign-born population - Ghana (%)
Place of birth for the foreign-born population - Liberia (%)
Place of birth for the foreign-born population - Nigeria (%)
Place of birth for the foreign-born population - Senegal (%)
Place of birth for the foreign-born population - Sierra Leone (%)
Place of birth for the foreign-born population - Other Western Africa (%)
Place of birth for the foreign-born population - Australia (%)
Place of birth for the foreign-born population - New Zealand (%)
Place of birth for the foreign-born population - Fiji (%)
Place of birth for the foreign-born population - Micronesia (%)
Place of birth for the foreign-born population - Bahamas (%)
Place of birth for the foreign-born population - Barbados (%)
Place of birth for the foreign-born population - Cuba (%)
Place of birth for the foreign-born population - Dominica (%)
Place of birth for the foreign-born population - Dominican Republic (%)
Place of birth for the foreign-born population - Grenada (%)
Place of birth for the foreign-born population - Haiti (%)
Place of birth for the foreign-born population - Jamaica (%)
Place of birth for the foreign-born population - St. Vincent and the Grenadines (%)
Place of birth for the foreign-born population - Trinidad and Tobago (%)
Place of birth for the foreign-born population - West Indies (%)
Place of birth for the foreign-born population - Other Caribbean (%)
Place of birth for the foreign-born population - Belize (%)
Place of birth for the foreign-born population - Costa Rica (%)
Place of birth for the foreign-born population - El Salvador (%)
Place of birth for the foreign-born population - Guatemala (%)
Place of birth for the foreign-born population - Honduras (%)
Place of birth for the foreign-born population - Mexico (%)
Place of birth for the foreign-born population - Nicaragua (%)
Place of birth for the foreign-born population - Panama (%)
Place of birth for the foreign-born population - Other Central America (%)
Place of birth for the foreign-born population - Argentina (%)
Place of birth for the foreign-born population - Bolivia (%)
Place of birth for the foreign-born population - Brazil (%)
Place of birth for the foreign-born population - Chile (%)
Place of birth for the foreign-born population - Colombia (%)
Place of birth for the foreign-born population - Ecuador (%)
Place of birth for the foreign-born population - Guyana (%)
Place of birth for the foreign-born population - Peru (%)
Place of birth for the foreign-born population - Uruguay (%)
Place of birth for the foreign-born population - Venezuela (%)
Place of birth for the foreign-born population - Other South America (%)
Place of birth for the foreign-born population - Canada (%)
Place of birth for the foreign-born population - Other Northern America (%)
Place of birth for the foreign-born population - Other (%)
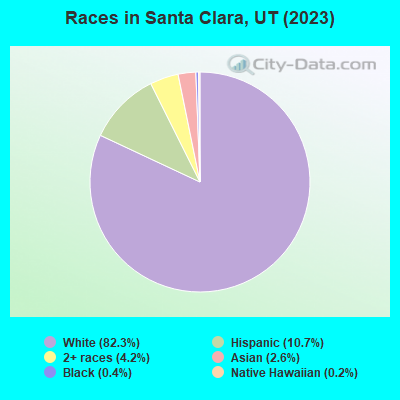
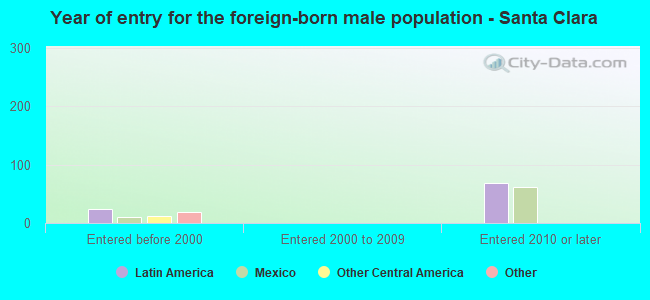
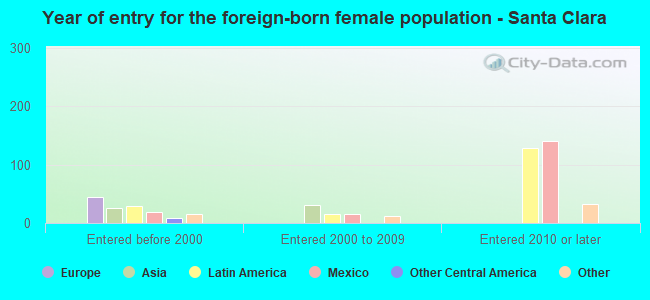
According to 2022 data, the most numerous races in Santa Clara, UT are White alone (6,569 residents), Hispanic (984 residents), and Two or more races (435 residents). 87.1% of Santa Clara residents speak English at home. 5.2% of Santa Clara, UT residents are foreign-born (2.8% born in Latin America, 0.7% born in Asia, 0.7% born in Europe), which is 54.1% less than the foreign-born rate of 8.0% across the entire state of Utah.
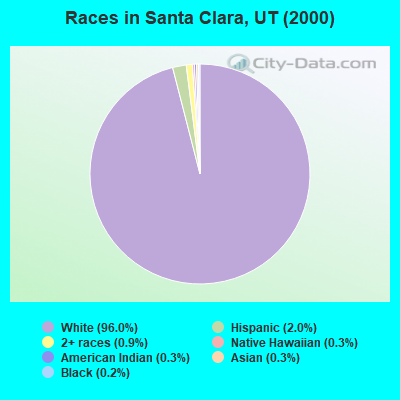
Race distribution in Santa Clara
2000 2022
1,904,265 85.3% White alone 201,559 9.0% Hispanic 36,483 1.6% Asian alone 31,308 1.4% Two or more races 26,663 1.2% American Indian alone 14,806 0.7% Native Hawaiian and Other 16,137 0.7% Black alone 1,948 0.09% Other race alone
2,557,466 75.6% White alone 512,086 15.1% Hispanic 119,308 3.5% Two or more races 82,388 2.4% Asian alone 36,978 1.1% Native Hawaiian and Other 34,873 1.0% Black alone 22,803 0.7% American Indian alone 14,898 0.4% Other race alone
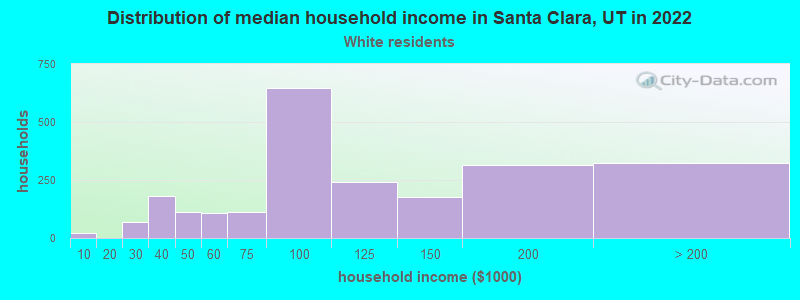
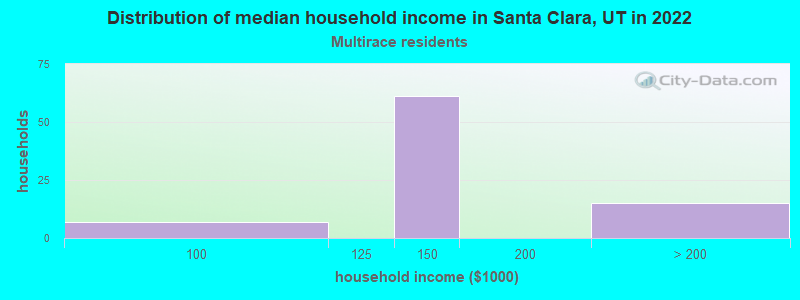
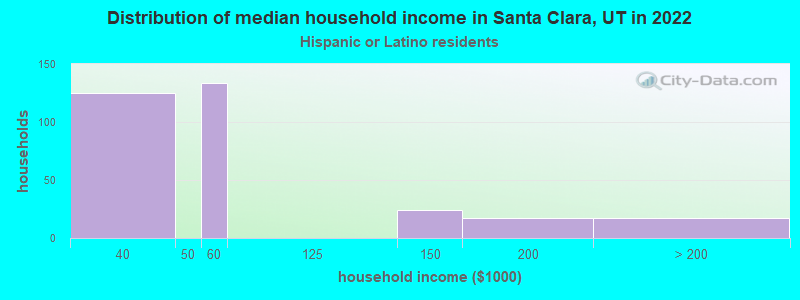
Income and house value in Santa Clara Median household income in 2022 $93,266 White non-Hispanic householders$139,077 Two or more races householders$49,718 Hispanic or Latino race householdersMedian 2022 house value $586,786 White Non-Hispanic householders$704,820 Black or African American householders$845,784 American Indian or Alaska Native householders $704,820 Asian householders$704,820 Native Hawaiian and other Pacific Islander householders$610,844 Some other race householders$516,868 Two or more races householders$571,750 Hispanic or Latino householders
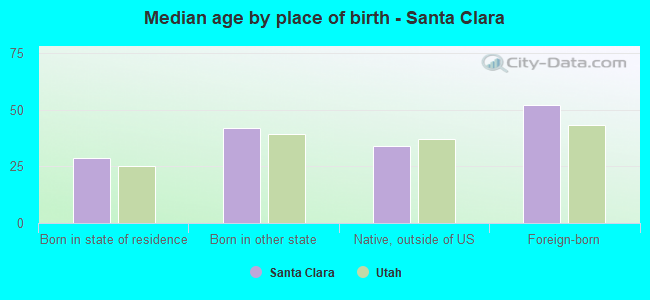
Median age by race in Santa Clara
38.0 Median age for White residents34.4 40.5 28.2 Median age for Black or African American residents-620,437,955.6 30.2 -1,158,576,050.6 Median age for American Indian / Alaska Native residents-1,148,717,947.6 -1,193,333,332.1 22.0 Median age for Asian residents-456,303,170.5 21.7 -1,032,597,265.0 Median age for Native Hawaiian / Pacific Islander residents-1,433,333,331.9 -668,354,429.7 30.3 Median age for Other race residents29.6 -945,412,310.3 18.9 Median age for Two or more races residents18.2 19.9 38.4 Median age for White alone residents33.7 41.0 24.2 Median age for Hispanic or Latino residents23.8 27.7
Owner/renter occupied households by race in Santa Clara
House owners and renters - White residents 1,998 84.3% Owner occupied373 15.7% Renter occupiedHouse owners and renters - Asian residents 26 100.0% Owner occupiedHouse owners and renters - Native Hawaiian / Pacific Islander residents 26 100.0% Owner occupiedHouse owners and renters - Other race residents 116 100.0% Renter occupiedHouse owners and renters - Two or more races residents 109 100.0% Owner occupiedHouse owners and renters - White alone residents 1,963 87.1% Owner occupied291 12.9% Renter occupiedHouse owners and renters - Hispanic or Latino residents 105 33.9% Owner occupied204 66.1% Renter occupied
Language usage in Santa Clara
English speakers - Total 87.1% of residents of Santa Clara speak English at home.
10.5% of residents speak Spanish at home 347 42.0% Speak English very well479 58.0% Speak English less than very well2.7% of residents speak other language at home 141 66.2% Speak English very well72 33.8% Speak English less than very well
English speakers - Born in the United States 95.0% of residents of Santa Clara speak English at home.
3.1% of residents speak Spanish at home 96 100.0% Speak English very well1.3% of residents speak other language at home 40 100.0% Speak English very well
English speakers - Native, born elsewhere 30.8% of residents of Santa Clara speak English at home.
80.3% of residents speak Spanish at home 4 1.7% Speak English very well228 98.3% Speak English less than very well
English speakers - Foreign-born 41.2% of residents of Santa Clara speak English at home.
50.5% of residents speak Spanish at home 18 7.2% Speak English very well232 92.8% Speak English less than very well18.6% of residents speak other language at home 49 53.3% Speak English very well43 46.7% Speak English less than very well
White (Caucasian) - Speak only English Native:
96.1% (6,043)Foreign-born:
82.0% (177)
White (Caucasian) - Speak another language Native:
3.6% (225)Foreign-born:
34.4% (75)
Native Hawaiian / Pacific Islander - Speak only English Native:
93.7% (13)Foreign-born:
74.0% (15)
Two or more races - Speak another language Native:
11.5% (88)Foreign-born:
100.0% (57)
White alone - Speak only English Native:
96.0% (5,946)Foreign-born:
100.0% (130)
Hispanic or Latino - Speak only English Native:
32.8% (201)Foreign-born:
7.1% (18)
Hispanic or Latino - Speak another language Native:
74.0% (453)Foreign-born:
84.8% (219)
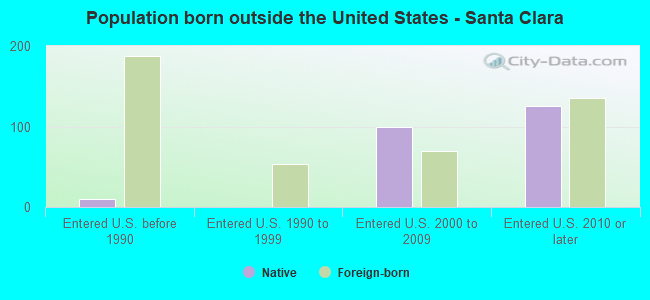
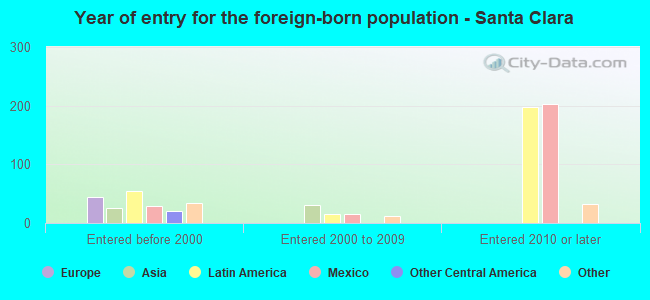
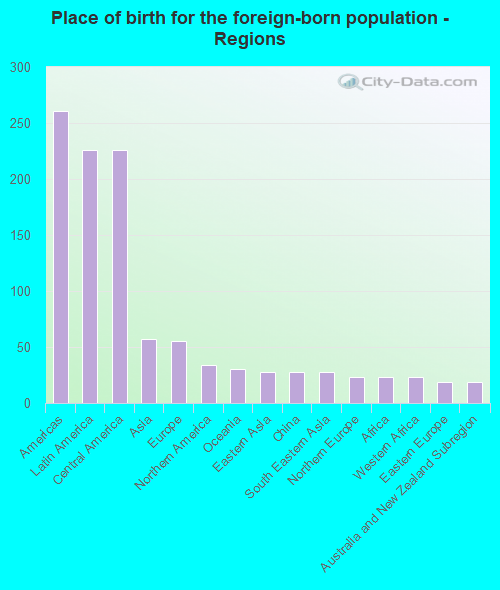
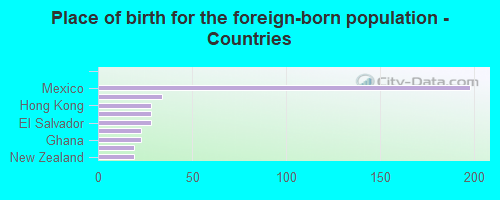
Foreign-born residents in Santa Clara 427 residents are foreign born (2.8% Latin America , 0.7% Asia , 0.7% Europe ).
Marital status for residents in Santa Clara Marital status - White (Caucasian) population 15 years and over
Males 15.3% Never married76.8% Now married0.0% Separated2.0% Widowed6.0% DivorcedFemales 16.9% Never married71.7% Now married0.0% Separated4.8% Widowed6.6% DivorcedWomen who gave birth in the past 12 months Now married:
100.0% (66)Unmarried:
0.0% (0)
Women who did not give birth in the past 12 months Now married:
69.0% (941)Unmarried:
31.0% (424)
Marital status - Other race population 15 years and over
Males 0.0% Never married100.0% Now married0.0% Separated0.0% Widowed0.0% DivorcedFemales 0.0% Never married100.0% Now married0.0% Separated0.0% Widowed0.0% DivorcedWomen who did not give birth in the past 12 months Now married:
100.0% (138)Unmarried:
0.0% (0)
Marital status - Two or more races population 15 years and over
Males 84.2% Never married15.8% Now married0.0% Separated0.0% Widowed0.0% DivorcedFemales 70.0% Never married30.0% Now married0.0% Separated0.0% Widowed0.0% DivorcedWomen who did not give birth in the past 12 months Now married:
12.6% (32)Unmarried:
87.4% (220)
Marital status - White alone, not Hispanic / Latino population 15 years and over
Males 16.0% Never married76.5% Now married0.0% Separated1.1% Widowed6.3% DivorcedFemales 16.8% Never married70.7% Now married0.0% Separated5.3% Widowed7.2% DivorcedWomen who gave birth in the past 12 months Now married:
100.0% (52)Unmarried:
0.0% (0)
Women who did not give birth in the past 12 months Now married:
67.3% (822)Unmarried:
32.7% (400)
Marital status - Hispanic or Latino population 15 years and over
Males 4.3% Never married87.1% Now married0.0% Separated8.6% Widowed0.0% DivorcedFemales 27.2% Never married72.8% Now married0.0% Separated0.0% Widowed0.0% DivorcedWomen who gave birth in the past 12 months Now married:
100.0% (15)Unmarried:
0.0% (0)
Women who did not give birth in the past 12 months Now married:
69.4% (259)Unmarried:
30.6% (114)
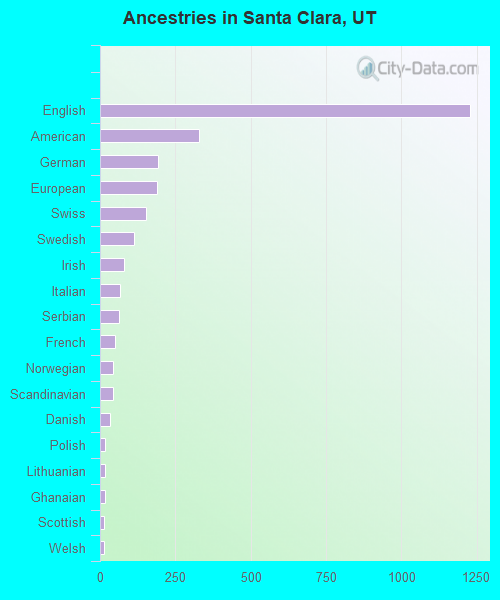
Ancestries in Santa Clara
1,229 33.0% English329 8.8% American191 5.1% German188 5.1% European153 4.1% Swiss112 3.0% Swedish78 2.1% Irish67 1.8% Italian62 1.7% Serbian51 1.4% French43 1.2% Norwegian42 1.1% Scandinavian33 0.9% Danish18 0.5% Polish17 0.5% Lithuanian16 0.4% Ghanaian14 0.4% Scottish12 0.3% Welsh9 0.2% British
Children Nativity (place of birth) in Santa Clara
Children under 6 years - Living with two parents Both parents native 357 100.0% NativeBoth parents foreign-born 75 100.0% NativeOne native, one foreign-born parent 30 100.0% Native
Children 6 to 17 years - Living with two parents Both parents native 1,261 100.0% NativeOne native, one foreign-born parent 263 100.0% NativeChildren 6 to 17 years - Living with one parent Native parent 49 100.0% Native
Grandparents responsible for own grandchildren in Santa Clara
Grandparents (30 to 59 years) White / Caucasian 49 100.0% Not responsible for grandchildrenWhite alone, not Hispanic / Latino 50 100.0% Not responsible for grandchildren
Grandparents (60 years and over) White / Caucasian 13 100.0% Not responsible for grandchildrenWhite alone, not Hispanic / Latino 13 100.0% Not responsible for grandchildren