Races in Santaquin, Utah (UT) Detailed Stats
Ancestries, Foreign-born residents, place of birth
Settings
X


Recent posts about races in Santaquin, Utah on our local forum with over 2,400,000 registered users:
 | Power Plant Eyesore in Vineyard (59 replies) |
| What will happen when the Wasatch Front runs out of buildable land? (19 replies) |
| Where to buy in the SLT area for young couple? (4 replies) |
| Single mom looking for low income housing (not public housing) (5 replies) |
| Mona UT ? possible relocation from Arkansas (5 replies) |
| Small town lady moving to around Orem (16 replies) |
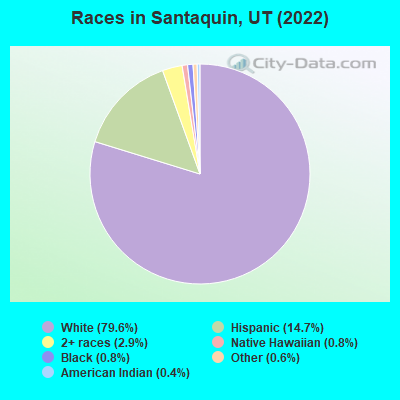
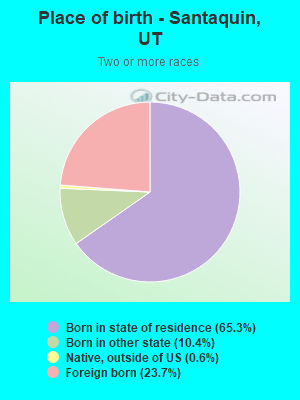
According to 2022 data, the most numerous races in Santaquin, UT are White alone (12,148 residents), Hispanic (2,238 residents), and Two or more races (437 residents). 88.2% of Santaquin residents speak English at home. 3.5% of Santaquin, UT residents are foreign-born (3.0% born in Latin America), which is 129.0% less than the foreign-born rate of 8.0% across the entire state of Utah.
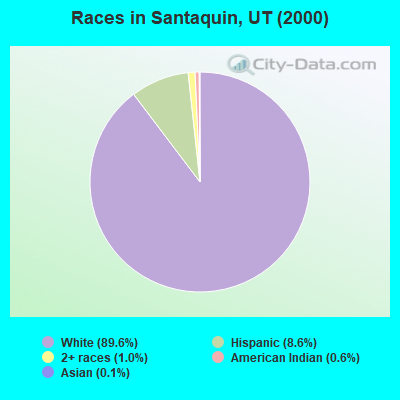
Race distribution in Santaquin
2000
2022

- 4,33189.6%White alone
- 4148.6%Hispanic
- 471.0%Two or more races
- 300.6%American Indian alone
- 50.1%Asian alone
- 30.06%Native Hawaiian and Other
Pacific Islander alone - 30.06%Black alone
- 10.02%Other race alone
-
- 12,14879.6%White alone
- 2,23814.7%Hispanic
- 4372.9%Two or more races
- 1230.8%Native Hawaiian and Other
Pacific Islander alone - 1210.8%Black alone
- 940.6%Other race alone
- 670.4%American Indian alone
- 140.09%Asian alone
2000
2022
-
- 1,904,26585.3%White alone
- 201,5599.0%Hispanic
- 36,4831.6%Asian alone
- 31,3081.4%Two or more races
- 26,6631.2%American Indian alone
- 14,8060.7%Native Hawaiian and Other
Pacific Islander alone - 16,1370.7%Black alone
- 1,9480.09%Other race alone

-
- 2,557,46675.6%White alone
- 512,08615.1%Hispanic
- 119,3083.5%Two or more races
- 82,3882.4%Asian alone
- 36,9781.1%Native Hawaiian and Other
Pacific Islander alone - 34,8731.0%Black alone
- 22,8030.7%American Indian alone
- 14,8980.4%Other race alone

Income and house value in Santaquin
- Median household income in 2022
- $95,783White non-Hispanic householders
- $96,985Some other race householders
- $89,444Two or more races householders
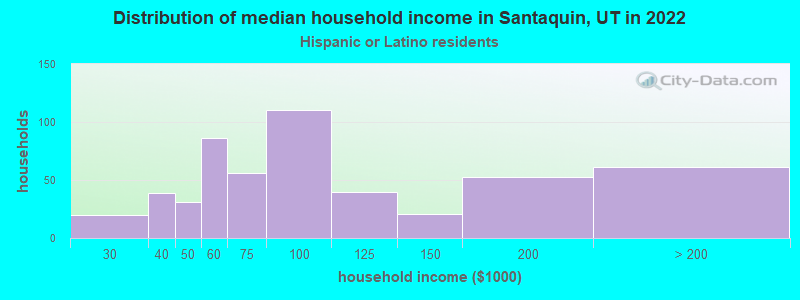
- $80,462Hispanic or Latino race householders
- Median 2022 house value
- $475,892White Non-Hispanic householders
- $436,680American Indian or Alaska Native householders
- $396,042Some other race householders
- $353,978Two or more races householders
- $416,004Hispanic or Latino householders
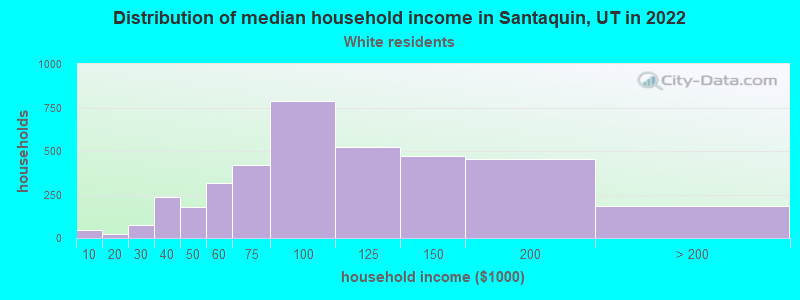
Household income for White non-Hispanic householders
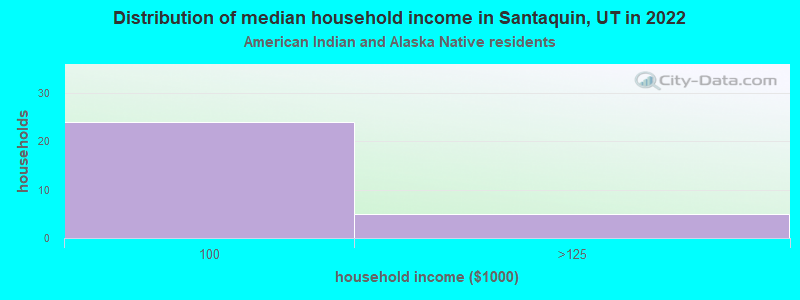
Household income for American Indian and Alaska Native householders
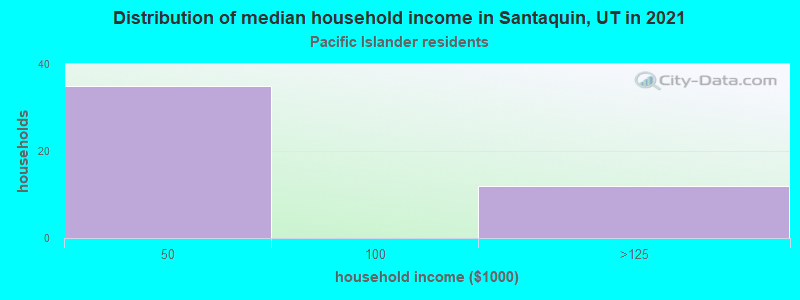
Household income for Native Hawaiian and other Pacific Islander householders
Household income for Some other race householders
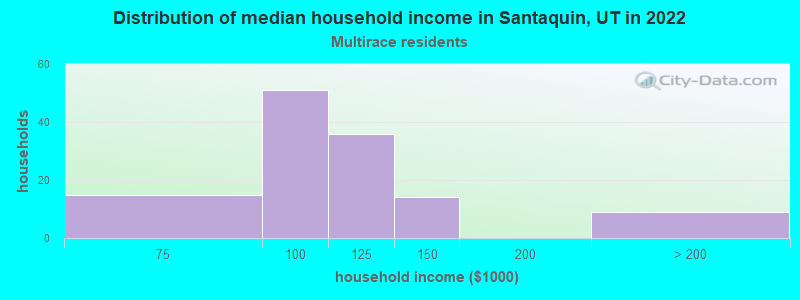
Household income for Two or more races householders
Household income for Hispanic or Latino race householders
Median age by race in Santaquin
- 27.5Median age for White residents
- 26.1Males
- 28.6Females
- 11.1Median age for Black or African American residents
- 10.0Males
- -640,650,405.9Females
- 44.1Median age for American Indian / Alaska Native residents
- -649,572,648.9Males
- 46.5Females
- -680,555,554.9Median age for Asian residents
- -702,020,201.3Males
- -674,974,038.8Females
- 23.3Median age for Native Hawaiian / Pacific Islander residents
- 50.7Males
- 22.4Females
- 19.0Median age for Other race residents
- 13.2Males
- 32.3Females
- 15.8Median age for Two or more races residents
- 13.7Males
- 35.1Females
- 28.0Median age for White alone residents
- 26.1Males
- 29.3Females
- 23.0Median age for Hispanic or Latino residents
- 23.3Males
- 22.7Females
Owner/renter occupied households by race in Santaquin
- House owners and renters - White residents
- 3,27388.9%Owner occupied
- 40911.1%Renter occupied
- House owners and renters - American Indian / Alaska Native residents
- 27100.0%Owner occupied
- House owners and renters - Native Hawaiian / Pacific Islander residents
- 3760.0%Owner occupied
- 2540.0%Renter occupied
- House owners and renters - Other race residents
- 10452.6%Owner occupied
- 9347.4%Renter occupied
- House owners and renters - Two or more races residents
- 14094.8%Owner occupied
- 85.2%Renter occupied
- House owners and renters - White alone residents
- 3,09490.0%Owner occupied
- 34510.0%Renter occupied
- House owners and renters - Hispanic or Latino residents
- 36671.8%Owner occupied
- 14428.2%Renter occupied
Language usage in Santaquin
- English speakers - Total
- 88.2% of residents of Santaquin speak English at home.
- 9.8% of residents speak Spanish at home
- 96773.0%Speak English very well
- 35727.0%Speak English less than very well
- 1.5% of residents speak other language at home
- 16984.5%Speak English very well
- 3115.5%Speak English less than very well
- English speakers - Born in the United States
- 89.6% of residents of Santaquin speak English at home.
- 9.4% of residents speak Spanish at home
- 16566.5%Speak English very well
- 8333.5%Speak English less than very well
- 0.8% of residents speak other language at home
- 20100.0%Speak English very well
- English speakers - Native, born elsewhere
- 82.4% of residents of Santaquin speak English at home.
- 17.6% of residents speak Spanish at home
- 16100.0%Speak English very well
- English speakers - Foreign-born
- 2.5% of residents of Santaquin speak English at home.
- 76.7% of residents speak Spanish at home
- 18646.0%Speak English very well
- 21854.0%Speak English less than very well
- 17.3% of residents speak other language at home
- 7380.2%Speak English very well
- 1819.8%Speak English less than very well
White (Caucasian) - Speak only English
| Native: | 95.6% (11,043) |
| Foreign-born: | 10.6% (11) |
White (Caucasian) - Speak another language
| Native: | 4.7% (542) |
| Foreign-born: | 74.1% (75) |
Other race - Speak another language
| Native: | 67.6% (586) |
| Foreign-born: | 100.0% (245) |
Two or more races - Speak another language
| Native: | 7.1% (30) |
| Foreign-born: | 100.0% (181) |
White alone - Speak only English
| Native: | 96.7% (10,476) |
| Foreign-born: | 14.8% (5) |
White alone - Speak another language
| Native: | 3.3% (359) |
| Foreign-born: | 74.2% (25) |
Hispanic or Latino - Speak only English
| Native: | 55.7% (845) |
| Foreign-born: | 1.2% (5) |
Hispanic or Latino - Speak another language
| Native: | 44.3% (673) |
| Foreign-born: | 100.0% (400) |
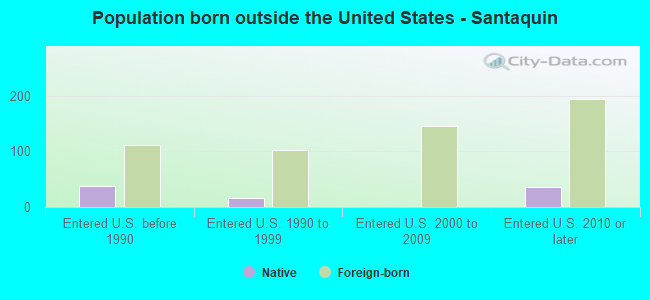
Foreign-born residents in Santaquin
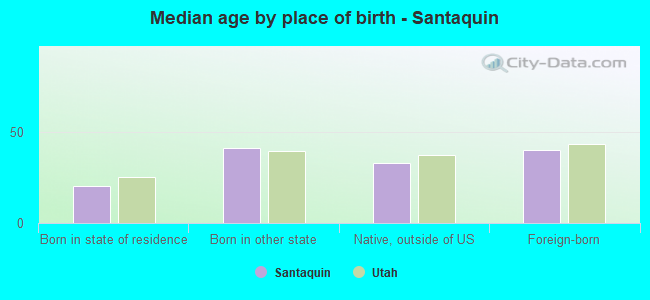
533 residents are foreign born (3.0% Latin America).
| This city: | 3.5% |
| Utah: | 8.4% |


Marital status for residents in Santaquin
Marital status - White (Caucasian) population 15 years and over
- Males
- 28.9%Never married
- 66.5%Now married
- 0.3%Separated
- 0.3%Widowed
- 3.9%Divorced
- Females
- 22.3%Never married
- 64.7%Now married
- 0.3%Separated
- 5.7%Widowed
- 7.0%Divorced
Women who gave birth in the past 12 months
| Now married: | 79.9% (315) |
| Unmarried: | 20.1% (79) |
Women who did not give birth in the past 12 months
| Now married: | 63.4% (1,766) |
| Unmarried: | 36.6% (1,018) |
Marital status - Black or African American population 15 years and over
- Males
- 0.0%Never married
- 100.0%Now married
- 0.0%Separated
- 0.0%Widowed
- 0.0%Divorced
- Females
- 100.0%Never married
- 0.0%Now married
- 0.0%Separated
- 0.0%Widowed
- 0.0%Divorced
Women who did not give birth in the past 12 months
| Now married: | 0.0% (0) |
| Unmarried: | 100.0% (31) |
Marital status - American Indian / Alaska Native population 15 years and over
- Males
- 0.0%Never married
- 87.9%Now married
- 0.0%Separated
- 12.1%Widowed
- 0.0%Divorced
- Females
- 10.5%Never married
- 89.5%Now married
- 0.0%Separated
- 0.0%Widowed
- 0.0%Divorced
Women who did not give birth in the past 12 months
| Now married: | 100.0% (23) |
| Unmarried: | 0.0% (0) |
Marital status - Native Hawaiian / Pacific Islander population 15 years and over
- Males
- 16.7%Never married
- 83.3%Now married
- 0.0%Separated
- 0.0%Widowed
- 0.0%Divorced
- Females
- 75.9%Never married
- 0.0%Now married
- 0.0%Separated
- 0.0%Widowed
- 24.1%Divorced
Women who did not give birth in the past 12 months
| Now married: | 0.0% (0) |
| Unmarried: | 100.0% (67) |
Marital status - Other race population 15 years and over
- Males
- 33.6%Never married
- 60.7%Now married
- 0.0%Separated
- 0.0%Widowed
- 5.7%Divorced
- Females
- 21.3%Never married
- 78.7%Now married
- 0.0%Separated
- 0.0%Widowed
- 0.0%Divorced
Women who did not give birth in the past 12 months
| Now married: | 73.9% (250) |
| Unmarried: | 26.1% (88) |
Marital status - Two or more races population 15 years and over
- Males
- 37.1%Never married
- 62.9%Now married
- 0.0%Separated
- 0.0%Widowed
- 0.0%Divorced
- Females
- 17.2%Never married
- 62.6%Now married
- 0.0%Separated
- 9.2%Widowed
- 10.9%Divorced
Women who gave birth in the past 12 months
| Now married: | 100.0% (17) |
| Unmarried: | 0.0% (0) |
Women who did not give birth in the past 12 months
| Now married: | 71.7% (98) |
| Unmarried: | 28.3% (39) |
Marital status - White alone, not Hispanic / Latino population 15 years and over
- Males
- 29.0%Never married
- 66.7%Now married
- 0.4%Separated
- 0.4%Widowed
- 3.5%Divorced
- Females
- 20.6%Never married
- 65.3%Now married
- 0.1%Separated
- 6.3%Widowed
- 7.7%Divorced
Women who gave birth in the past 12 months
| Now married: | 79.9% (324) |
| Unmarried: | 20.1% (82) |
Women who did not give birth in the past 12 months
| Now married: | 64.3% (1,625) |
| Unmarried: | 35.7% (902) |
Marital status - Hispanic or Latino population 15 years and over
- Males
- 27.1%Never married
- 66.0%Now married
- 0.0%Separated
- 0.0%Widowed
- 7.0%Divorced
- Females
- 34.0%Never married
- 65.1%Now married
- 0.9%Separated
- 0.0%Widowed
- 0.0%Divorced
Women who did not give birth in the past 12 months
| Now married: | 60.3% (376) |
| Unmarried: | 39.7% (248) |
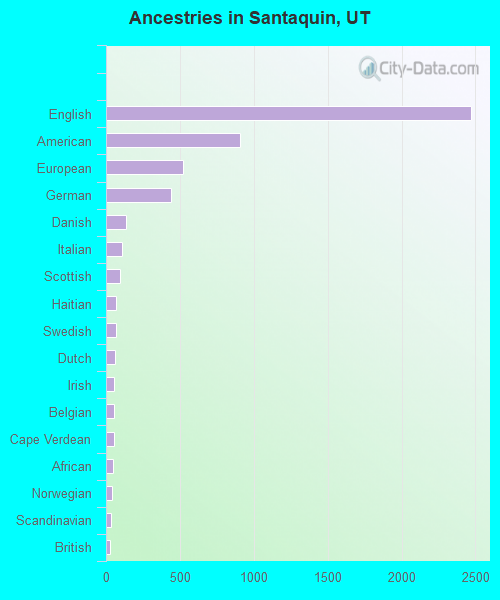
Ancestries in Santaquin

- 2,46834.1%English
- 90512.5%American
- 5217.2%European
- 4376.0%German
- 1351.9%Danish
- 1071.5%Italian
- 981.4%Scottish
- 680.9%Haitian
- 660.9%Swedish
- 640.9%Dutch
- 530.7%Irish
- 510.7%Belgian
- 510.7%Cape Verdean
- 440.6%African
- 430.6%Norwegian
- 350.5%Scandinavian
- 300.4%British
- 210.3%French
- 190.3%Northern European
- 100.1%Swiss
- 70.10%Greek
- 60.08%Icelander
- 30.04%Polish
- 20.03%Eastern European
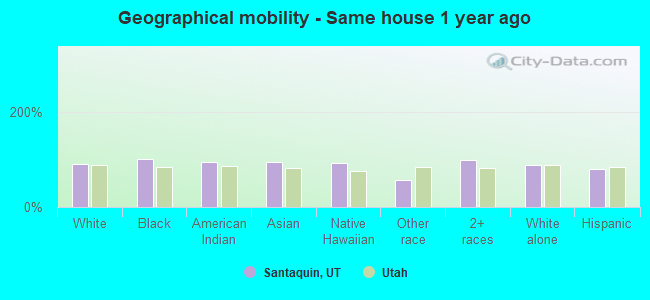
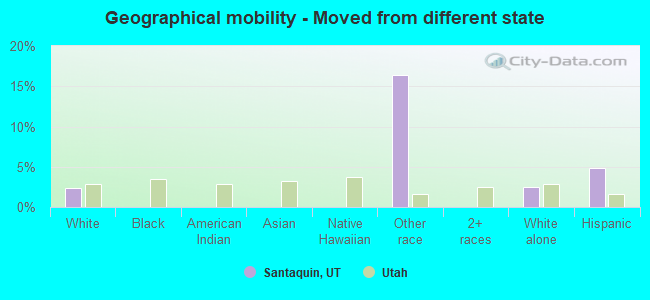
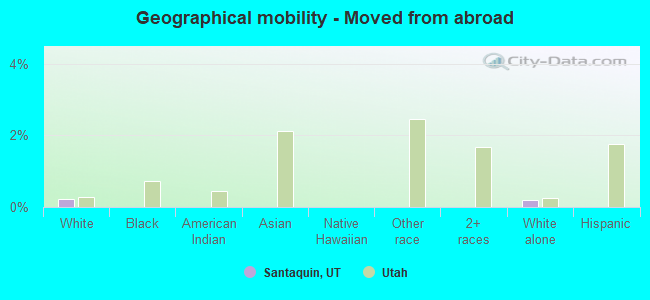
Geographical mobility in Santaquin

- Same house 1 year ago
- 11,19089.5%White (Caucasian)
- 110100.0%Black or African American
- 7194.6%American Indian / Alaska Native
- 1494.4%Asian
- 10192.6%Native Hawaiian / Pacific Islander
- 79957.4%Other race
- 71399.5%Two or more races
- 10,50588.9%White alone, not Hispanic / Latino
- 1,75979.6%Hispanic or Latino
-
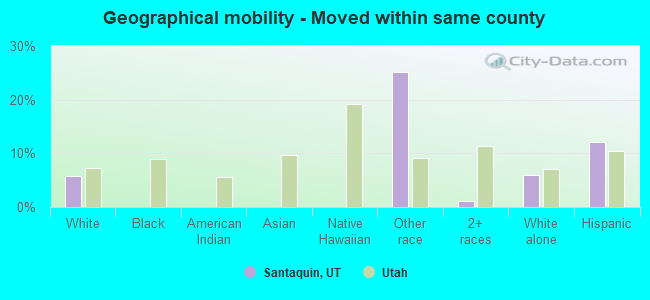
- Moved within same county
- 7145.7%White / Caucasian
- 35225.2%Other race
- 81.1%Two or more races
- 7025.9%White alone, not Hispanic / Latino
- 26812.1%Hispanic or Latino
-
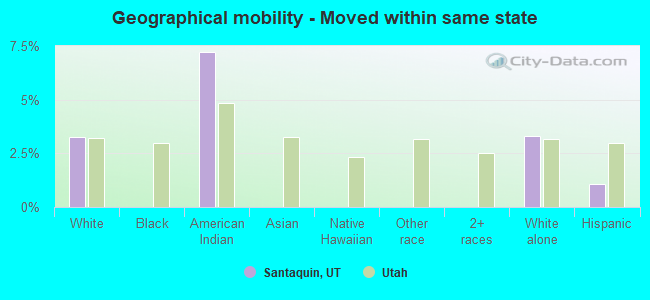
- Moved within same state
- 4083.3%White / Caucasian
- 57.2%American Indian / Alaska Native
- 3913.3%White alone, not Hispanic / Latino
- 241.1%Hispanic or Latino
-
- Moved from different state
- 2892.3%White / Caucasian
- 22816.4%Other race
- 3002.5%White alone, not Hispanic / Latino
- 1064.8%Hispanic or Latino
-
- Moved from abroad
- 270.2%White
- 250.2%White alone, not Hispanic / Latino
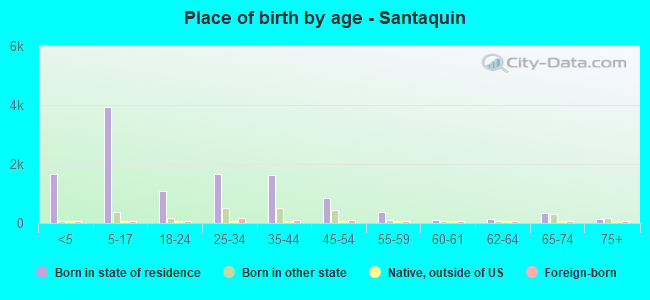
Children Nativity (place of birth) in Santaquin
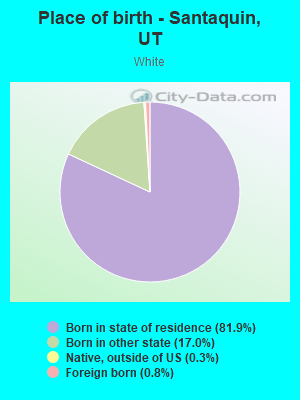
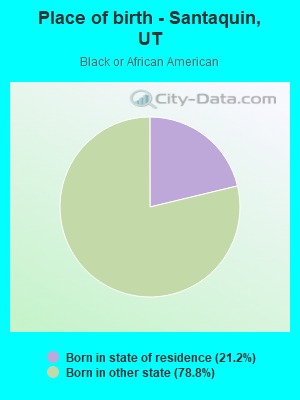
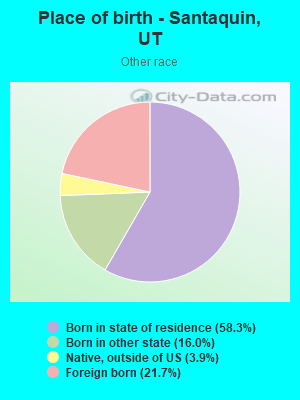
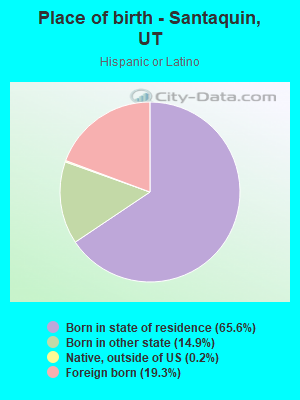
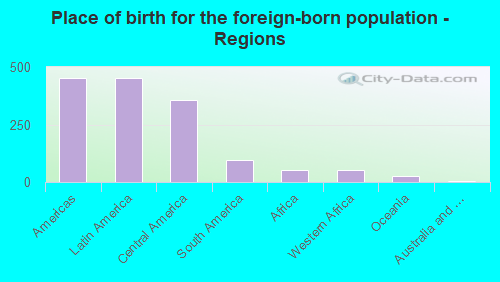
Place of birth for residents in Santaquin
![Place of birth for the foreign-born population - Regions]()
- 453Americas
- 453Latin America
- 355Central America
- 97South America
- 54Africa
- 54Western Africa
- 26Oceania
- 5Australia and New Zealand Subregion
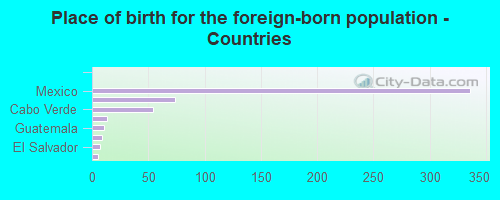
![Place of birth for the foreign-born population - Countries]()
- 336Mexico
- 74Peru
- 54Cabo Verde
- 13Brazil
- 11Guatemala
- 9Bolivia
- 7El Salvador
- 5Australia
Grandparents responsible for own grandchildren in Santaquin
Zip codes: 84655.