Races in Sapulpa, Oklahoma (OK) Detailed Stats
Data:
Races - White alone (%)
Races - White alone (% change since 2000)
Races - Black alone (%)
Races - Black alone (% change since 2000)
Races - American Indian alone (%)
Races - American Indian alone (% change since 2000)
Races - Asian alone (%)
Races - Asian alone (% change since 2000)
Races - Hispanic (%)
Races - Hispanic (% change since 2000)
Races - Native Hawaiian and Other Pacific Islander alone (%)
Races - Native Hawaiian and Other Pacific Islander alone (% change since 2000)
Races - Two or more races(%)
Races - Two or more races(% change since 2000)
Races - Other race alone (%)
Races - Other race alone (% change since 2000)
Racial diversity
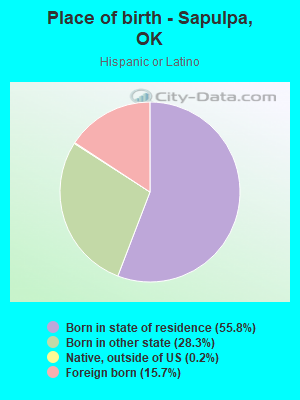
Place of birth - Born in state of residence (%)
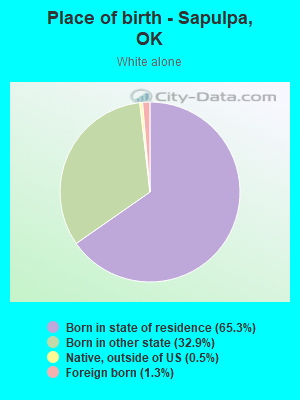
Place of birth - Born in state of residence (%) - White
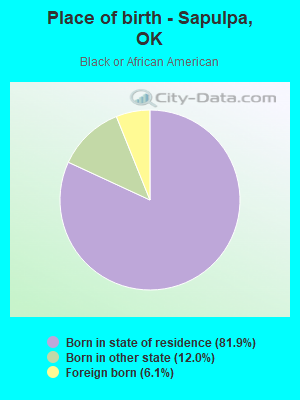
Place of birth - Born in state of residence (%) - Black or African American
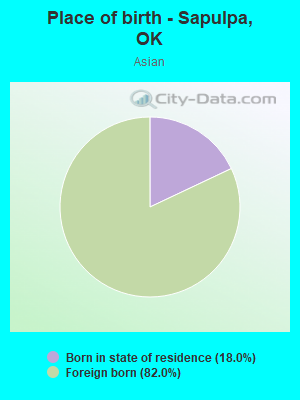
Place of birth - Born in state of residence (%) - Asian
Place of birth - Born in state of residence (%) - Hispanic or Latino
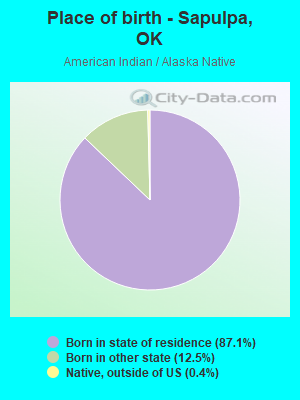
Place of birth - Born in state of residence (%) - American Indian and Alaska Native
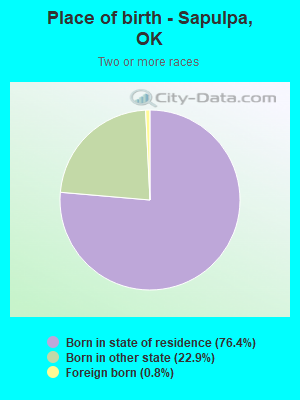
Place of birth - Born in state of residence (%) - Multirace
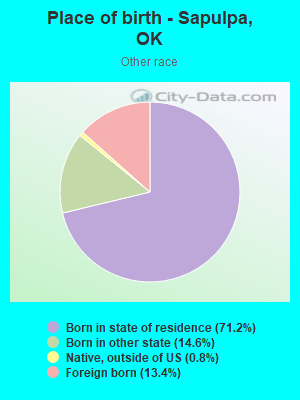
Place of birth - Born in state of residence (%) - Other Race
Place of birth - Born in other state (%)
Place of birth - Born in other state (%) - White
Place of birth - Born in other state (%) - Black or African American
Place of birth - Born in other state (%) - Asian
Place of birth - Born in other state (%) - Hispanic or Latino
Place of birth - Born in other state (%) - American Indian and Alaska Native
Place of birth - Born in other state (%) - Multirace
Place of birth - Born in other state (%) - Other Race
Place of birth - Native, outside of US (%)
Place of birth - Native, outside of US (%) - White
Place of birth - Native, outside of US (%) - Black or African American
Place of birth - Native, outside of US (%) - Asian
Place of birth - Native, outside of US (%) - Hispanic or Latino
Place of birth - Native, outside of US (%) - American Indian and Alaska Native
Place of birth - Native, outside of US (%) - Multirace
Place of birth - Native, outside of US (%) - Other Race
Place of birth - Foreign born (%)
Place of birth - Foreign born (%) - White
Place of birth - Foreign born (%) - Black or African American
Place of birth - Foreign born (%) - Asian
Place of birth - Foreign born (%) - Hispanic or Latino
Place of birth - Foreign born (%) - American Indian and Alaska Native
Place of birth - Foreign born (%) - Multirace
Place of birth - Foreign born (%) - Other Race
Residents speaking English at home (%)
Residents speaking English at home - Born in the United States (%)
Residents speaking English at home - Native, born elsewhere (%)
Residents speaking English at home - Foreign born (%)
Residents speaking Spanish at home (%)
Residents speaking Spanish at home - Born in the United States (%)
Residents speaking Spanish at home - Native, born elsewhere (%)
Residents speaking Spanish at home - Foreign born (%)
Residents speaking other language at home (%)
Residents speaking other language at home - Born in the United States (%)
Residents speaking other language at home - Native, born elsewhere (%)
Residents speaking other language at home - Foreign born (%)
Marital status - Never married (%)
Marital status - Now married (%)
Marital status - Separated (%)
Marital status - Widowed (%)
Marital status - Divorced (%)
Ancestries Reported - Arab (%)
Ancestries Reported - Czech (%)
Ancestries Reported - Danish (%)
Ancestries Reported - Dutch (%)
Ancestries Reported - English (%)
Ancestries Reported - French (%)
Ancestries Reported - French Canadian (%)
Ancestries Reported - German (%)
Ancestries Reported - Greek (%)
Ancestries Reported - Hungarian (%)
Ancestries Reported - Irish (%)
Ancestries Reported - Italian (%)
Ancestries Reported - Lithuanian (%)
Ancestries Reported - Norwegian (%)
Ancestries Reported - Polish (%)
Ancestries Reported - Portuguese (%)
Ancestries Reported - Russian (%)
Ancestries Reported - Scotch-Irish (%)
Ancestries Reported - Scottish (%)
Ancestries Reported - Slovak (%)
Ancestries Reported - Subsaharan African (%)
Ancestries Reported - Swedish (%)
Ancestries Reported - Swiss (%)
Ancestries Reported - Ukrainian (%)
Ancestries Reported - United States (%)
Ancestries Reported - Welsh (%)
Ancestries Reported - West Indian (%)
Ancestries Reported - Other (%)
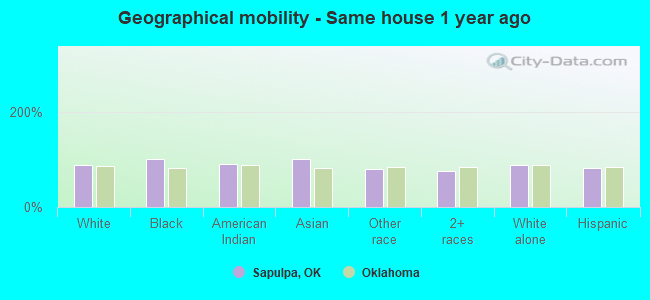
Geographical mobility - Same house 1 year ago (%)
Geographical mobility - Same house 1 year ago (%) - White
Geographical mobility - Same house 1 year ago (%) - Black or African American
Geographical mobility - Same house 1 year ago (%) - Asian
Geographical mobility - Same house 1 year ago (%) - Hispanic or Latino
Geographical mobility - Same house 1 year ago (%) - American Indian and Alaska Native
Geographical mobility - Same house 1 year ago (%) - Multirace
Geographical mobility - Same house 1 year ago (%) - Other Race
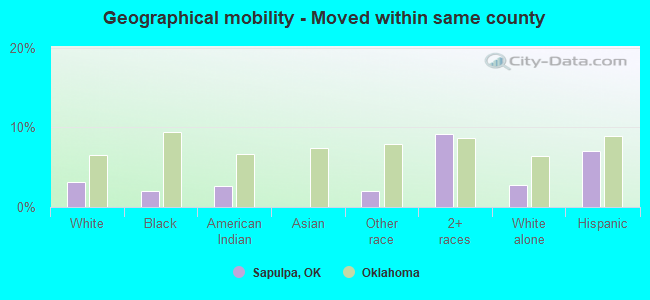
Geographical mobility - Moved within same county (%)
Geographical mobility - Moved within same county (%) - White
Geographical mobility - Moved within same county (%) - Black or African American
Geographical mobility - Moved within same county (%) - Asian
Geographical mobility - Moved within same county (%) - Hispanic or Latino
Geographical mobility - Moved within same county (%) - American Indian and Alaska Native
Geographical mobility - Moved within same county (%) - Multirace
Geographical mobility - Moved within same county (%) - Other Race
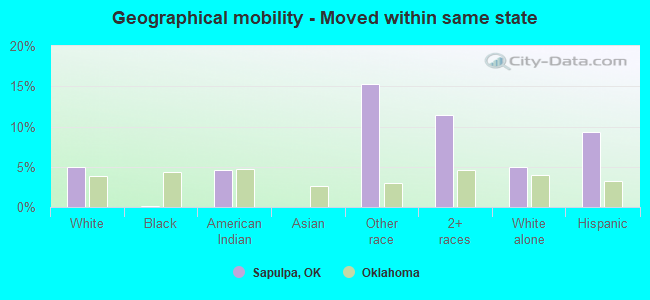
Geographical mobility - Moved from different county within same state (%)
Geographical mobility - Moved from different county within same state (%) - White
Geographical mobility - Moved from different county within same state (%) - Black or African American
Geographical mobility - Moved from different county within same state (%) - Asian
Geographical mobility - Moved from different county within same state (%) - Hispanic or Latino
Geographical mobility - Moved from different county within same state (%) - American Indian and Alaska Native
Geographical mobility - Moved from different county within same state (%) - Multirace
Geographical mobility - Moved from different county within same state (%) - Other Race
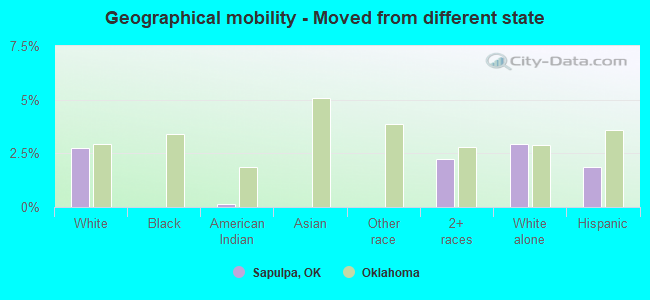
Geographical mobility - Moved from different state (%)
Geographical mobility - Moved from different state (%) - White
Geographical mobility - Moved from different state (%) - Black or African American
Geographical mobility - Moved from different state (%) - Asian
Geographical mobility - Moved from different state (%) - Hispanic or Latino
Geographical mobility - Moved from different state (%) - American Indian and Alaska Native
Geographical mobility - Moved from different state (%) - Multirace
Geographical mobility - Moved from different state (%) - Other Race
Geographical mobility - Moved from abroad (%)
Geographical mobility - Moved from abroad (%) - White
Geographical mobility - Moved from abroad (%) - Black or African American
Geographical mobility - Moved from abroad (%) - Asian
Geographical mobility - Moved from abroad (%) - Hispanic or Latino
Geographical mobility - Moved from abroad (%) - American Indian and Alaska Native
Geographical mobility - Moved from abroad (%) - Multirace
Geographical mobility - Moved from abroad (%) - Other Race
Place of birth for the foreign-born population - Ireland (%)
Place of birth for the foreign-born population - Denmark (%)
Place of birth for the foreign-born population - Norway (%)
Place of birth for the foreign-born population - Sweden (%)
Place of birth for the foreign-born population - United Kingdom (%)
Place of birth for the foreign-born population - England (%)
Place of birth for the foreign-born population - Scotland (%)
Place of birth for the foreign-born population - Other Northern Europe (%)
Place of birth for the foreign-born population - Austria (%)
Place of birth for the foreign-born population - Belgium (%)
Place of birth for the foreign-born population - France (%)
Place of birth for the foreign-born population - Germany (%)
Place of birth for the foreign-born population - Netherlands (%)
Place of birth for the foreign-born population - Switzerland (%)
Place of birth for the foreign-born population - Other Western Europe (%)
Place of birth for the foreign-born population - Greece (%)
Place of birth for the foreign-born population - Italy (%)
Place of birth for the foreign-born population - Portugal (%)
Place of birth for the foreign-born population - Spain (%)
Place of birth for the foreign-born population - Other Southern Europe (%)
Place of birth for the foreign-born population - Albania (%)
Place of birth for the foreign-born population - Belarus (%)
Place of birth for the foreign-born population - Bosnia and Herzegovina (%)
Place of birth for the foreign-born population - Bulgaria (%)
Place of birth for the foreign-born population - Croatia (%)
Place of birth for the foreign-born population - Czechoslovakia (%)
Place of birth for the foreign-born population - Hungary (%)
Place of birth for the foreign-born population - Latvia (%)
Place of birth for the foreign-born population - Lithuania (%)
Place of birth for the foreign-born population - North Macedonia (Macedonia) (%)
Place of birth for the foreign-born population - Moldova (%)
Place of birth for the foreign-born population - Poland (%)
Place of birth for the foreign-born population - Romania (%)
Place of birth for the foreign-born population - Russia (%)
Place of birth for the foreign-born population - Serbia (%)
Place of birth for the foreign-born population - Ukraine (%)
Place of birth for the foreign-born population - Other Eastern Europe (%)
Place of birth for the foreign-born population - China (%)
Place of birth for the foreign-born population - Hong Kong (%)
Place of birth for the foreign-born population - Taiwan (%)
Place of birth for the foreign-born population - Japan (%)
Place of birth for the foreign-born population - Korea (%)
Place of birth for the foreign-born population - Other Eastern Asia (%)
Place of birth for the foreign-born population - Afghanistan (%)
Place of birth for the foreign-born population - Bangladesh (%)
Place of birth for the foreign-born population - India (%)
Place of birth for the foreign-born population - Iran (%)
Place of birth for the foreign-born population - Kazakhstan (%)
Place of birth for the foreign-born population - Nepal (%)
Place of birth for the foreign-born population - Pakistan (%)
Place of birth for the foreign-born population - Sri Lanka (%)
Place of birth for the foreign-born population - Uzbekistan (%)
Place of birth for the foreign-born population - Other South Central Asia (%)
Place of birth for the foreign-born population - Burma (%)
Place of birth for the foreign-born population - Cambodia (%)
Place of birth for the foreign-born population - Indonesia (%)
Place of birth for the foreign-born population - Laos (%)
Place of birth for the foreign-born population - Malaysia (%)
Place of birth for the foreign-born population - Philippines (%)
Place of birth for the foreign-born population - Singapore (%)
Place of birth for the foreign-born population - Thailand (%)
Place of birth for the foreign-born population - Vietnam (%)
Place of birth for the foreign-born population - Other South Eastern Asia (%)
Place of birth for the foreign-born population - Armenia (%)
Place of birth for the foreign-born population - Iraq (%)
Place of birth for the foreign-born population - Israel (%)
Place of birth for the foreign-born population - Jordan (%)
Place of birth for the foreign-born population - Kuwait (%)
Place of birth for the foreign-born population - Lebanon (%)
Place of birth for the foreign-born population - Saudi Arabia (%)
Place of birth for the foreign-born population - Syria (%)
Place of birth for the foreign-born population - Turkey (%)
Place of birth for the foreign-born population - Yemen (%)
Place of birth for the foreign-born population - Other Western Asia (%)
Place of birth for the foreign-born population - Eritrea (%)
Place of birth for the foreign-born population - Ethiopia (%)
Place of birth for the foreign-born population - Kenya (%)
Place of birth for the foreign-born population - Somalia (%)
Place of birth for the foreign-born population - Uganda (%)
Place of birth for the foreign-born population - Zimbabwe (%)
Place of birth for the foreign-born population - Other Eastern Africa (%)
Place of birth for the foreign-born population - Cameroon (%)
Place of birth for the foreign-born population - Congo (%)
Place of birth for the foreign-born population - Democratic Republic of Congo (Zaire) (%)
Place of birth for the foreign-born population - Other Middle Africa (%)
Place of birth for the foreign-born population - Egypt (%)
Place of birth for the foreign-born population - Morocco (%)
Place of birth for the foreign-born population - Sudan (%)
Place of birth for the foreign-born population - Other Northern Africa (%)
Place of birth for the foreign-born population - South Africa (%)
Place of birth for the foreign-born population - Other Southern Africa (%)
Place of birth for the foreign-born population - Cabo Verde (%)
Place of birth for the foreign-born population - Ghana (%)
Place of birth for the foreign-born population - Liberia (%)
Place of birth for the foreign-born population - Nigeria (%)
Place of birth for the foreign-born population - Senegal (%)
Place of birth for the foreign-born population - Sierra Leone (%)
Place of birth for the foreign-born population - Other Western Africa (%)
Place of birth for the foreign-born population - Australia (%)
Place of birth for the foreign-born population - New Zealand (%)
Place of birth for the foreign-born population - Fiji (%)
Place of birth for the foreign-born population - Micronesia (%)
Place of birth for the foreign-born population - Bahamas (%)
Place of birth for the foreign-born population - Barbados (%)
Place of birth for the foreign-born population - Cuba (%)
Place of birth for the foreign-born population - Dominica (%)
Place of birth for the foreign-born population - Dominican Republic (%)
Place of birth for the foreign-born population - Grenada (%)
Place of birth for the foreign-born population - Haiti (%)
Place of birth for the foreign-born population - Jamaica (%)
Place of birth for the foreign-born population - St. Vincent and the Grenadines (%)
Place of birth for the foreign-born population - Trinidad and Tobago (%)
Place of birth for the foreign-born population - West Indies (%)
Place of birth for the foreign-born population - Other Caribbean (%)
Place of birth for the foreign-born population - Belize (%)
Place of birth for the foreign-born population - Costa Rica (%)
Place of birth for the foreign-born population - El Salvador (%)
Place of birth for the foreign-born population - Guatemala (%)
Place of birth for the foreign-born population - Honduras (%)
Place of birth for the foreign-born population - Mexico (%)
Place of birth for the foreign-born population - Nicaragua (%)
Place of birth for the foreign-born population - Panama (%)
Place of birth for the foreign-born population - Other Central America (%)
Place of birth for the foreign-born population - Argentina (%)
Place of birth for the foreign-born population - Bolivia (%)
Place of birth for the foreign-born population - Brazil (%)
Place of birth for the foreign-born population - Chile (%)
Place of birth for the foreign-born population - Colombia (%)
Place of birth for the foreign-born population - Ecuador (%)
Place of birth for the foreign-born population - Guyana (%)
Place of birth for the foreign-born population - Peru (%)
Place of birth for the foreign-born population - Uruguay (%)
Place of birth for the foreign-born population - Venezuela (%)
Place of birth for the foreign-born population - Other South America (%)
Place of birth for the foreign-born population - Canada (%)
Place of birth for the foreign-born population - Other Northern America (%)
Place of birth for the foreign-born population - Other (%)
Latest news about races in Sapulpa, OK collected exclusively by city-data.com from local newspapers, TV, and radio stations
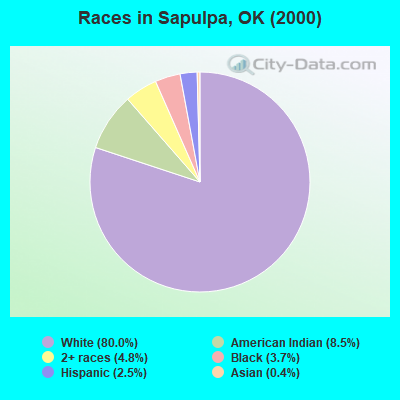
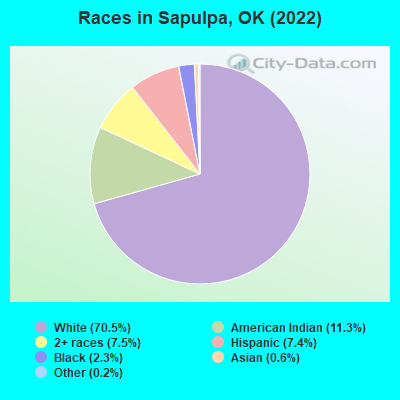
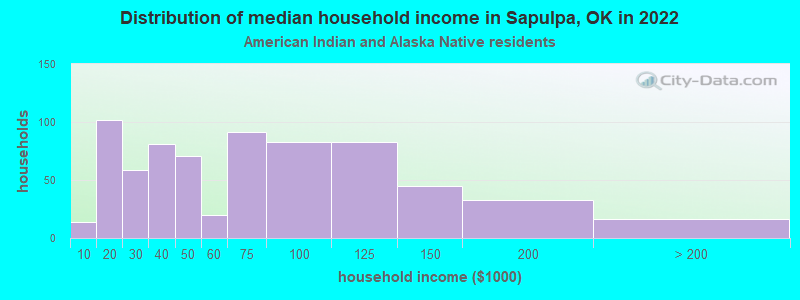
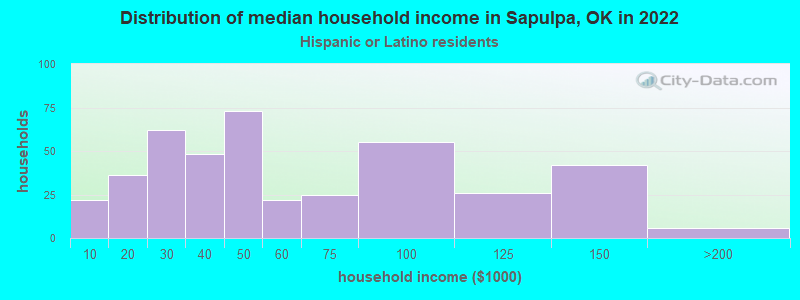
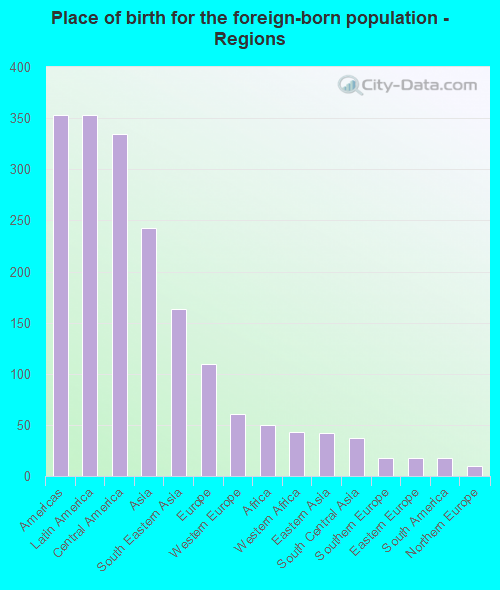
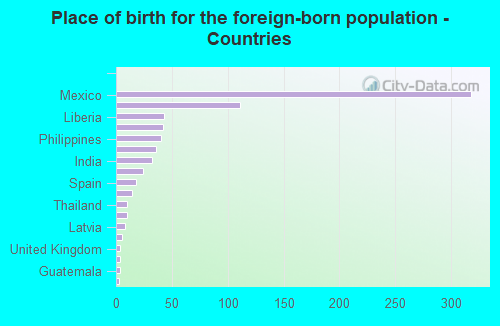
According to 2022 data, the most numerous races in Sapulpa, OK are White alone (15,654 residents), Hispanic (1,643 residents), and Two or more races (1,663 residents). 95.2% of Sapulpa residents speak English at home. 3.4% of Sapulpa, OK residents are foreign-born (1.6% born in Latin America, 1.1% born in Asia, 0.5% born in Europe), which is 75.9% less than the foreign-born rate of 6.0% across the entire state of Oklahoma.
Race distribution in Sapulpa
2000 2022
2,556,368 74.1% White alone 266,158 7.7% American Indian alone 257,981 7.5% Black alone 179,304 5.2% Hispanic 140,249 4.1% Two or more races 46,172 1.3% Asian alone 2,322 0.07% Other race alone 2,100 0.06% Native Hawaiian and Other
2,517,403 62.6% White alone 486,692 12.1% Hispanic 364,453 9.1% Two or more races 273,650 6.8% American Indian alone 268,543 6.7% Black alone 92,672 2.3% Asian alone 10,786 0.3% Other race alone 5,601 0.1% Native Hawaiian and Other
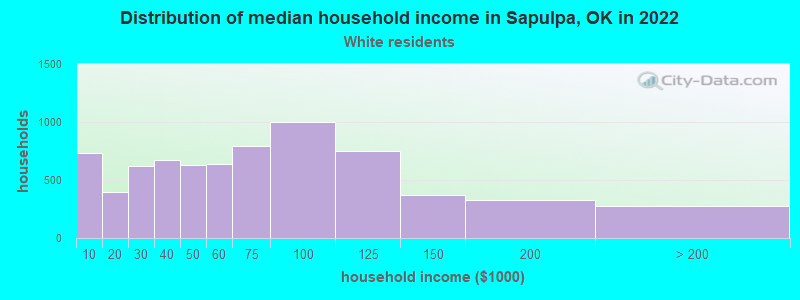
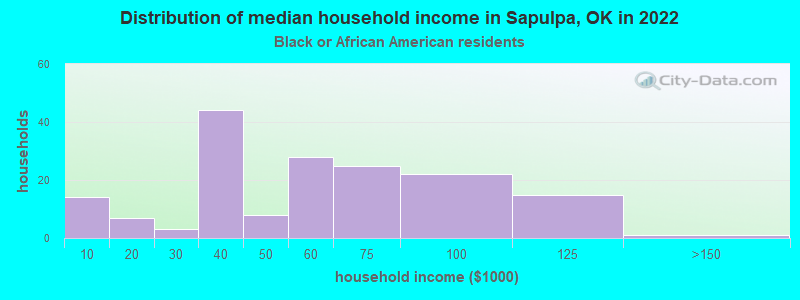
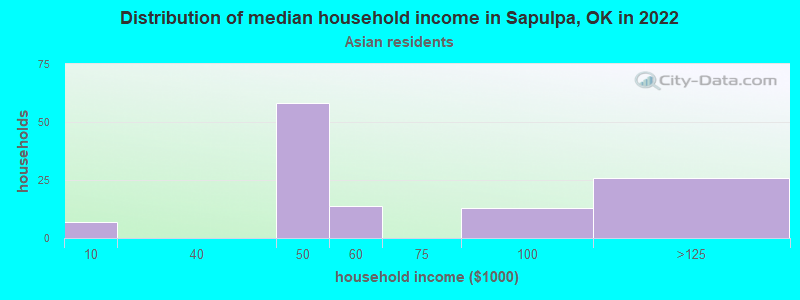
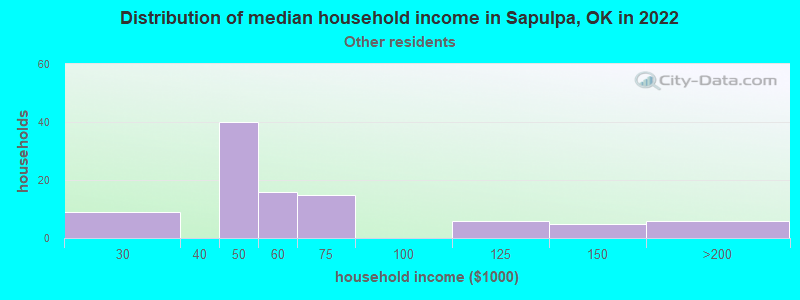
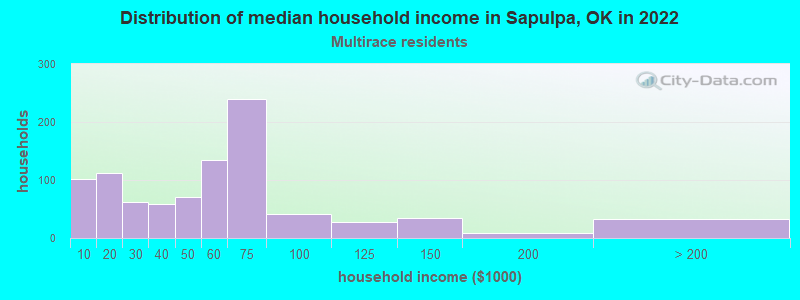
Income and house value in Sapulpa Median household income in 2022 $55,834 White non-Hispanic householders$59,276 Black householders$62,875 American Indian and Alaska Native householders$52,857 Asian householders$58,291 Some other race householders$64,249 Two or more races householders$64,570 Hispanic or Latino race householdersMedian 2022 house value $167,068 White Non-Hispanic householders$89,681 Black or African American householders$154,773 American Indian or Alaska Native householders$90,404 Some other race householders$135,486 Two or more races householders$149,469 Hispanic or Latino householders
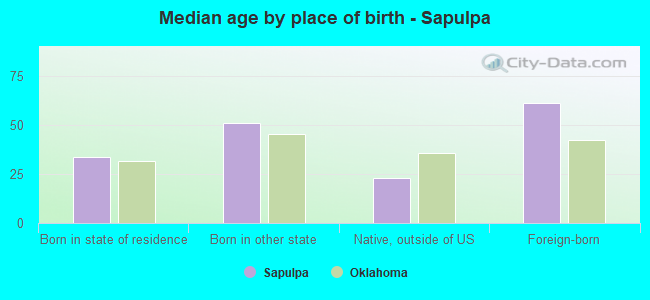
Median age by race in Sapulpa
42.9 Median age for White residents40.3 46.6 47.6 Median age for Black or African American residents14.6 49.6 27.1 Median age for American Indian / Alaska Native residents24.9 33.1 69.5 Median age for Asian residents44.1 89.0 -666,666,666.0 Median age for Native Hawaiian / Pacific Islander residents-666,666,666.0 -666,666,666.0 21.8 Median age for Other race residents29.4 18.8 23.2 Median age for Two or more races residents24.9 22.1 44.4 Median age for White alone residents41.5 47.8 24.2 Median age for Hispanic or Latino residents21.9 29.9
Owner/renter occupied households by race in Sapulpa
House owners and renters - White residents 4,881 66.9% Owner occupied2,420 33.1% Renter occupiedHouse owners and renters - Black or African American residents 75 60.1% Owner occupied50 39.9% Renter occupiedHouse owners and renters - American Indian / Alaska Native residents 447 65.4% Owner occupied236 34.6% Renter occupiedHouse owners and renters - Asian residents 104 95.8% Owner occupied5 4.2% Renter occupiedHouse owners and renters - Other race residents 50 49.8% Owner occupied51 50.2% Renter occupiedHouse owners and renters - Two or more races residents 382 58.9% Owner occupied267 41.1% Renter occupiedHouse owners and renters - White alone residents 4,709 67.0% Owner occupied2,317 33.0% Renter occupiedHouse owners and renters - Hispanic or Latino residents 293 64.8% Owner occupied159 35.2% Renter occupied
Language usage in Sapulpa
English speakers - Total 95.2% of residents of Sapulpa speak English at home.
3.3% of residents speak Spanish at home 459 66.5% Speak English very well231 33.5% Speak English less than very well1.5% of residents speak other language at home 181 57.8% Speak English very well132 42.2% Speak English less than very well
English speakers - Born in the United States 96.1% of residents of Sapulpa speak English at home.
3.4% of residents speak Spanish at home 172 81.9% Speak English very well38 18.1% Speak English less than very well0.1% of residents speak other language at home 9 100.0% Speak English very well
English speakers - Native, born elsewhere 97.6% of residents of Sapulpa speak English at home.
3.5% of residents speak Spanish at home 3 100.0% Speak English very well
English speakers - Foreign-born 31.0% of residents of Sapulpa speak English at home.
59.4% of residents speak Spanish at home 133 36.3% Speak English very well233 63.7% Speak English less than very well45.9% of residents speak other language at home 168 59.4% Speak English very well115 40.6% Speak English less than very well
White (Caucasian) - Speak only English Native:
98.1% (15,018)Foreign-born:
20.7% (96)
White (Caucasian) - Speak another language Native:
1.9% (286)Foreign-born:
78.7% (366)
Black or African American - Speak only English Native:
100.0% (586)Foreign-born:
89.3% (34)
Asian - Speak only English Native:
99.7% (44)Foreign-born:
16.1% (32)
Other race - Speak another language Native:
38.3% (70)Foreign-born:
100.0% (147)
Two or more races - Speak only English Native:
93.8% (1,799)Foreign-born:
23.3% (14)
Two or more races - Speak another language Native:
2.9% (55)Foreign-born:
69.5% (43)
White alone - Speak only English Native:
99.2% (14,624)Foreign-born:
42.1% (87)
White alone - Speak another language Native:
0.7% (107)Foreign-born:
21.8% (45)
Hispanic or Latino - Speak only English Native:
72.9% (885)Foreign-born:
2.1% (5)
Hispanic or Latino - Speak another language Native:
22.7% (276)Foreign-born:
94.8% (244)
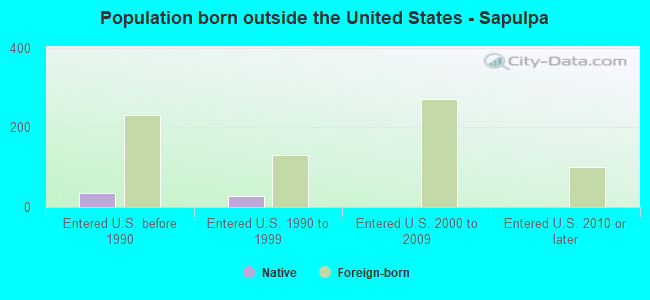
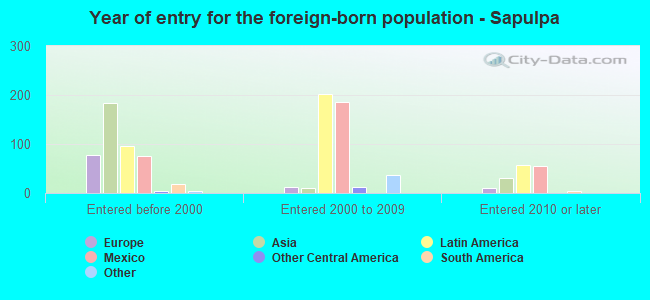
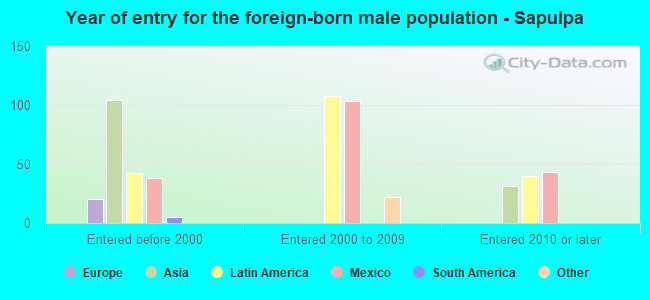
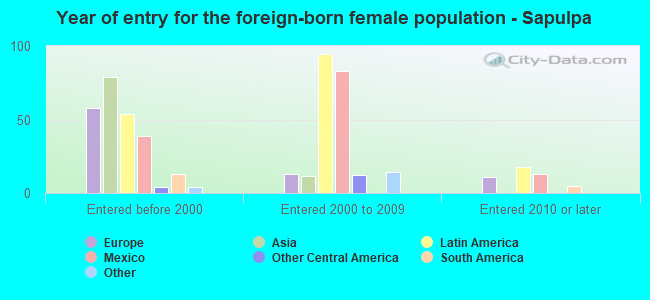
Foreign-born residents in Sapulpa 758 residents are foreign born (1.6% Latin America , 1.1% Asia , 0.5% Europe ).
This city:
3.4%Oklahoma:
6.1%
Marital status for residents in Sapulpa Marital status - White (Caucasian) population 15 years and over
Males 28.1% Never married53.2% Now married1.6% Separated3.2% Widowed14.0% DivorcedFemales 18.5% Never married49.6% Now married2.3% Separated13.1% Widowed16.5% DivorcedWomen who gave birth in the past 12 months Now married:
48.3% (99)Unmarried:
51.7% (106)
Women who did not give birth in the past 12 months Now married:
53.9% (1,748)Unmarried:
46.1% (1,494)
Marital status - Black or African American population 15 years and over
Males 57.7% Never married34.3% Now married0.0% Separated0.0% Widowed8.1% DivorcedFemales 35.0% Never married18.0% Now married3.1% Separated25.5% Widowed18.4% DivorcedWomen who did not give birth in the past 12 months Now married:
18.8% (28)Unmarried:
81.2% (122)
Marital status - American Indian / Alaska Native population 15 years and over
Males 49.0% Never married41.7% Now married0.5% Separated0.0% Widowed8.8% DivorcedFemales 39.5% Never married37.7% Now married4.3% Separated3.6% Widowed14.9% DivorcedWomen who gave birth in the past 12 months Now married:
28.9% (12)Unmarried:
71.1% (29)
Women who did not give birth in the past 12 months Now married:
46.6% (338)Unmarried:
53.4% (388)
Marital status - Asian population 15 years and over
Males 21.9% Never married39.5% Now married0.0% Separated0.0% Widowed38.6% DivorcedFemales 0.0% Never married71.7% Now married0.0% Separated0.0% Widowed28.3% DivorcedWomen who did not give birth in the past 12 months Now married:
100.0% (24)Unmarried:
0.0% (0)
Marital status - Other race population 15 years and over
Males 12.6% Never married87.4% Now married0.0% Separated0.0% Widowed0.0% DivorcedFemales 30.9% Never married61.7% Now married0.0% Separated0.0% Widowed7.4% DivorcedWomen who did not give birth in the past 12 months Now married:
55.4% (42)Unmarried:
44.6% (34)
Marital status - Two or more races population 15 years and over
Males 32.2% Never married50.7% Now married1.9% Separated2.6% Widowed12.5% DivorcedFemales 35.1% Never married26.3% Now married0.9% Separated10.6% Widowed27.1% DivorcedWomen who gave birth in the past 12 months Now married:
27.0% (19)Unmarried:
73.0% (52)
Women who did not give birth in the past 12 months Now married:
34.2% (127)Unmarried:
65.8% (245)
Marital status - White alone, not Hispanic / Latino population 15 years and over
Males 27.2% Never married53.7% Now married1.6% Separated3.3% Widowed14.2% DivorcedFemales 17.8% Never married49.8% Now married2.0% Separated13.5% Widowed16.9% DivorcedWomen who gave birth in the past 12 months Now married:
48.3% (99)Unmarried:
51.7% (106)
Women who did not give birth in the past 12 months Now married:
54.4% (1,632)Unmarried:
45.6% (1,368)
Marital status - Hispanic or Latino population 15 years and over
Males 40.7% Never married51.8% Now married0.0% Separated1.1% Widowed6.4% DivorcedFemales 37.6% Never married48.0% Now married5.7% Separated2.8% Widowed5.9% DivorcedWomen who did not give birth in the past 12 months Now married:
44.2% (171)Unmarried:
55.8% (216)
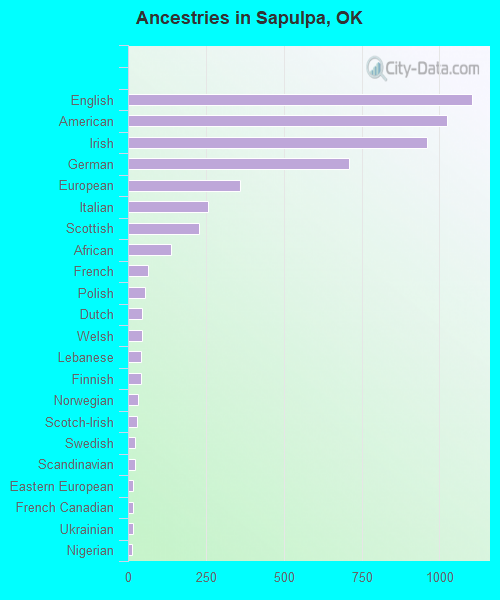
Ancestries in Sapulpa
1,104 11.9% English1,025 11.0% American961 10.3% Irish709 7.6% German360 3.9% European258 2.8% Italian227 2.4% Scottish138 1.5% African63 0.7% French55 0.6% Polish46 0.5% Dutch44 0.5% Welsh41 0.4% Lebanese41 0.4% Finnish32 0.3% Norwegian28 0.3% Scotch-Irish23 0.2% Swedish21 0.2% Scandinavian17 0.2% Eastern European17 0.2% French Canadian15 0.2% Ukrainian14 0.2% Nigerian10 0.1% British9 0.10% Portuguese8 0.09% Greek8 0.09% Hungarian6 0.06% Austrian5 0.05% Iranian
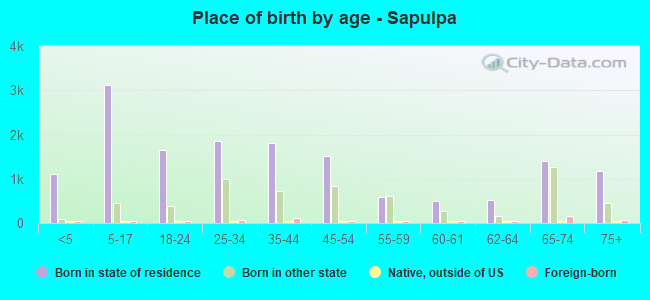
Children Nativity (place of birth) in Sapulpa
Children under 6 years - Living with two parents Both parents native 778 100.0% NativeBoth parents foreign-born 27 100.0% NativeOne native, one foreign-born parent 47 100.0% NativeChildren under 6 years - Living with one parent Native parent 607 100.0% NativeForeign-born parent 7 100.0% NativeChildren 6 to 17 years - Living with two parents Both parents native 1,819 97.7% Native44 2.3% Foreign-bornBoth parents foreign-born 158 100.0% NativeOne native, one foreign-born parent 37 100.0% NativeChildren 6 to 17 years - Living with one parent Native parent 939 100.0% NativeForeign-born parent 16 49.9% Native16 50.1% Foreign-born
Grandparents responsible for own grandchildren in Sapulpa
Grandparents (30 to 59 years) White / Caucasian 82 45.7% Responsible for grandchildren97 54.3% Not responsible for grandchildrenBlack or African American 3 16.3% Responsible for grandchildren14 83.7% Not responsible for grandchildrenAmerican Indian / Alaska Native 13 40.1% Responsible for grandchildren19 59.9% Not responsible for grandchildrenTwo or more races 84 83.1% Responsible for grandchildren17 16.9% Not responsible for grandchildrenWhite alone, not Hispanic / Latino 83 45.8% Responsible for grandchildren98 54.2% Not responsible for grandchildrenGrandparents (60 years and over) White / Caucasian 60 24.3% Responsible for grandchildren188 75.7% Not responsible for grandchildrenAmerican Indian / Alaska Native 7 76.0% Responsible for grandchildren2 24.0% Not responsible for grandchildrenTwo or more races 5 100.0% Responsible for grandchildrenWhite alone, not Hispanic / Latino 35 16.2% Responsible for grandchildren182 83.8% Not responsible for grandchildren