Races in Saratoga Springs, New York (NY) Detailed Stats
Data:
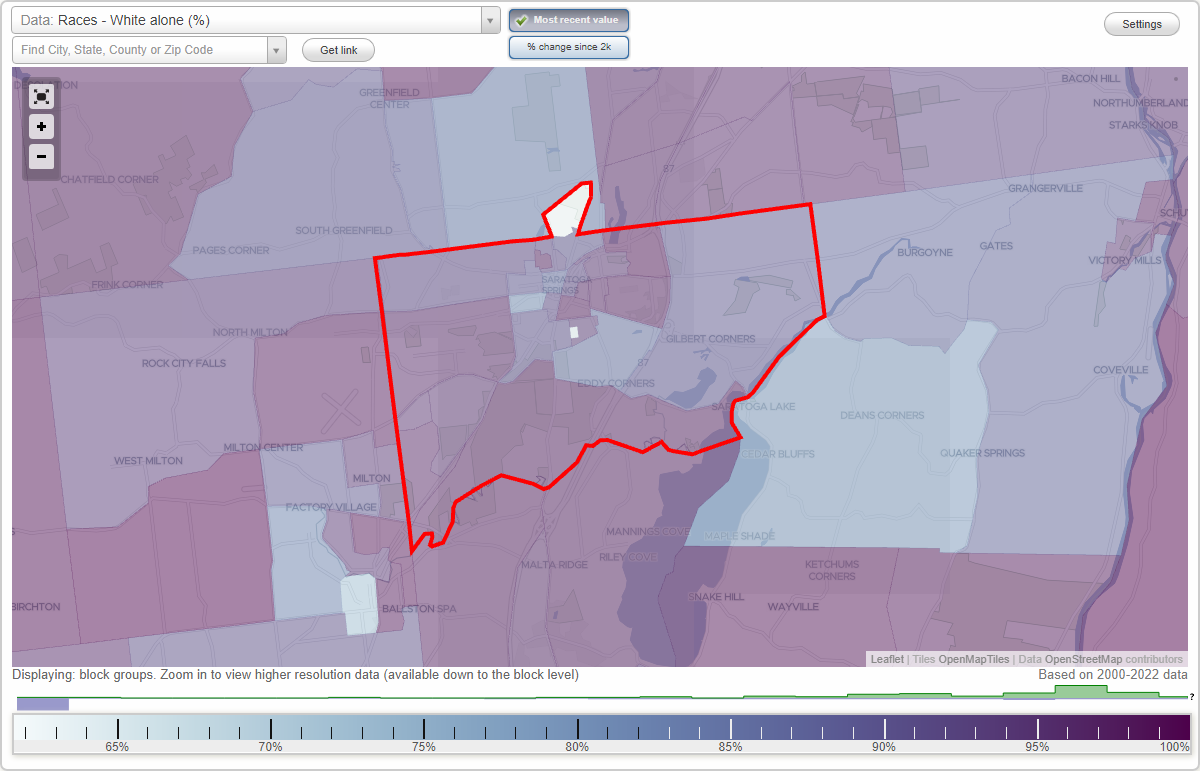
Races - White alone (%)
Races - White alone (% change since 2000)
Races - Black alone (%)
Races - Black alone (% change since 2000)
Races - American Indian alone (%)
Races - American Indian alone (% change since 2000)
Races - Asian alone (%)
Races - Asian alone (% change since 2000)
Races - Hispanic (%)
Races - Hispanic (% change since 2000)
Races - Native Hawaiian and Other Pacific Islander alone (%)
Races - Native Hawaiian and Other Pacific Islander alone (% change since 2000)
Races - Two or more races(%)
Races - Two or more races(% change since 2000)
Races - Other race alone (%)
Races - Other race alone (% change since 2000)
Racial diversity
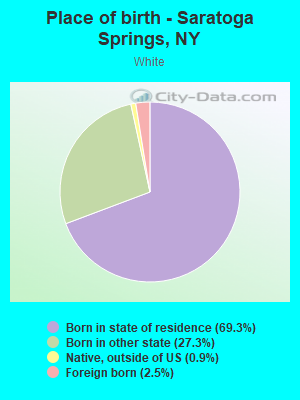
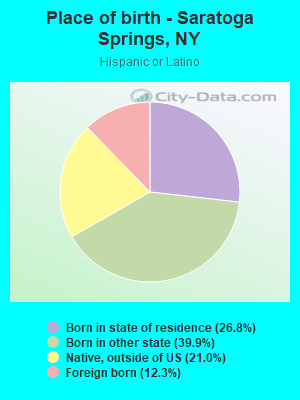
Place of birth - Born in state of residence (%)
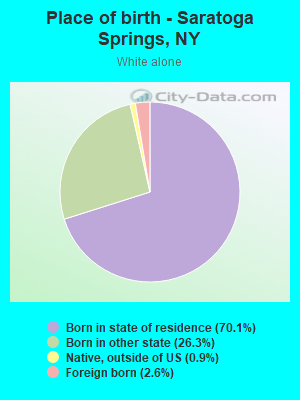
Place of birth - Born in state of residence (%) - White
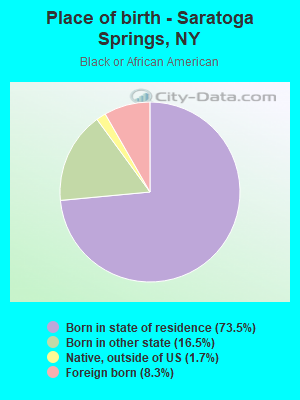
Place of birth - Born in state of residence (%) - Black or African American
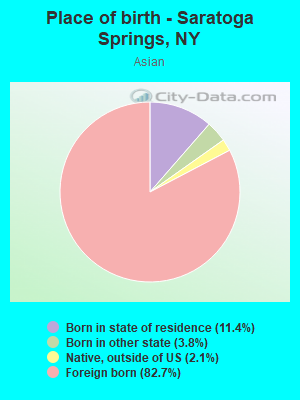
Place of birth - Born in state of residence (%) - Asian
Place of birth - Born in state of residence (%) - Hispanic or Latino
Place of birth - Born in state of residence (%) - American Indian and Alaska Native
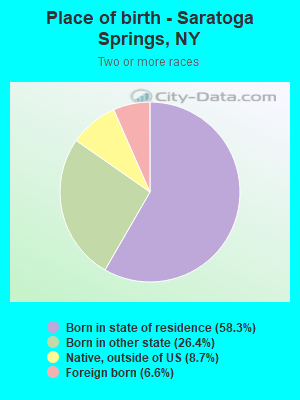
Place of birth - Born in state of residence (%) - Multirace
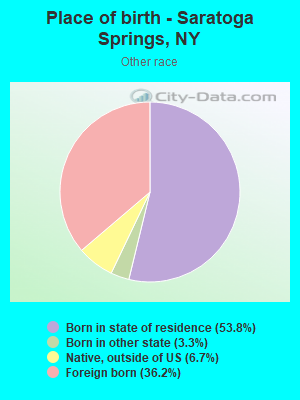
Place of birth - Born in state of residence (%) - Other Race
Place of birth - Born in other state (%)
Place of birth - Born in other state (%) - White
Place of birth - Born in other state (%) - Black or African American
Place of birth - Born in other state (%) - Asian
Place of birth - Born in other state (%) - Hispanic or Latino
Place of birth - Born in other state (%) - American Indian and Alaska Native
Place of birth - Born in other state (%) - Multirace
Place of birth - Born in other state (%) - Other Race
Place of birth - Native, outside of US (%)
Place of birth - Native, outside of US (%) - White
Place of birth - Native, outside of US (%) - Black or African American
Place of birth - Native, outside of US (%) - Asian
Place of birth - Native, outside of US (%) - Hispanic or Latino
Place of birth - Native, outside of US (%) - American Indian and Alaska Native
Place of birth - Native, outside of US (%) - Multirace
Place of birth - Native, outside of US (%) - Other Race
Place of birth - Foreign born (%)
Place of birth - Foreign born (%) - White
Place of birth - Foreign born (%) - Black or African American
Place of birth - Foreign born (%) - Asian
Place of birth - Foreign born (%) - Hispanic or Latino
Place of birth - Foreign born (%) - American Indian and Alaska Native
Place of birth - Foreign born (%) - Multirace
Place of birth - Foreign born (%) - Other Race
Residents speaking English at home (%)
Residents speaking English at home - Born in the United States (%)
Residents speaking English at home - Native, born elsewhere (%)
Residents speaking English at home - Foreign born (%)
Residents speaking Spanish at home (%)
Residents speaking Spanish at home - Born in the United States (%)
Residents speaking Spanish at home - Native, born elsewhere (%)
Residents speaking Spanish at home - Foreign born (%)
Residents speaking other language at home (%)
Residents speaking other language at home - Born in the United States (%)
Residents speaking other language at home - Native, born elsewhere (%)
Residents speaking other language at home - Foreign born (%)
Marital status - Never married (%)
Marital status - Now married (%)
Marital status - Separated (%)
Marital status - Widowed (%)
Marital status - Divorced (%)
Ancestries Reported - Arab (%)
Ancestries Reported - Czech (%)
Ancestries Reported - Danish (%)
Ancestries Reported - Dutch (%)
Ancestries Reported - English (%)
Ancestries Reported - French (%)
Ancestries Reported - French Canadian (%)
Ancestries Reported - German (%)
Ancestries Reported - Greek (%)
Ancestries Reported - Hungarian (%)
Ancestries Reported - Irish (%)
Ancestries Reported - Italian (%)
Ancestries Reported - Lithuanian (%)
Ancestries Reported - Norwegian (%)
Ancestries Reported - Polish (%)
Ancestries Reported - Portuguese (%)
Ancestries Reported - Russian (%)
Ancestries Reported - Scotch-Irish (%)
Ancestries Reported - Scottish (%)
Ancestries Reported - Slovak (%)
Ancestries Reported - Subsaharan African (%)
Ancestries Reported - Swedish (%)
Ancestries Reported - Swiss (%)
Ancestries Reported - Ukrainian (%)
Ancestries Reported - United States (%)
Ancestries Reported - Welsh (%)
Ancestries Reported - West Indian (%)
Ancestries Reported - Other (%)
Geographical mobility - Same house 1 year ago (%)
Geographical mobility - Same house 1 year ago (%) - White
Geographical mobility - Same house 1 year ago (%) - Black or African American
Geographical mobility - Same house 1 year ago (%) - Asian
Geographical mobility - Same house 1 year ago (%) - Hispanic or Latino
Geographical mobility - Same house 1 year ago (%) - American Indian and Alaska Native
Geographical mobility - Same house 1 year ago (%) - Multirace
Geographical mobility - Same house 1 year ago (%) - Other Race
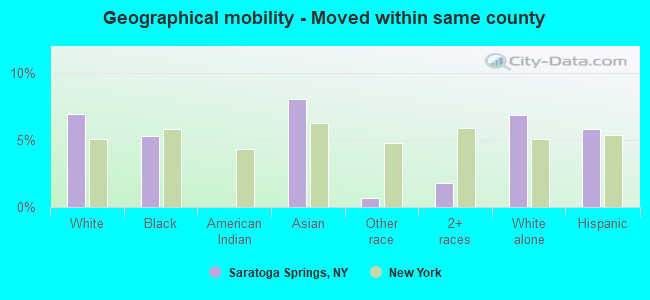
Geographical mobility - Moved within same county (%)
Geographical mobility - Moved within same county (%) - White
Geographical mobility - Moved within same county (%) - Black or African American
Geographical mobility - Moved within same county (%) - Asian
Geographical mobility - Moved within same county (%) - Hispanic or Latino
Geographical mobility - Moved within same county (%) - American Indian and Alaska Native
Geographical mobility - Moved within same county (%) - Multirace
Geographical mobility - Moved within same county (%) - Other Race
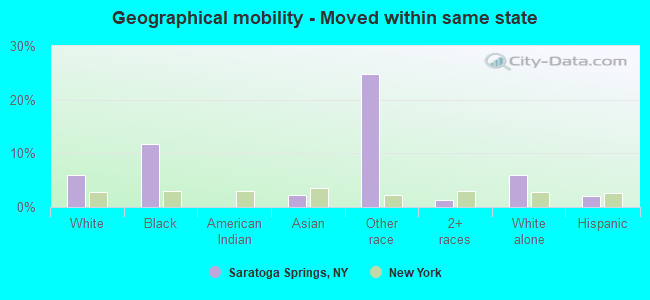
Geographical mobility - Moved from different county within same state (%)
Geographical mobility - Moved from different county within same state (%) - White
Geographical mobility - Moved from different county within same state (%) - Black or African American
Geographical mobility - Moved from different county within same state (%) - Asian
Geographical mobility - Moved from different county within same state (%) - Hispanic or Latino
Geographical mobility - Moved from different county within same state (%) - American Indian and Alaska Native
Geographical mobility - Moved from different county within same state (%) - Multirace
Geographical mobility - Moved from different county within same state (%) - Other Race
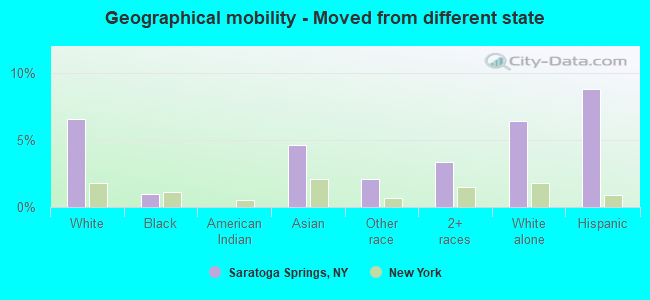
Geographical mobility - Moved from different state (%)
Geographical mobility - Moved from different state (%) - White
Geographical mobility - Moved from different state (%) - Black or African American
Geographical mobility - Moved from different state (%) - Asian
Geographical mobility - Moved from different state (%) - Hispanic or Latino
Geographical mobility - Moved from different state (%) - American Indian and Alaska Native
Geographical mobility - Moved from different state (%) - Multirace
Geographical mobility - Moved from different state (%) - Other Race
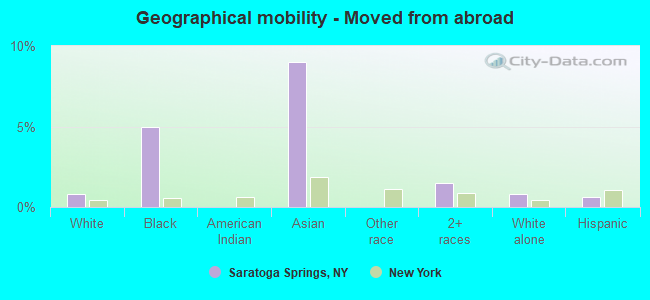
Geographical mobility - Moved from abroad (%)
Geographical mobility - Moved from abroad (%) - White
Geographical mobility - Moved from abroad (%) - Black or African American
Geographical mobility - Moved from abroad (%) - Asian
Geographical mobility - Moved from abroad (%) - Hispanic or Latino
Geographical mobility - Moved from abroad (%) - American Indian and Alaska Native
Geographical mobility - Moved from abroad (%) - Multirace
Geographical mobility - Moved from abroad (%) - Other Race
Place of birth for the foreign-born population - Ireland (%)
Place of birth for the foreign-born population - Denmark (%)
Place of birth for the foreign-born population - Norway (%)
Place of birth for the foreign-born population - Sweden (%)
Place of birth for the foreign-born population - United Kingdom (%)
Place of birth for the foreign-born population - England (%)
Place of birth for the foreign-born population - Scotland (%)
Place of birth for the foreign-born population - Other Northern Europe (%)
Place of birth for the foreign-born population - Austria (%)
Place of birth for the foreign-born population - Belgium (%)
Place of birth for the foreign-born population - France (%)
Place of birth for the foreign-born population - Germany (%)
Place of birth for the foreign-born population - Netherlands (%)
Place of birth for the foreign-born population - Switzerland (%)
Place of birth for the foreign-born population - Other Western Europe (%)
Place of birth for the foreign-born population - Greece (%)
Place of birth for the foreign-born population - Italy (%)
Place of birth for the foreign-born population - Portugal (%)
Place of birth for the foreign-born population - Spain (%)
Place of birth for the foreign-born population - Other Southern Europe (%)
Place of birth for the foreign-born population - Albania (%)
Place of birth for the foreign-born population - Belarus (%)
Place of birth for the foreign-born population - Bosnia and Herzegovina (%)
Place of birth for the foreign-born population - Bulgaria (%)
Place of birth for the foreign-born population - Croatia (%)
Place of birth for the foreign-born population - Czechoslovakia (%)
Place of birth for the foreign-born population - Hungary (%)
Place of birth for the foreign-born population - Latvia (%)
Place of birth for the foreign-born population - Lithuania (%)
Place of birth for the foreign-born population - North Macedonia (Macedonia) (%)
Place of birth for the foreign-born population - Moldova (%)
Place of birth for the foreign-born population - Poland (%)
Place of birth for the foreign-born population - Romania (%)
Place of birth for the foreign-born population - Russia (%)
Place of birth for the foreign-born population - Serbia (%)
Place of birth for the foreign-born population - Ukraine (%)
Place of birth for the foreign-born population - Other Eastern Europe (%)
Place of birth for the foreign-born population - China (%)
Place of birth for the foreign-born population - Hong Kong (%)
Place of birth for the foreign-born population - Taiwan (%)
Place of birth for the foreign-born population - Japan (%)
Place of birth for the foreign-born population - Korea (%)
Place of birth for the foreign-born population - Other Eastern Asia (%)
Place of birth for the foreign-born population - Afghanistan (%)
Place of birth for the foreign-born population - Bangladesh (%)
Place of birth for the foreign-born population - India (%)
Place of birth for the foreign-born population - Iran (%)
Place of birth for the foreign-born population - Kazakhstan (%)
Place of birth for the foreign-born population - Nepal (%)
Place of birth for the foreign-born population - Pakistan (%)
Place of birth for the foreign-born population - Sri Lanka (%)
Place of birth for the foreign-born population - Uzbekistan (%)
Place of birth for the foreign-born population - Other South Central Asia (%)
Place of birth for the foreign-born population - Burma (%)
Place of birth for the foreign-born population - Cambodia (%)
Place of birth for the foreign-born population - Indonesia (%)
Place of birth for the foreign-born population - Laos (%)
Place of birth for the foreign-born population - Malaysia (%)
Place of birth for the foreign-born population - Philippines (%)
Place of birth for the foreign-born population - Singapore (%)
Place of birth for the foreign-born population - Thailand (%)
Place of birth for the foreign-born population - Vietnam (%)
Place of birth for the foreign-born population - Other South Eastern Asia (%)
Place of birth for the foreign-born population - Armenia (%)
Place of birth for the foreign-born population - Iraq (%)
Place of birth for the foreign-born population - Israel (%)
Place of birth for the foreign-born population - Jordan (%)
Place of birth for the foreign-born population - Kuwait (%)
Place of birth for the foreign-born population - Lebanon (%)
Place of birth for the foreign-born population - Saudi Arabia (%)
Place of birth for the foreign-born population - Syria (%)
Place of birth for the foreign-born population - Turkey (%)
Place of birth for the foreign-born population - Yemen (%)
Place of birth for the foreign-born population - Other Western Asia (%)
Place of birth for the foreign-born population - Eritrea (%)
Place of birth for the foreign-born population - Ethiopia (%)
Place of birth for the foreign-born population - Kenya (%)
Place of birth for the foreign-born population - Somalia (%)
Place of birth for the foreign-born population - Uganda (%)
Place of birth for the foreign-born population - Zimbabwe (%)
Place of birth for the foreign-born population - Other Eastern Africa (%)
Place of birth for the foreign-born population - Cameroon (%)
Place of birth for the foreign-born population - Congo (%)
Place of birth for the foreign-born population - Democratic Republic of Congo (Zaire) (%)
Place of birth for the foreign-born population - Other Middle Africa (%)
Place of birth for the foreign-born population - Egypt (%)
Place of birth for the foreign-born population - Morocco (%)
Place of birth for the foreign-born population - Sudan (%)
Place of birth for the foreign-born population - Other Northern Africa (%)
Place of birth for the foreign-born population - South Africa (%)
Place of birth for the foreign-born population - Other Southern Africa (%)
Place of birth for the foreign-born population - Cabo Verde (%)
Place of birth for the foreign-born population - Ghana (%)
Place of birth for the foreign-born population - Liberia (%)
Place of birth for the foreign-born population - Nigeria (%)
Place of birth for the foreign-born population - Senegal (%)
Place of birth for the foreign-born population - Sierra Leone (%)
Place of birth for the foreign-born population - Other Western Africa (%)
Place of birth for the foreign-born population - Australia (%)
Place of birth for the foreign-born population - New Zealand (%)
Place of birth for the foreign-born population - Fiji (%)
Place of birth for the foreign-born population - Micronesia (%)
Place of birth for the foreign-born population - Bahamas (%)
Place of birth for the foreign-born population - Barbados (%)
Place of birth for the foreign-born population - Cuba (%)
Place of birth for the foreign-born population - Dominica (%)
Place of birth for the foreign-born population - Dominican Republic (%)
Place of birth for the foreign-born population - Grenada (%)
Place of birth for the foreign-born population - Haiti (%)
Place of birth for the foreign-born population - Jamaica (%)
Place of birth for the foreign-born population - St. Vincent and the Grenadines (%)
Place of birth for the foreign-born population - Trinidad and Tobago (%)
Place of birth for the foreign-born population - West Indies (%)
Place of birth for the foreign-born population - Other Caribbean (%)
Place of birth for the foreign-born population - Belize (%)
Place of birth for the foreign-born population - Costa Rica (%)
Place of birth for the foreign-born population - El Salvador (%)
Place of birth for the foreign-born population - Guatemala (%)
Place of birth for the foreign-born population - Honduras (%)
Place of birth for the foreign-born population - Mexico (%)
Place of birth for the foreign-born population - Nicaragua (%)
Place of birth for the foreign-born population - Panama (%)
Place of birth for the foreign-born population - Other Central America (%)
Place of birth for the foreign-born population - Argentina (%)
Place of birth for the foreign-born population - Bolivia (%)
Place of birth for the foreign-born population - Brazil (%)
Place of birth for the foreign-born population - Chile (%)
Place of birth for the foreign-born population - Colombia (%)
Place of birth for the foreign-born population - Ecuador (%)
Place of birth for the foreign-born population - Guyana (%)
Place of birth for the foreign-born population - Peru (%)
Place of birth for the foreign-born population - Uruguay (%)
Place of birth for the foreign-born population - Venezuela (%)
Place of birth for the foreign-born population - Other South America (%)
Place of birth for the foreign-born population - Canada (%)
Place of birth for the foreign-born population - Other Northern America (%)
Place of birth for the foreign-born population - Other (%)
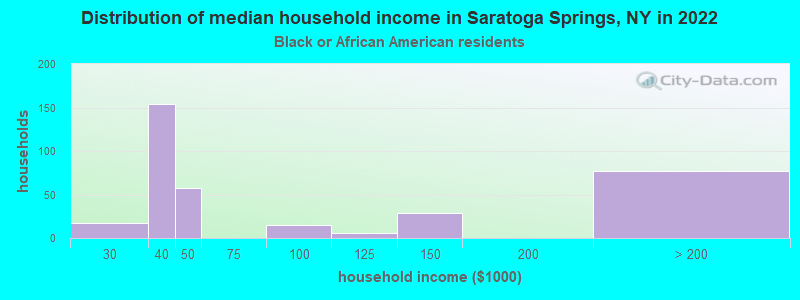
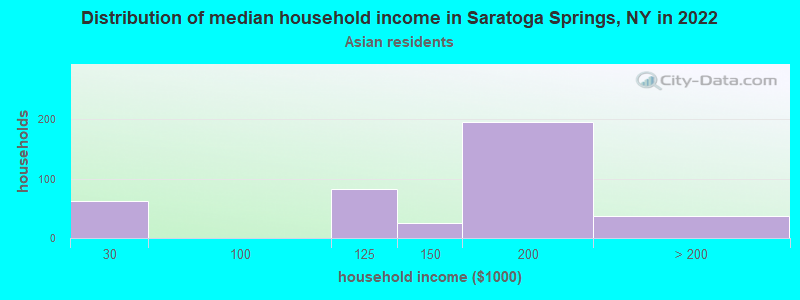
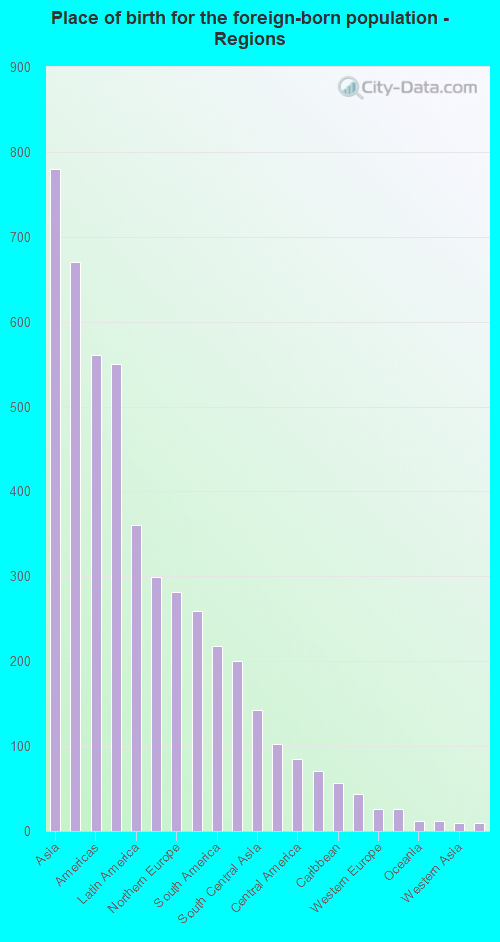
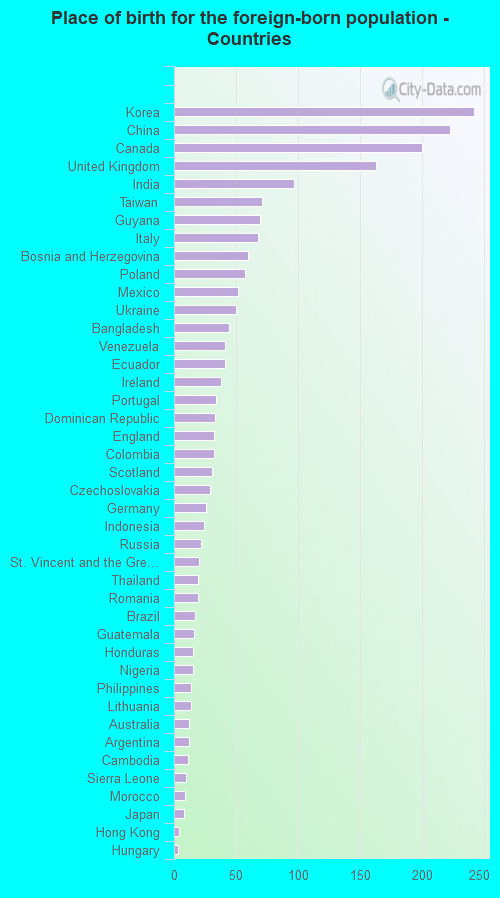
According to 2022 data, the most numerous races in Saratoga Springs, NY are White alone (24,240 residents), Hispanic (1,324 residents), and Black alone (877 residents). 89.2% of Saratoga Springs residents speak English at home. 7.2% of Saratoga Springs, NY residents are foreign-born (2.8% born in Asia, 2.4% born in Europe, 1.3% born in Latin America), which is 206.1% less than the foreign-born rate of 22.0% across the entire state of New York.
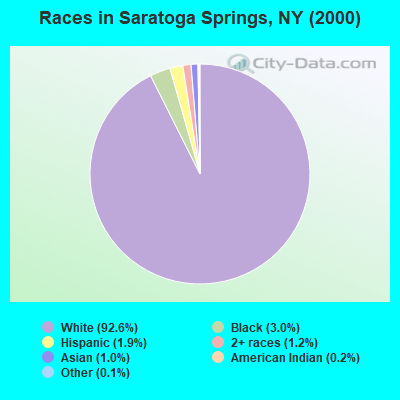
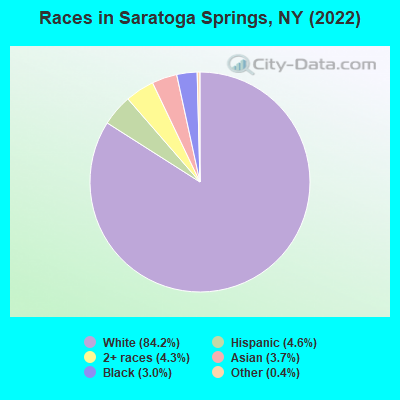
Race distribution in Saratoga Springs
2000 2022
11,760,981 62.0% White alone 2,867,583 15.1% Hispanic 2,812,623 14.8% Black alone 1,035,926 5.5% Asian alone 366,116 1.9% Two or more races 75,499 0.4% Other race alone 52,499 0.3% American Indian alone 5,230 0.03% Native Hawaiian and Other
10,408,933 52.9% White alone 3,867,299 19.7% Hispanic 2,633,840 13.4% Black alone 1,776,286 9.0% Asian alone 732,670 3.7% Two or more races 216,110 1.1% Other race alone 35,082 0.2% American Indian alone 6,931 0.04% Native Hawaiian and Other
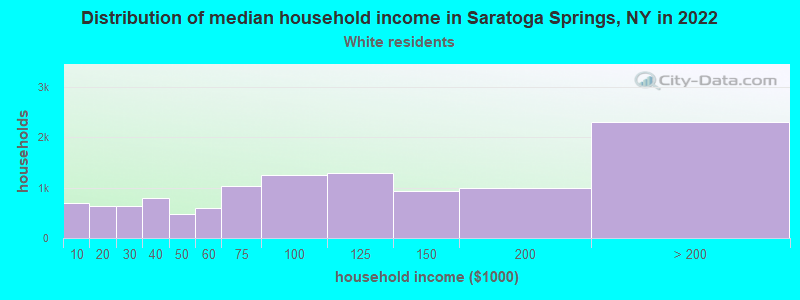
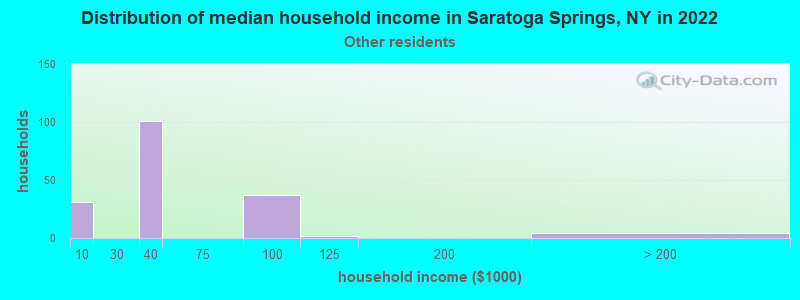
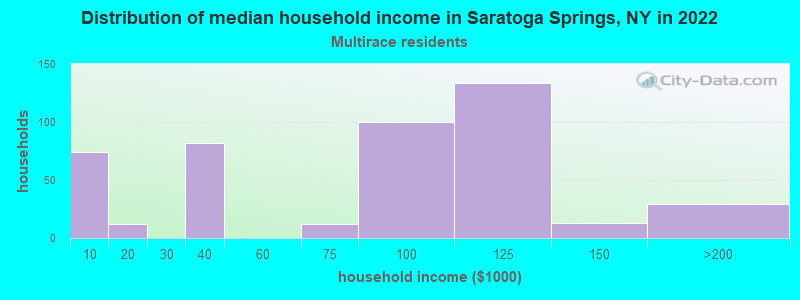
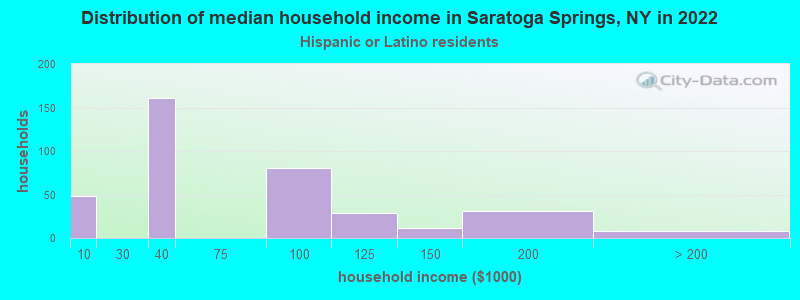
Income and house value in Saratoga Springs Median household income in 2022 $92,734 White non-Hispanic householders$180,248 Asian householders$19,751 Some other race householders$113,891 Two or more races householdersMedian 2022 house value $474,287 White Non-Hispanic householders$334,769 Black or African American householders$346,062 American Indian or Alaska Native householders $440,045 Asian householders$379,575 Two or more races householders$538,035 Hispanic or Latino householders
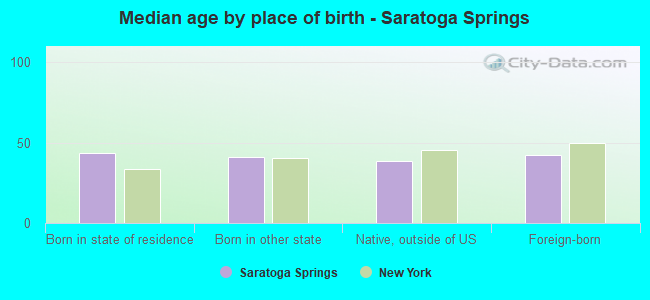
Median age by race in Saratoga Springs
44.9 Median age for White residents42.5 47.9 30.2 Median age for Black or African American residents29.8 39.3 -670,166,228.6 Median age for American Indian / Alaska Native residents-668,699,186.3 -668,411,866.7 33.0 Median age for Asian residents35.1 30.4 -666,666,666.0 Median age for Native Hawaiian / Pacific Islander residents-666,666,666.0 -666,666,666.0 24.7 Median age for Other race residents95.9 21.6 24.0 Median age for Two or more races residents21.9 28.3 46.3 Median age for White alone residents42.9 48.8 27.7 Median age for Hispanic or Latino residents22.4 27.0
Owner/renter occupied households by race in Saratoga Springs
House owners and renters - White residents 6,531 55.7% Owner occupied5,195 44.3% Renter occupiedHouse owners and renters - Black or African American residents 124 28.4% Owner occupied314 71.6% Renter occupiedHouse owners and renters - Asian residents 311 83.2% Owner occupied63 16.8% Renter occupiedHouse owners and renters - Other race residents 189 67.8% Owner occupied90 32.2% Renter occupiedHouse owners and renters - Two or more races residents 101 24.9% Owner occupied306 75.1% Renter occupiedHouse owners and renters - White alone residents 6,582 56.4% Owner occupied5,080 43.6% Renter occupiedHouse owners and renters - Hispanic or Latino residents 113 23.9% Owner occupied361 76.1% Renter occupied
Language usage in Saratoga Springs
English speakers - Total 89.2% of residents of Saratoga Springs speak English at home.
2.5% of residents speak Spanish at home 567 82.1% Speak English very well124 17.9% Speak English less than very well8.4% of residents speak other language at home 1,798 76.7% Speak English very well546 23.3% Speak English less than very well
English speakers - Born in the United States 93.1% of residents of Saratoga Springs speak English at home.
2.8% of residents speak Spanish at home 195 98.5% Speak English very well3 1.5% Speak English less than very well4.5% of residents speak other language at home 246 75.7% Speak English very well79 24.3% Speak English less than very well
English speakers - Native, born elsewhere 58.6% of residents of Saratoga Springs speak English at home.
29.2% of residents speak Spanish at home 8 5.8% Speak English very well131 94.2% Speak English less than very well7.4% of residents speak other language at home 5 14.3% Speak English very well30 85.7% Speak English less than very well
English speakers - Foreign-born 23.8% of residents of Saratoga Springs speak English at home.
6.6% of residents speak Spanish at home 47 39.2% Speak English very well73 60.8% Speak English less than very well67.6% of residents speak other language at home 820 66.5% Speak English very well413 33.5% Speak English less than very well
White (Caucasian) - Speak only English Native:
96.5% (22,284)Foreign-born:
54.3% (328)
White (Caucasian) - Speak another language Native:
3.5% (817)Foreign-born:
44.7% (270)
Black or African American - Speak only English Native:
93.0% (776)Foreign-born:
35.2% (24)
Black or African American - Speak another language Native:
7.2% (60)Foreign-born:
66.3% (45)
Asian - Speak only English Native:
31.8% (52)Foreign-born:
2.5% (21)
Asian - Speak another language Native:
89.2% (146)Foreign-born:
100.0% (842)
Other race - Speak only English Native:
40.4% (148)Foreign-born:
5.0% (9)
Other race - Speak another language Native:
58.7% (215)Foreign-born:
66.2% (118)
Two or more races - Speak only English Native:
58.0% (720)Foreign-born:
37.4% (104)
Two or more races - Speak another language Native:
42.5% (528)Foreign-born:
61.2% (171)
White alone - Speak only English Native:
97.1% (22,149)Foreign-born:
55.7% (343)
White alone - Speak another language Native:
3.1% (701)Foreign-born:
42.6% (262)
Hispanic or Latino - Speak only English Native:
53.5% (515)Foreign-born:
7.4% (18)
Hispanic or Latino - Speak another language Native:
47.5% (458)Foreign-born:
92.6% (224)
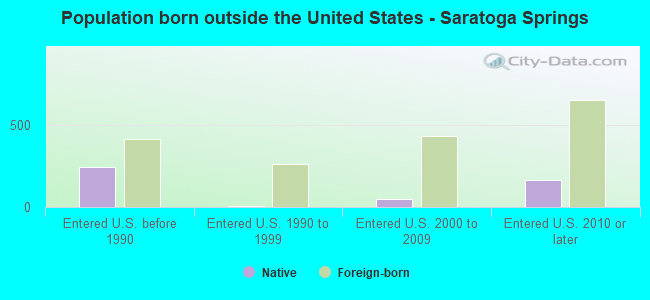
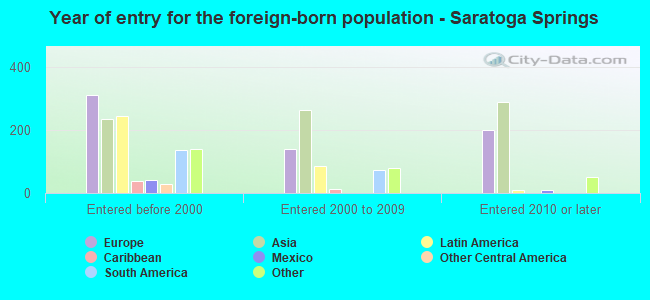
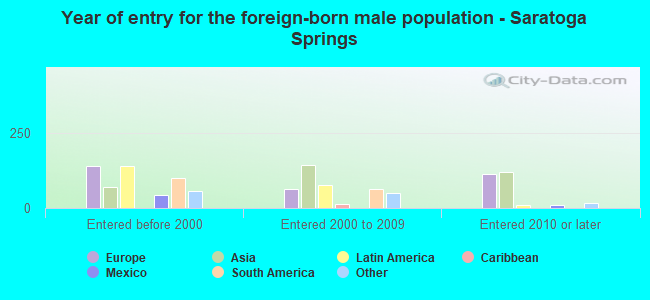
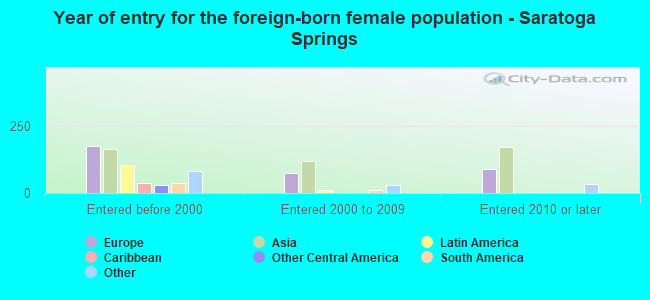
Foreign-born residents in Saratoga Springs 2,070 residents are foreign born (2.8% Asia , 2.4% Europe , 1.3% Latin America ).
This city:
7.2%New York:
22.6%
Marital status for residents in Saratoga Springs Marital status - White (Caucasian) population 15 years and over
Males 38.3% Never married51.4% Now married0.8% Separated3.1% Widowed6.4% DivorcedFemales 33.1% Never married43.1% Now married1.0% Separated8.5% Widowed14.2% DivorcedWomen who gave birth in the past 12 months Now married:
83.5% (161)Unmarried:
16.5% (32)
Women who did not give birth in the past 12 months Now married:
30.0% (1,631)Unmarried:
70.0% (3,812)
Marital status - Black or African American population 15 years and over
Males 73.0% Never married23.8% Now married0.0% Separated0.0% Widowed3.2% DivorcedFemales 56.7% Never married14.3% Now married0.0% Separated2.4% Widowed26.7% DivorcedWomen who did not give birth in the past 12 months Now married:
25.9% (47)Unmarried:
74.1% (136)
Marital status - Asian population 15 years and over
Males 52.2% Never married47.8% Now married0.0% Separated0.0% Widowed0.0% DivorcedFemales 43.4% Never married56.6% Now married0.0% Separated0.0% Widowed0.0% DivorcedWomen who gave birth in the past 12 months Now married:
100.0% (18)Unmarried:
0.0% (0)
Women who did not give birth in the past 12 months Now married:
52.1% (280)Unmarried:
47.9% (257)
Marital status - Other race population 15 years and over
Males 27.1% Never married44.4% Now married4.5% Separated0.0% Widowed24.1% DivorcedFemales 49.8% Never married23.1% Now married0.0% Separated18.3% Widowed8.7% DivorcedWomen who did not give birth in the past 12 months Now married:
16.8% (25)Unmarried:
83.2% (126)
Marital status - Two or more races population 15 years and over
Males 65.1% Never married8.7% Now married15.5% Separated0.0% Widowed10.7% DivorcedFemales 59.1% Never married22.4% Now married4.1% Separated4.6% Widowed9.8% DivorcedWomen who did not give birth in the past 12 months Now married:
20.9% (88)Unmarried:
79.1% (334)
Marital status - White alone, not Hispanic / Latino population 15 years and over
Males 37.6% Never married52.1% Now married0.8% Separated3.2% Widowed6.3% DivorcedFemales 32.9% Never married43.4% Now married1.1% Separated8.6% Widowed14.1% DivorcedWomen who gave birth in the past 12 months Now married:
83.5% (163)Unmarried:
16.5% (32)
Women who did not give birth in the past 12 months Now married:
30.1% (1,606)Unmarried:
69.9% (3,724)
Marital status - Hispanic or Latino population 15 years and over
Males 55.5% Never married23.6% Now married1.2% Separated0.0% Widowed19.7% DivorcedFemales 45.2% Never married25.5% Now married3.3% Separated8.8% Widowed17.2% DivorcedWomen who did not give birth in the past 12 months Now married:
27.1% (109)Unmarried:
72.9% (291)
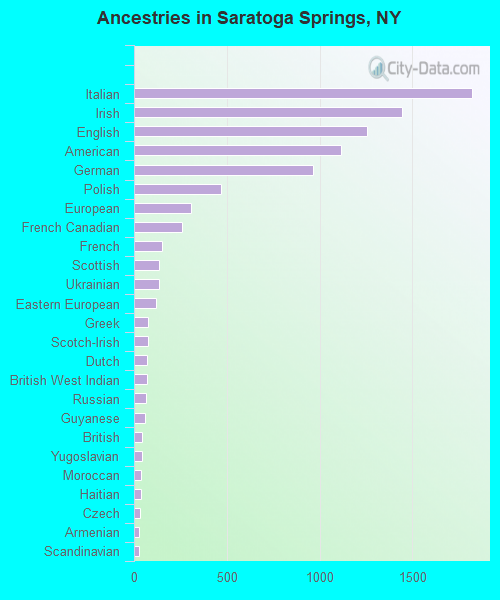
Ancestries in Saratoga Springs
1,822 15.7% Italian1,443 12.4% Irish1,255 10.8% English1,118 9.6% American964 8.3% German469 4.0% Polish309 2.7% European258 2.2% French Canadian153 1.3% French137 1.2% Scottish134 1.2% Ukrainian120 1.0% Eastern European75 0.6% Greek74 0.6% Scotch-Irish70 0.6% Dutch70 0.6% British West Indian67 0.6% Russian58 0.5% Guyanese41 0.4% British41 0.4% Yugoslavian38 0.3% Moroccan38 0.3% Haitian32 0.3% Czech27 0.2% Armenian26 0.2% Scandinavian23 0.2% Finnish22 0.2% Belgian22 0.2% Northern European19 0.2% Canadian19 0.2% Portuguese17 0.1% Czechoslovakian15 0.1% Hungarian15 0.1% Lithuanian14 0.1% African13 0.1% Syrian12 0.1% Norwegian10 0.09% Sierra Leonean9 0.08% Swiss8 0.07% Slovak8 0.07% Nigerian5 0.04% Pennsylvania German5 0.04% Swedish4 0.03% Arab3 0.03% West Indian2 0.02% Jamaican2 0.02% Barbadian
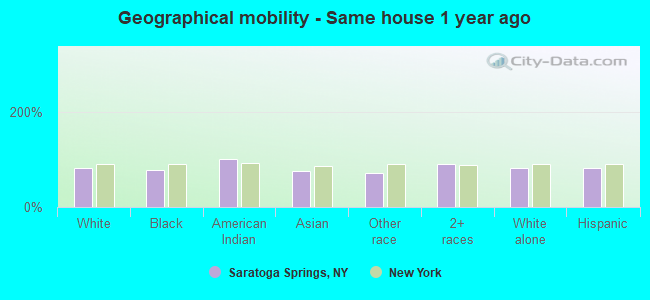
Geographical mobility in Saratoga Springs Same house 1 year ago 19,701 81.0% White (Caucasian)698 77.6% Black or African American8 100.0% American Indian / Alaska Native714 76.1% Asian327 72.1% Other race1,561 90.2% Two or more races19,532 81.2% White alone, not Hispanic / Latino1,004 82.5% Hispanic or LatinoMoved within same county 1,685 6.9% White / Caucasian47 5.3% Black or African American75 8.0% Asian3 0.7% Other race30 1.8% Two or more races1,649 6.9% White alone, not Hispanic / Latino71 5.8% Hispanic or LatinoMoved within same state 1,439 5.9% White / Caucasian105 11.7% Black or African American21 2.3% Asian113 24.8% Other race22 1.3% Two or more races1,443 6.0% White alone, not Hispanic / Latino24 2.0% Hispanic or LatinoMoved from different state 1,604 6.6% White / Caucasian9 0.9% Black or African American43 4.6% Asian9 2.1% Other race58 3.4% Two or more races1,545 6.4% White alone, not Hispanic / Latino107 8.8% Hispanic or LatinoMoved from abroad 196 0.8% White45 5.0% Black or African American84 9.0% Asian26 1.5% Two or more races197 0.8% White alone, not Hispanic / Latino8 0.6% Hispanic or Latino
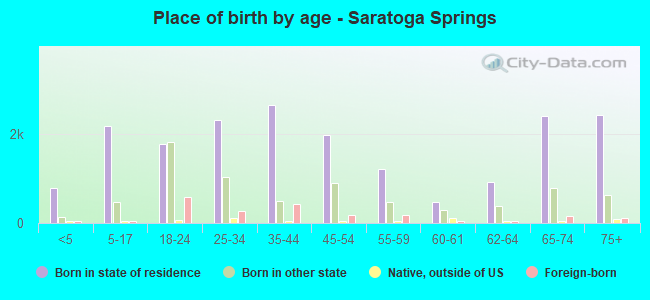
Children Nativity (place of birth) in Saratoga Springs
Children under 6 years - Living with two parents Both parents native 791 100.0% NativeBoth parents foreign-born 62 100.0% NativeOne native, one foreign-born parent 166 100.0% NativeChildren under 6 years - Living with one parent Native parent 94 100.0% NativeChildren 6 to 17 years - Living with two parents Both parents native 1,687 100.0% Native0 0.0% Foreign-bornBoth parents foreign-born 39 64.3% Native22 35.7% Foreign-bornOne native, one foreign-born parent 44 70.9% Native18 29.1% Foreign-bornChildren 6 to 17 years - Living with one parent Native parent 792 100.0% NativeForeign-born parent 49 40.9% Native70 59.1% Foreign-born
Grandparents responsible for own grandchildren in Saratoga Springs
Grandparents (30 to 59 years) White / Caucasian 29 69.2% Responsible for grandchildren13 30.8% Not responsible for grandchildrenWhite alone, not Hispanic / Latino 29 65.6% Responsible for grandchildren15 34.4% Not responsible for grandchildren
Grandparents (60 years and over) White / Caucasian 28 100.0% Not responsible for grandchildrenWhite alone, not Hispanic / Latino 28 100.0% Not responsible for grandchildren