Races in Satellite Beach, Florida (FL) Detailed Stats
Data:
Races - White alone (%)
Races - White alone (% change since 2000)
Races - Black alone (%)
Races - Black alone (% change since 2000)
Races - American Indian alone (%)
Races - American Indian alone (% change since 2000)
Races - Asian alone (%)
Races - Asian alone (% change since 2000)
Races - Hispanic (%)
Races - Hispanic (% change since 2000)
Races - Native Hawaiian and Other Pacific Islander alone (%)
Races - Native Hawaiian and Other Pacific Islander alone (% change since 2000)
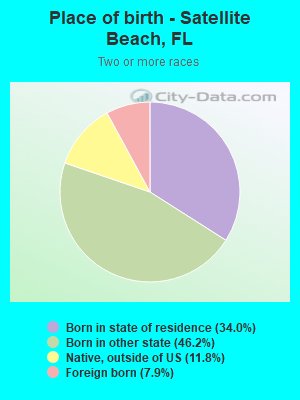
Races - Two or more races(%)
Races - Two or more races(% change since 2000)
Races - Other race alone (%)
Races - Other race alone (% change since 2000)
Racial diversity
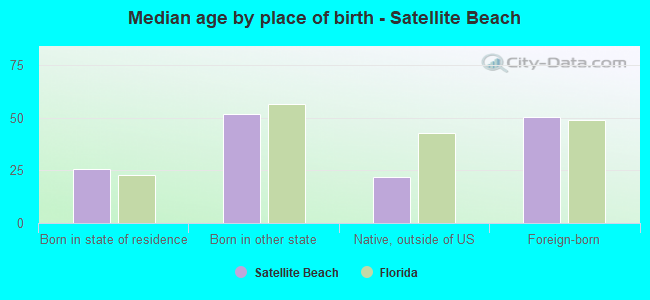
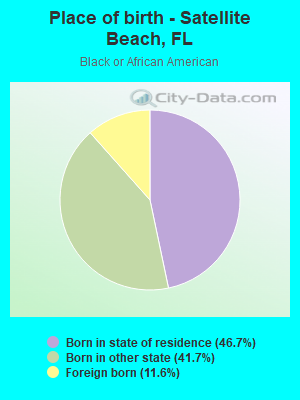
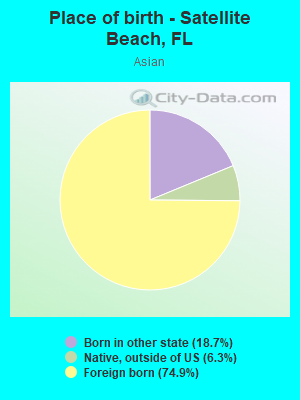
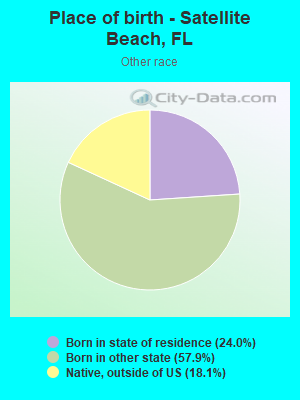
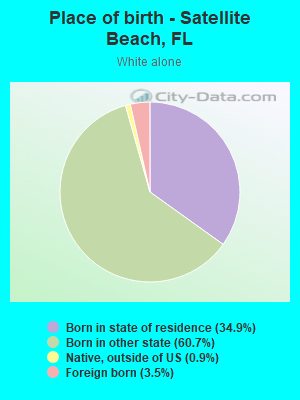
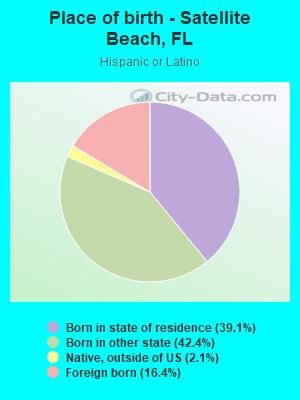
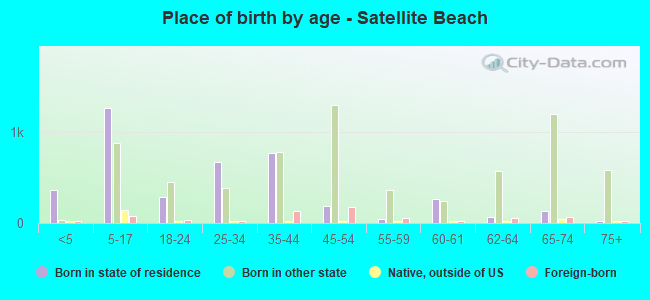
Place of birth - Born in state of residence (%)
Place of birth - Born in state of residence (%) - White
Place of birth - Born in state of residence (%) - Black or African American
Place of birth - Born in state of residence (%) - Asian
Place of birth - Born in state of residence (%) - Hispanic or Latino
Place of birth - Born in state of residence (%) - American Indian and Alaska Native
Place of birth - Born in state of residence (%) - Multirace
Place of birth - Born in state of residence (%) - Other Race
Place of birth - Born in other state (%)
Place of birth - Born in other state (%) - White
Place of birth - Born in other state (%) - Black or African American
Place of birth - Born in other state (%) - Asian
Place of birth - Born in other state (%) - Hispanic or Latino
Place of birth - Born in other state (%) - American Indian and Alaska Native
Place of birth - Born in other state (%) - Multirace
Place of birth - Born in other state (%) - Other Race
Place of birth - Native, outside of US (%)
Place of birth - Native, outside of US (%) - White
Place of birth - Native, outside of US (%) - Black or African American
Place of birth - Native, outside of US (%) - Asian
Place of birth - Native, outside of US (%) - Hispanic or Latino
Place of birth - Native, outside of US (%) - American Indian and Alaska Native
Place of birth - Native, outside of US (%) - Multirace
Place of birth - Native, outside of US (%) - Other Race
Place of birth - Foreign born (%)
Place of birth - Foreign born (%) - White
Place of birth - Foreign born (%) - Black or African American
Place of birth - Foreign born (%) - Asian
Place of birth - Foreign born (%) - Hispanic or Latino
Place of birth - Foreign born (%) - American Indian and Alaska Native
Place of birth - Foreign born (%) - Multirace
Place of birth - Foreign born (%) - Other Race
Residents speaking English at home (%)
Residents speaking English at home - Born in the United States (%)
Residents speaking English at home - Native, born elsewhere (%)
Residents speaking English at home - Foreign born (%)
Residents speaking Spanish at home (%)
Residents speaking Spanish at home - Born in the United States (%)
Residents speaking Spanish at home - Native, born elsewhere (%)
Residents speaking Spanish at home - Foreign born (%)
Residents speaking other language at home (%)
Residents speaking other language at home - Born in the United States (%)
Residents speaking other language at home - Native, born elsewhere (%)
Residents speaking other language at home - Foreign born (%)
Marital status - Never married (%)
Marital status - Now married (%)
Marital status - Separated (%)
Marital status - Widowed (%)
Marital status - Divorced (%)
Ancestries Reported - Arab (%)
Ancestries Reported - Czech (%)
Ancestries Reported - Danish (%)
Ancestries Reported - Dutch (%)
Ancestries Reported - English (%)
Ancestries Reported - French (%)
Ancestries Reported - French Canadian (%)
Ancestries Reported - German (%)
Ancestries Reported - Greek (%)
Ancestries Reported - Hungarian (%)
Ancestries Reported - Irish (%)
Ancestries Reported - Italian (%)
Ancestries Reported - Lithuanian (%)
Ancestries Reported - Norwegian (%)
Ancestries Reported - Polish (%)
Ancestries Reported - Portuguese (%)
Ancestries Reported - Russian (%)
Ancestries Reported - Scotch-Irish (%)
Ancestries Reported - Scottish (%)
Ancestries Reported - Slovak (%)
Ancestries Reported - Subsaharan African (%)
Ancestries Reported - Swedish (%)
Ancestries Reported - Swiss (%)
Ancestries Reported - Ukrainian (%)
Ancestries Reported - United States (%)
Ancestries Reported - Welsh (%)
Ancestries Reported - West Indian (%)
Ancestries Reported - Other (%)
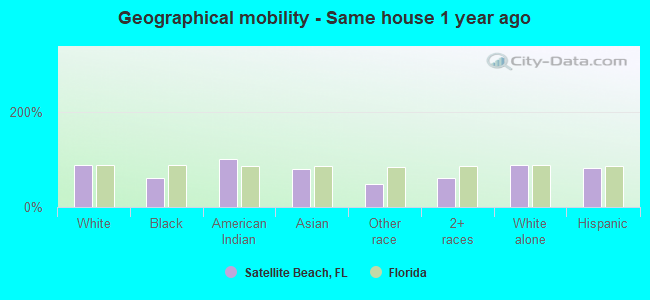
Geographical mobility - Same house 1 year ago (%)
Geographical mobility - Same house 1 year ago (%) - White
Geographical mobility - Same house 1 year ago (%) - Black or African American
Geographical mobility - Same house 1 year ago (%) - Asian
Geographical mobility - Same house 1 year ago (%) - Hispanic or Latino
Geographical mobility - Same house 1 year ago (%) - American Indian and Alaska Native
Geographical mobility - Same house 1 year ago (%) - Multirace
Geographical mobility - Same house 1 year ago (%) - Other Race
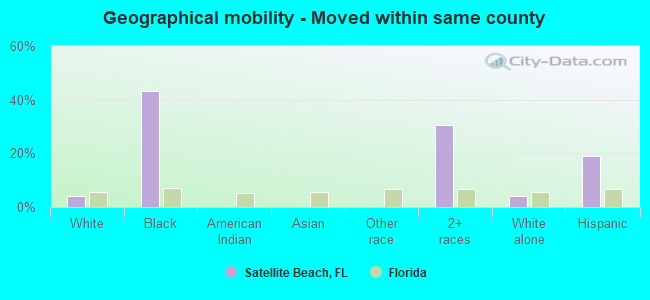
Geographical mobility - Moved within same county (%)
Geographical mobility - Moved within same county (%) - White
Geographical mobility - Moved within same county (%) - Black or African American
Geographical mobility - Moved within same county (%) - Asian
Geographical mobility - Moved within same county (%) - Hispanic or Latino
Geographical mobility - Moved within same county (%) - American Indian and Alaska Native
Geographical mobility - Moved within same county (%) - Multirace
Geographical mobility - Moved within same county (%) - Other Race
Geographical mobility - Moved from different county within same state (%)
Geographical mobility - Moved from different county within same state (%) - White
Geographical mobility - Moved from different county within same state (%) - Black or African American
Geographical mobility - Moved from different county within same state (%) - Asian
Geographical mobility - Moved from different county within same state (%) - Hispanic or Latino
Geographical mobility - Moved from different county within same state (%) - American Indian and Alaska Native
Geographical mobility - Moved from different county within same state (%) - Multirace
Geographical mobility - Moved from different county within same state (%) - Other Race
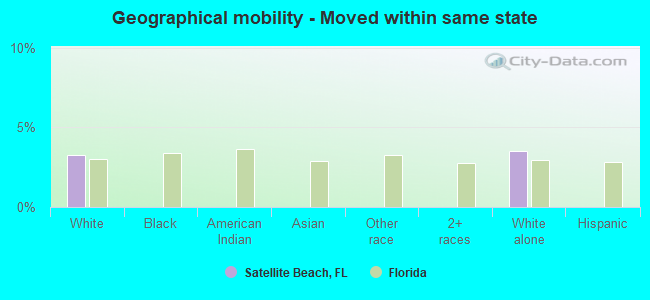
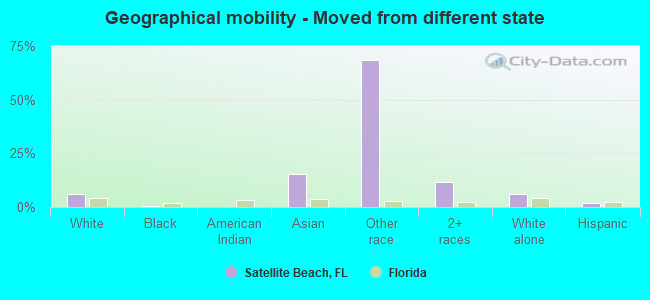
Geographical mobility - Moved from different state (%)
Geographical mobility - Moved from different state (%) - White
Geographical mobility - Moved from different state (%) - Black or African American
Geographical mobility - Moved from different state (%) - Asian
Geographical mobility - Moved from different state (%) - Hispanic or Latino
Geographical mobility - Moved from different state (%) - American Indian and Alaska Native
Geographical mobility - Moved from different state (%) - Multirace
Geographical mobility - Moved from different state (%) - Other Race
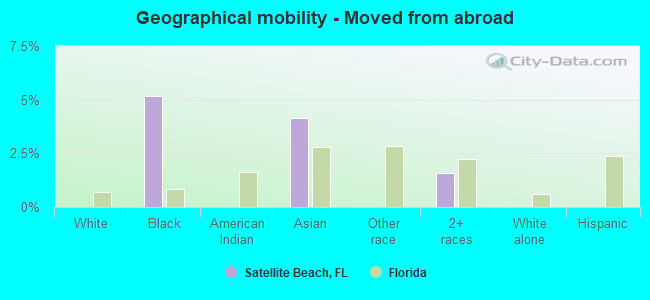
Geographical mobility - Moved from abroad (%)
Geographical mobility - Moved from abroad (%) - White
Geographical mobility - Moved from abroad (%) - Black or African American
Geographical mobility - Moved from abroad (%) - Asian
Geographical mobility - Moved from abroad (%) - Hispanic or Latino
Geographical mobility - Moved from abroad (%) - American Indian and Alaska Native
Geographical mobility - Moved from abroad (%) - Multirace
Geographical mobility - Moved from abroad (%) - Other Race
Place of birth for the foreign-born population - Ireland (%)
Place of birth for the foreign-born population - Denmark (%)
Place of birth for the foreign-born population - Norway (%)
Place of birth for the foreign-born population - Sweden (%)
Place of birth for the foreign-born population - United Kingdom (%)
Place of birth for the foreign-born population - England (%)
Place of birth for the foreign-born population - Scotland (%)
Place of birth for the foreign-born population - Other Northern Europe (%)
Place of birth for the foreign-born population - Austria (%)
Place of birth for the foreign-born population - Belgium (%)
Place of birth for the foreign-born population - France (%)
Place of birth for the foreign-born population - Germany (%)
Place of birth for the foreign-born population - Netherlands (%)
Place of birth for the foreign-born population - Switzerland (%)
Place of birth for the foreign-born population - Other Western Europe (%)
Place of birth for the foreign-born population - Greece (%)
Place of birth for the foreign-born population - Italy (%)
Place of birth for the foreign-born population - Portugal (%)
Place of birth for the foreign-born population - Spain (%)
Place of birth for the foreign-born population - Other Southern Europe (%)
Place of birth for the foreign-born population - Albania (%)
Place of birth for the foreign-born population - Belarus (%)
Place of birth for the foreign-born population - Bosnia and Herzegovina (%)
Place of birth for the foreign-born population - Bulgaria (%)
Place of birth for the foreign-born population - Croatia (%)
Place of birth for the foreign-born population - Czechoslovakia (%)
Place of birth for the foreign-born population - Hungary (%)
Place of birth for the foreign-born population - Latvia (%)
Place of birth for the foreign-born population - Lithuania (%)
Place of birth for the foreign-born population - North Macedonia (Macedonia) (%)
Place of birth for the foreign-born population - Moldova (%)
Place of birth for the foreign-born population - Poland (%)
Place of birth for the foreign-born population - Romania (%)
Place of birth for the foreign-born population - Russia (%)
Place of birth for the foreign-born population - Serbia (%)
Place of birth for the foreign-born population - Ukraine (%)
Place of birth for the foreign-born population - Other Eastern Europe (%)
Place of birth for the foreign-born population - China (%)
Place of birth for the foreign-born population - Hong Kong (%)
Place of birth for the foreign-born population - Taiwan (%)
Place of birth for the foreign-born population - Japan (%)
Place of birth for the foreign-born population - Korea (%)
Place of birth for the foreign-born population - Other Eastern Asia (%)
Place of birth for the foreign-born population - Afghanistan (%)
Place of birth for the foreign-born population - Bangladesh (%)
Place of birth for the foreign-born population - India (%)
Place of birth for the foreign-born population - Iran (%)
Place of birth for the foreign-born population - Kazakhstan (%)
Place of birth for the foreign-born population - Nepal (%)
Place of birth for the foreign-born population - Pakistan (%)
Place of birth for the foreign-born population - Sri Lanka (%)
Place of birth for the foreign-born population - Uzbekistan (%)
Place of birth for the foreign-born population - Other South Central Asia (%)
Place of birth for the foreign-born population - Burma (%)
Place of birth for the foreign-born population - Cambodia (%)
Place of birth for the foreign-born population - Indonesia (%)
Place of birth for the foreign-born population - Laos (%)
Place of birth for the foreign-born population - Malaysia (%)
Place of birth for the foreign-born population - Philippines (%)
Place of birth for the foreign-born population - Singapore (%)
Place of birth for the foreign-born population - Thailand (%)
Place of birth for the foreign-born population - Vietnam (%)
Place of birth for the foreign-born population - Other South Eastern Asia (%)
Place of birth for the foreign-born population - Armenia (%)
Place of birth for the foreign-born population - Iraq (%)
Place of birth for the foreign-born population - Israel (%)
Place of birth for the foreign-born population - Jordan (%)
Place of birth for the foreign-born population - Kuwait (%)
Place of birth for the foreign-born population - Lebanon (%)
Place of birth for the foreign-born population - Saudi Arabia (%)
Place of birth for the foreign-born population - Syria (%)
Place of birth for the foreign-born population - Turkey (%)
Place of birth for the foreign-born population - Yemen (%)
Place of birth for the foreign-born population - Other Western Asia (%)
Place of birth for the foreign-born population - Eritrea (%)
Place of birth for the foreign-born population - Ethiopia (%)
Place of birth for the foreign-born population - Kenya (%)
Place of birth for the foreign-born population - Somalia (%)
Place of birth for the foreign-born population - Uganda (%)
Place of birth for the foreign-born population - Zimbabwe (%)
Place of birth for the foreign-born population - Other Eastern Africa (%)
Place of birth for the foreign-born population - Cameroon (%)
Place of birth for the foreign-born population - Congo (%)
Place of birth for the foreign-born population - Democratic Republic of Congo (Zaire) (%)
Place of birth for the foreign-born population - Other Middle Africa (%)
Place of birth for the foreign-born population - Egypt (%)
Place of birth for the foreign-born population - Morocco (%)
Place of birth for the foreign-born population - Sudan (%)
Place of birth for the foreign-born population - Other Northern Africa (%)
Place of birth for the foreign-born population - South Africa (%)
Place of birth for the foreign-born population - Other Southern Africa (%)
Place of birth for the foreign-born population - Cabo Verde (%)
Place of birth for the foreign-born population - Ghana (%)
Place of birth for the foreign-born population - Liberia (%)
Place of birth for the foreign-born population - Nigeria (%)
Place of birth for the foreign-born population - Senegal (%)
Place of birth for the foreign-born population - Sierra Leone (%)
Place of birth for the foreign-born population - Other Western Africa (%)
Place of birth for the foreign-born population - Australia (%)
Place of birth for the foreign-born population - New Zealand (%)
Place of birth for the foreign-born population - Fiji (%)
Place of birth for the foreign-born population - Micronesia (%)
Place of birth for the foreign-born population - Bahamas (%)
Place of birth for the foreign-born population - Barbados (%)
Place of birth for the foreign-born population - Cuba (%)
Place of birth for the foreign-born population - Dominica (%)
Place of birth for the foreign-born population - Dominican Republic (%)
Place of birth for the foreign-born population - Grenada (%)
Place of birth for the foreign-born population - Haiti (%)
Place of birth for the foreign-born population - Jamaica (%)
Place of birth for the foreign-born population - St. Vincent and the Grenadines (%)
Place of birth for the foreign-born population - Trinidad and Tobago (%)
Place of birth for the foreign-born population - West Indies (%)
Place of birth for the foreign-born population - Other Caribbean (%)
Place of birth for the foreign-born population - Belize (%)
Place of birth for the foreign-born population - Costa Rica (%)
Place of birth for the foreign-born population - El Salvador (%)
Place of birth for the foreign-born population - Guatemala (%)
Place of birth for the foreign-born population - Honduras (%)
Place of birth for the foreign-born population - Mexico (%)
Place of birth for the foreign-born population - Nicaragua (%)
Place of birth for the foreign-born population - Panama (%)
Place of birth for the foreign-born population - Other Central America (%)
Place of birth for the foreign-born population - Argentina (%)
Place of birth for the foreign-born population - Bolivia (%)
Place of birth for the foreign-born population - Brazil (%)
Place of birth for the foreign-born population - Chile (%)
Place of birth for the foreign-born population - Colombia (%)
Place of birth for the foreign-born population - Ecuador (%)
Place of birth for the foreign-born population - Guyana (%)
Place of birth for the foreign-born population - Peru (%)
Place of birth for the foreign-born population - Uruguay (%)
Place of birth for the foreign-born population - Venezuela (%)
Place of birth for the foreign-born population - Other South America (%)
Place of birth for the foreign-born population - Canada (%)
Place of birth for the foreign-born population - Other Northern America (%)
Place of birth for the foreign-born population - Other (%)
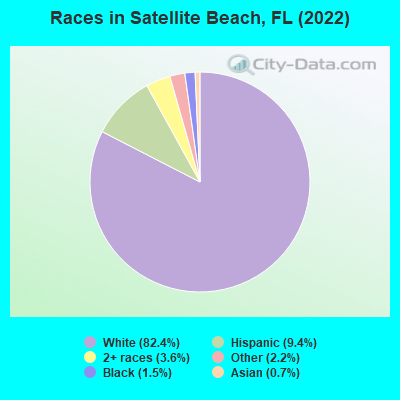
According to 2022 data, the most numerous races in Satellite Beach, FL are White alone (9,509 residents), Hispanic (1,085 residents), and Black alone (175 residents). 94.0% of Satellite Beach residents speak English at home. 4.9% of Satellite Beach, FL residents are foreign-born (1.5% born in Latin America, 1.5% born in Europe, 0.8% born in Asia, 0.6% born in North America), which is 326.7% less than the foreign-born rate of 21.0% across the entire state of Florida.
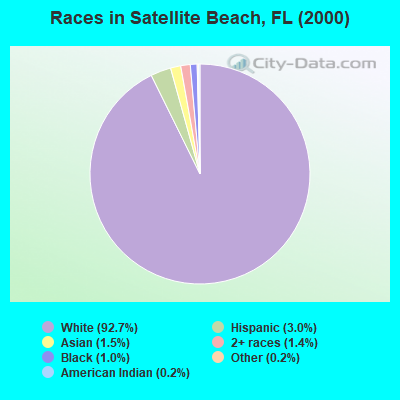
Race distribution in Satellite Beach
2000 2022
10,458,509 65.4% White alone 2,682,715 16.8% Hispanic 2,264,268 14.2% Black alone 261,693 1.6% Asian alone 236,954 1.5% Two or more races 42,358 0.3% American Indian alone 28,994 0.2% Other race alone 6,887 0.04% Native Hawaiian and Other
11,309,403 50.8% White alone 6,025,039 27.1% Hispanic 3,241,015 14.6% Black alone 861,630 3.9% Two or more races 623,692 2.8% Asian alone 152,054 0.7% Other race alone 22,504 0.1% American Indian alone 9,486 0.04% Native Hawaiian and Other
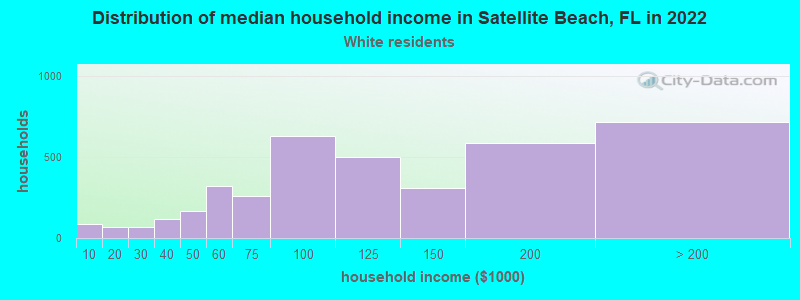
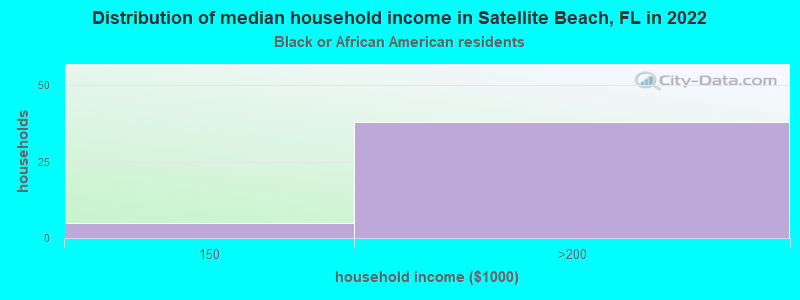
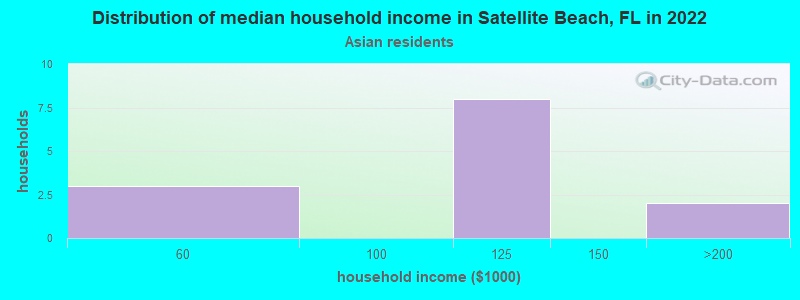
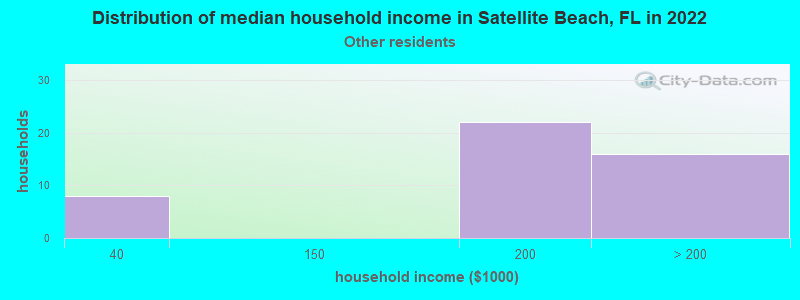
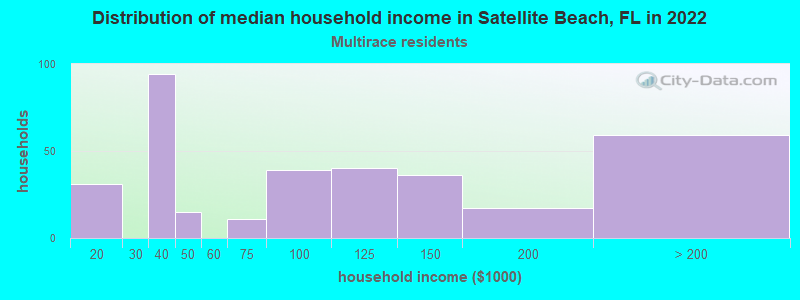
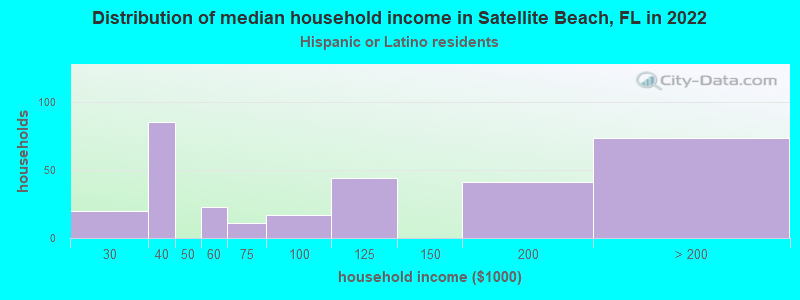
Income and house value in Satellite Beach Median household income in 2022 $107,813 White non-Hispanic householders$164,403 Black householders$134,431 Asian householdersMedian 2022 house value $521,774 White Non-Hispanic householders$570,086 Black or African American householders $525,135 Asian householders$357,091 Some other race householders$503,289 Two or more races householders$596,973 Hispanic or Latino householders
Median age by race in Satellite Beach
45.8 Median age for White residents45.2 46.1 31.0 Median age for Black or African American residents30.0 47.3 -598,566,307.6 Median age for American Indian / Alaska Native residents-611,418,047.3 -594,925,633.7 39.1 Median age for Asian residents38.6 41.9 -679,849,340.2 Median age for Native Hawaiian / Pacific Islander residents-858,307,848.3 -443,298,968.6 18.9 Median age for Other race residents36.8 12.3 23.9 Median age for Two or more races residents18.5 30.4 44.9 Median age for White alone residents43.1 45.4 33.7 Median age for Hispanic or Latino residents47.2 32.4
Owner/renter occupied households by race in Satellite Beach
House owners and renters - White residents 3,432 89.2% Owner occupied414 10.8% Renter occupiedHouse owners and renters - Black or African American residents 20 80.0% Owner occupied5 20.0% Renter occupiedHouse owners and renters - American Indian / Alaska Native residents 5 100.0% Owner occupiedHouse owners and renters - Asian residents 12 83.0% Owner occupied2 17.0% Renter occupiedHouse owners and renters - Other race residents 20 40.0% Owner occupied30 60.0% Renter occupiedHouse owners and renters - Two or more races residents 126 33.5% Owner occupied251 66.5% Renter occupiedHouse owners and renters - White alone residents 3,360 89.2% Owner occupied405 10.8% Renter occupiedHouse owners and renters - Hispanic or Latino residents 198 66.7% Owner occupied99 33.3% Renter occupied
Language usage in Satellite Beach
English speakers - Total 94.0% of residents of Satellite Beach speak English at home.
3.2% of residents speak Spanish at home 229 64.9% Speak English very well124 35.1% Speak English less than very well2.7% of residents speak other language at home 212 71.4% Speak English very well85 28.6% Speak English less than very well
English speakers - Born in the United States 96.9% of residents of Satellite Beach speak English at home.
1.8% of residents speak Spanish at home 69 58.5% Speak English very well49 41.5% Speak English less than very well1.0% of residents speak other language at home 63 91.3% Speak English very well6 8.7% Speak English less than very well
English speakers - Native, born elsewhere 97.3% of residents of Satellite Beach speak English at home.
12.5% of residents speak other language at home 28 100.0% Speak English very well
English speakers - Foreign-born 48.1% of residents of Satellite Beach speak English at home.
18.0% of residents speak Spanish at home 62 56.9% Speak English very well47 43.1% Speak English less than very well30.1% of residents speak other language at home 104 56.8% Speak English very well79 43.2% Speak English less than very well
White (Caucasian) - Speak only English Native:
99.1% (8,920)Foreign-born:
61.7% (226)
White (Caucasian) - Speak another language Native:
1.5% (136)Foreign-born:
40.7% (149)
Black or African American - Speak only English Native:
69.7% (134)Foreign-born:
92.1% (23)
Asian - Speak another language Native:
100.0% (20)Foreign-born:
50.5% (33)
Two or more races - Speak another language Native:
8.9% (81)Foreign-born:
95.3% (77)
White alone - Speak only English Native:
99.3% (8,781)Foreign-born:
53.9% (180)
White alone - Speak another language Native:
0.8% (73)Foreign-born:
46.0% (153)
Hispanic or Latino - Speak only English Native:
76.4% (642)Foreign-born:
36.2% (64)
Hispanic or Latino - Speak another language Native:
25.1% (211)Foreign-born:
61.9% (110)
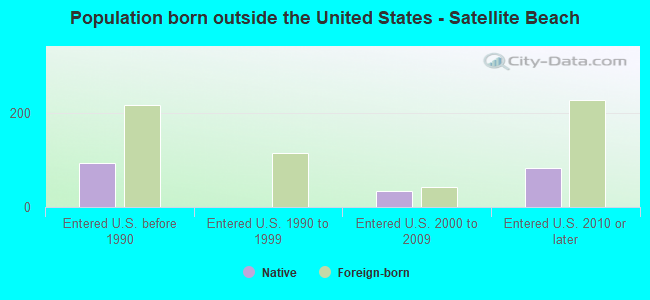
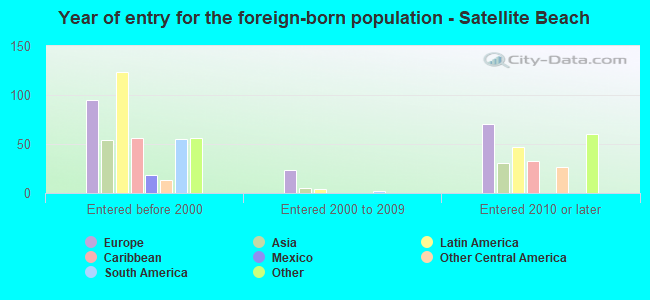
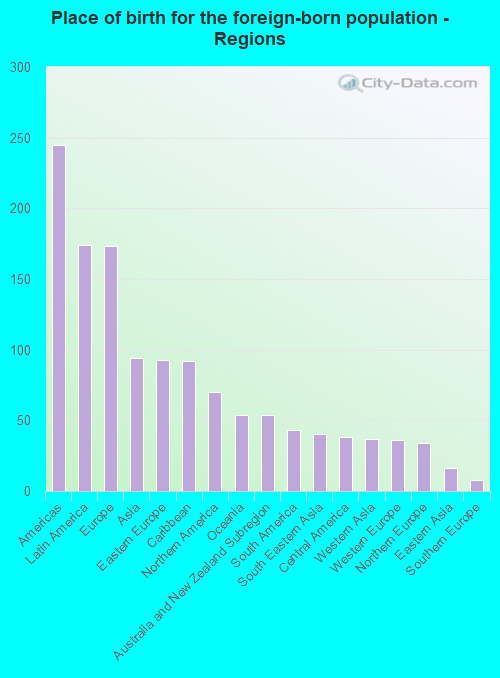
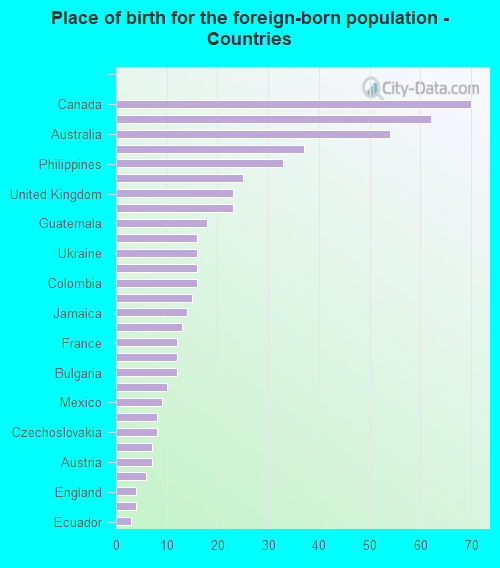
Foreign-born residents in Satellite Beach 568 residents are foreign born (1.5% Latin America , 1.5% Europe , 0.8% Asia , 0.6% North America ).
This city:
4.9%Florida:
21.1%
Marital status for residents in Satellite Beach Marital status - White (Caucasian) population 15 years and over
Males 23.1% Never married62.2% Now married1.7% Separated3.3% Widowed9.8% DivorcedFemales 17.9% Never married60.4% Now married0.9% Separated5.3% Widowed15.5% DivorcedWomen who gave birth in the past 12 months Now married:
77.1% (97)Unmarried:
22.9% (29)
Women who did not give birth in the past 12 months Now married:
59.0% (1,060)Unmarried:
41.0% (738)
Marital status - Black or African American population 15 years and over
Males 86.0% Never married14.0% Now married0.0% Separated0.0% Widowed0.0% DivorcedFemales 18.5% Never married66.7% Now married0.0% Separated0.0% Widowed14.8% DivorcedWomen who did not give birth in the past 12 months Now married:
78.3% (70)Unmarried:
21.7% (19)
Marital status - Asian population 15 years and over
Males 0.0% Never married100.0% Now married0.0% Separated0.0% Widowed0.0% DivorcedFemales 0.0% Never married100.0% Now married0.0% Separated0.0% Widowed0.0% DivorcedWomen who did not give birth in the past 12 months Now married:
100.0% (9)Unmarried:
0.0% (0)
Marital status - Other race population 15 years and over
Males 36.6% Never married63.4% Now married0.0% Separated0.0% Widowed0.0% DivorcedFemales 0.0% Never married100.0% Now married0.0% Separated0.0% Widowed0.0% DivorcedWomen who gave birth in the past 12 months Now married:
100.0% (8)Unmarried:
0.0% (0)
Women who did not give birth in the past 12 months Now married:
100.0% (25)Unmarried:
0.0% (0)
Marital status - Two or more races population 15 years and over
Males 55.7% Never married35.1% Now married0.0% Separated0.0% Widowed9.2% DivorcedFemales 71.1% Never married26.0% Now married1.6% Separated1.3% Widowed0.0% DivorcedWomen who did not give birth in the past 12 months Now married:
16.0% (62)Unmarried:
84.0% (325)
Marital status - White alone, not Hispanic / Latino population 15 years and over
Males 24.2% Never married61.8% Now married1.8% Separated2.8% Widowed9.4% DivorcedFemales 17.9% Never married60.6% Now married1.0% Separated5.5% Widowed15.1% DivorcedWomen who gave birth in the past 12 months Now married:
77.1% (101)Unmarried:
22.9% (30)
Women who did not give birth in the past 12 months Now married:
59.1% (1,063)Unmarried:
40.9% (736)
Marital status - Hispanic or Latino population 15 years and over
Males 22.6% Never married63.6% Now married0.0% Separated5.9% Widowed7.9% DivorcedFemales 49.6% Never married40.6% Now married0.0% Separated0.0% Widowed9.8% DivorcedWomen who gave birth in the past 12 months Now married:
100.0% (7)Unmarried:
0.0% (0)
Women who did not give birth in the past 12 months Now married:
32.2% (103)Unmarried:
67.8% (217)
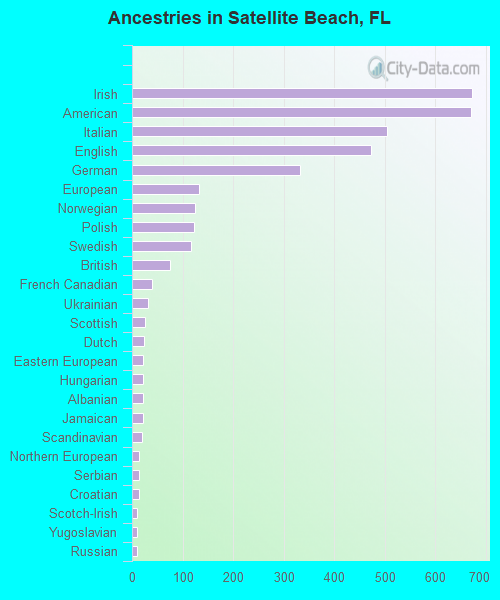
Ancestries in Satellite Beach
673 15.2% Irish672 15.2% American504 11.4% Italian474 10.7% English333 7.5% German132 3.0% European124 2.8% Norwegian122 2.8% Polish117 2.7% Swedish75 1.7% British39 0.9% French Canadian32 0.7% Ukrainian26 0.6% Scottish23 0.5% Dutch21 0.5% Eastern European21 0.5% Hungarian21 0.5% Albanian21 0.5% Jamaican19 0.4% Scandinavian13 0.3% Northern European13 0.3% Serbian13 0.3% Croatian10 0.2% Scotch-Irish10 0.2% Yugoslavian9 0.2% Russian9 0.2% Welsh8 0.2% Czech8 0.2% Lithuanian7 0.2% Greek7 0.2% French6 0.1% Nigerian5 0.1% Finnish3 0.07% African
Children Nativity (place of birth) in Satellite Beach
Children under 6 years - Living with two parents Both parents native 461 100.0% NativeOne native, one foreign-born parent 77 100.0% NativeChildren under 6 years - Living with one parent Native parent 19 100.0% NativeChildren 6 to 17 years - Living with two parents Both parents native 1,550 99.9% Native1 0.1% Foreign-bornBoth parents foreign-born 8 100.0% NativeOne native, one foreign-born parent 122 94.9% Native7 5.1% Foreign-bornChildren 6 to 17 years - Living with one parent Native parent 164 78.9% Native44 21.1% Foreign-bornForeign-born parent 131 70.4% Native55 29.6% Foreign-born
Grandparents responsible for own grandchildren in Satellite Beach
Grandparents (30 to 59 years) White / Caucasian 12 100.0% Responsible for grandchildrenBlack or African American 6 100.0% Not responsible for grandchildrenWhite alone, not Hispanic / Latino 9 100.0% Responsible for grandchildrenGrandparents (60 years and over) White / Caucasian 46 82.8% Responsible for grandchildren10 17.2% Not responsible for grandchildrenWhite alone, not Hispanic / Latino 41 83.3% Responsible for grandchildren8 16.7% Not responsible for grandchildren