Races in Sault Ste. Marie, Michigan (MI) Detailed Stats
Data:
Races - White alone (%)
Races - White alone (% change since 2000)
Races - Black alone (%)
Races - Black alone (% change since 2000)
Races - American Indian alone (%)
Races - American Indian alone (% change since 2000)
Races - Asian alone (%)
Races - Asian alone (% change since 2000)
Races - Hispanic (%)
Races - Hispanic (% change since 2000)
Races - Native Hawaiian and Other Pacific Islander alone (%)
Races - Native Hawaiian and Other Pacific Islander alone (% change since 2000)
Races - Two or more races(%)
Races - Two or more races(% change since 2000)
Races - Other race alone (%)
Races - Other race alone (% change since 2000)
Racial diversity
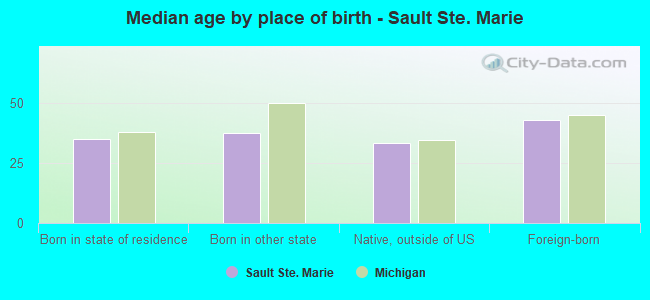
Place of birth - Born in state of residence (%)
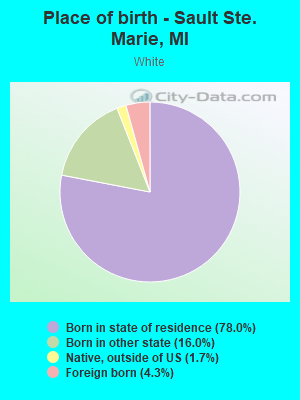
Place of birth - Born in state of residence (%) - White
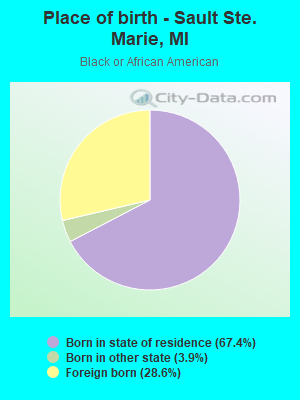
Place of birth - Born in state of residence (%) - Black or African American
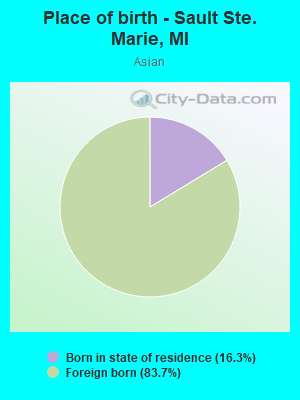
Place of birth - Born in state of residence (%) - Asian
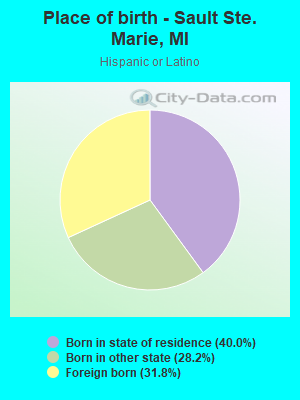
Place of birth - Born in state of residence (%) - Hispanic or Latino
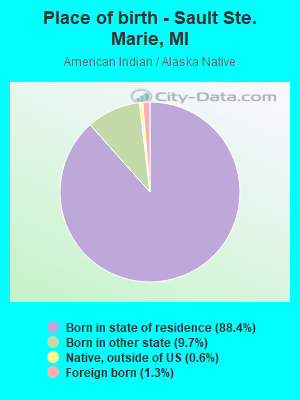
Place of birth - Born in state of residence (%) - American Indian and Alaska Native
Place of birth - Born in state of residence (%) - Multirace
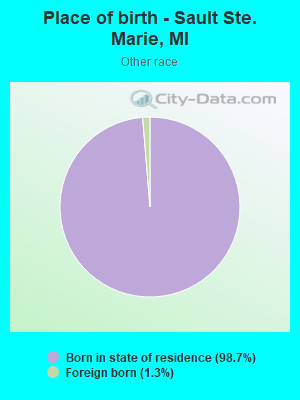
Place of birth - Born in state of residence (%) - Other Race
Place of birth - Born in other state (%)
Place of birth - Born in other state (%) - White
Place of birth - Born in other state (%) - Black or African American
Place of birth - Born in other state (%) - Asian
Place of birth - Born in other state (%) - Hispanic or Latino
Place of birth - Born in other state (%) - American Indian and Alaska Native
Place of birth - Born in other state (%) - Multirace
Place of birth - Born in other state (%) - Other Race
Place of birth - Native, outside of US (%)
Place of birth - Native, outside of US (%) - White
Place of birth - Native, outside of US (%) - Black or African American
Place of birth - Native, outside of US (%) - Asian
Place of birth - Native, outside of US (%) - Hispanic or Latino
Place of birth - Native, outside of US (%) - American Indian and Alaska Native
Place of birth - Native, outside of US (%) - Multirace
Place of birth - Native, outside of US (%) - Other Race
Place of birth - Foreign born (%)
Place of birth - Foreign born (%) - White
Place of birth - Foreign born (%) - Black or African American
Place of birth - Foreign born (%) - Asian
Place of birth - Foreign born (%) - Hispanic or Latino
Place of birth - Foreign born (%) - American Indian and Alaska Native
Place of birth - Foreign born (%) - Multirace
Place of birth - Foreign born (%) - Other Race
Residents speaking English at home (%)
Residents speaking English at home - Born in the United States (%)
Residents speaking English at home - Native, born elsewhere (%)
Residents speaking English at home - Foreign born (%)
Residents speaking Spanish at home (%)
Residents speaking Spanish at home - Born in the United States (%)
Residents speaking Spanish at home - Native, born elsewhere (%)
Residents speaking Spanish at home - Foreign born (%)
Residents speaking other language at home (%)
Residents speaking other language at home - Born in the United States (%)
Residents speaking other language at home - Native, born elsewhere (%)
Residents speaking other language at home - Foreign born (%)
Marital status - Never married (%)
Marital status - Now married (%)
Marital status - Separated (%)
Marital status - Widowed (%)
Marital status - Divorced (%)
Ancestries Reported - Arab (%)
Ancestries Reported - Czech (%)
Ancestries Reported - Danish (%)
Ancestries Reported - Dutch (%)
Ancestries Reported - English (%)
Ancestries Reported - French (%)
Ancestries Reported - French Canadian (%)
Ancestries Reported - German (%)
Ancestries Reported - Greek (%)
Ancestries Reported - Hungarian (%)
Ancestries Reported - Irish (%)
Ancestries Reported - Italian (%)
Ancestries Reported - Lithuanian (%)
Ancestries Reported - Norwegian (%)
Ancestries Reported - Polish (%)
Ancestries Reported - Portuguese (%)
Ancestries Reported - Russian (%)
Ancestries Reported - Scotch-Irish (%)
Ancestries Reported - Scottish (%)
Ancestries Reported - Slovak (%)
Ancestries Reported - Subsaharan African (%)
Ancestries Reported - Swedish (%)
Ancestries Reported - Swiss (%)
Ancestries Reported - Ukrainian (%)
Ancestries Reported - United States (%)
Ancestries Reported - Welsh (%)
Ancestries Reported - West Indian (%)
Ancestries Reported - Other (%)
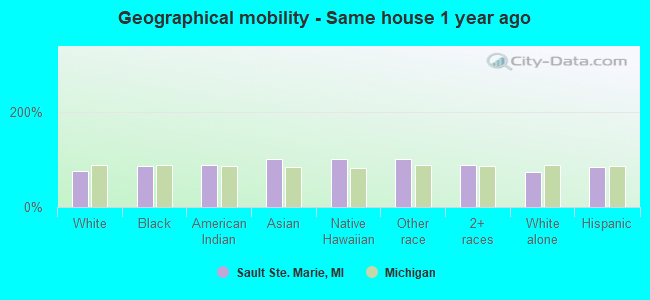
Geographical mobility - Same house 1 year ago (%)
Geographical mobility - Same house 1 year ago (%) - White
Geographical mobility - Same house 1 year ago (%) - Black or African American
Geographical mobility - Same house 1 year ago (%) - Asian
Geographical mobility - Same house 1 year ago (%) - Hispanic or Latino
Geographical mobility - Same house 1 year ago (%) - American Indian and Alaska Native
Geographical mobility - Same house 1 year ago (%) - Multirace
Geographical mobility - Same house 1 year ago (%) - Other Race
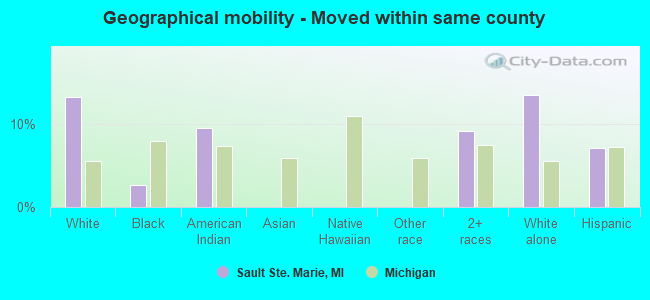
Geographical mobility - Moved within same county (%)
Geographical mobility - Moved within same county (%) - White
Geographical mobility - Moved within same county (%) - Black or African American
Geographical mobility - Moved within same county (%) - Asian
Geographical mobility - Moved within same county (%) - Hispanic or Latino
Geographical mobility - Moved within same county (%) - American Indian and Alaska Native
Geographical mobility - Moved within same county (%) - Multirace
Geographical mobility - Moved within same county (%) - Other Race
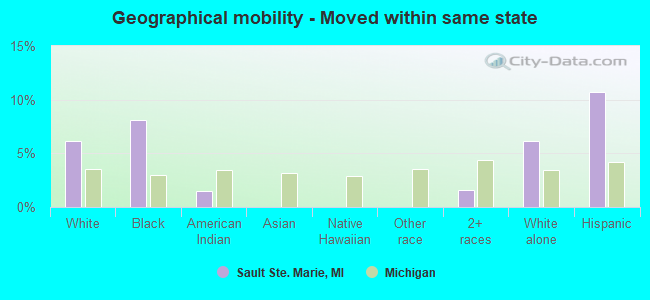
Geographical mobility - Moved from different county within same state (%)
Geographical mobility - Moved from different county within same state (%) - White
Geographical mobility - Moved from different county within same state (%) - Black or African American
Geographical mobility - Moved from different county within same state (%) - Asian
Geographical mobility - Moved from different county within same state (%) - Hispanic or Latino
Geographical mobility - Moved from different county within same state (%) - American Indian and Alaska Native
Geographical mobility - Moved from different county within same state (%) - Multirace
Geographical mobility - Moved from different county within same state (%) - Other Race
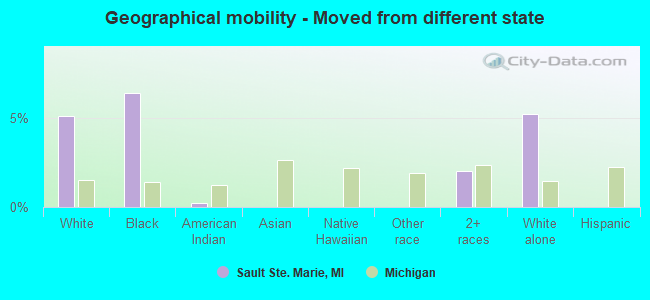
Geographical mobility - Moved from different state (%)
Geographical mobility - Moved from different state (%) - White
Geographical mobility - Moved from different state (%) - Black or African American
Geographical mobility - Moved from different state (%) - Asian
Geographical mobility - Moved from different state (%) - Hispanic or Latino
Geographical mobility - Moved from different state (%) - American Indian and Alaska Native
Geographical mobility - Moved from different state (%) - Multirace
Geographical mobility - Moved from different state (%) - Other Race
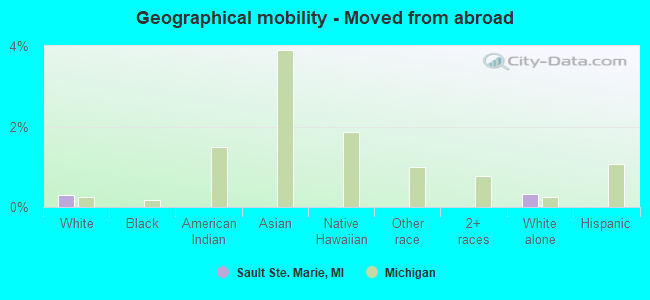
Geographical mobility - Moved from abroad (%)
Geographical mobility - Moved from abroad (%) - White
Geographical mobility - Moved from abroad (%) - Black or African American
Geographical mobility - Moved from abroad (%) - Asian
Geographical mobility - Moved from abroad (%) - Hispanic or Latino
Geographical mobility - Moved from abroad (%) - American Indian and Alaska Native
Geographical mobility - Moved from abroad (%) - Multirace
Geographical mobility - Moved from abroad (%) - Other Race
Place of birth for the foreign-born population - Ireland (%)
Place of birth for the foreign-born population - Denmark (%)
Place of birth for the foreign-born population - Norway (%)
Place of birth for the foreign-born population - Sweden (%)
Place of birth for the foreign-born population - United Kingdom (%)
Place of birth for the foreign-born population - England (%)
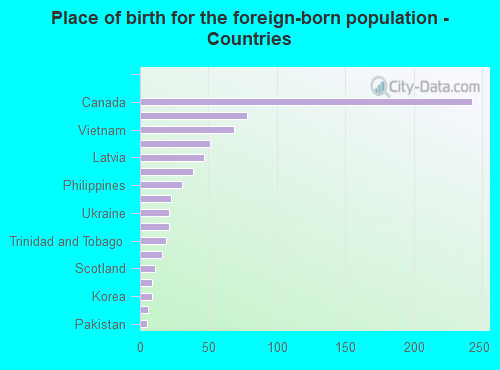
Place of birth for the foreign-born population - Scotland (%)
Place of birth for the foreign-born population - Other Northern Europe (%)
Place of birth for the foreign-born population - Austria (%)
Place of birth for the foreign-born population - Belgium (%)
Place of birth for the foreign-born population - France (%)
Place of birth for the foreign-born population - Germany (%)
Place of birth for the foreign-born population - Netherlands (%)
Place of birth for the foreign-born population - Switzerland (%)
Place of birth for the foreign-born population - Other Western Europe (%)
Place of birth for the foreign-born population - Greece (%)
Place of birth for the foreign-born population - Italy (%)
Place of birth for the foreign-born population - Portugal (%)
Place of birth for the foreign-born population - Spain (%)
Place of birth for the foreign-born population - Other Southern Europe (%)
Place of birth for the foreign-born population - Albania (%)
Place of birth for the foreign-born population - Belarus (%)
Place of birth for the foreign-born population - Bosnia and Herzegovina (%)
Place of birth for the foreign-born population - Bulgaria (%)
Place of birth for the foreign-born population - Croatia (%)
Place of birth for the foreign-born population - Czechoslovakia (%)
Place of birth for the foreign-born population - Hungary (%)
Place of birth for the foreign-born population - Latvia (%)
Place of birth for the foreign-born population - Lithuania (%)
Place of birth for the foreign-born population - North Macedonia (Macedonia) (%)
Place of birth for the foreign-born population - Moldova (%)
Place of birth for the foreign-born population - Poland (%)
Place of birth for the foreign-born population - Romania (%)
Place of birth for the foreign-born population - Russia (%)
Place of birth for the foreign-born population - Serbia (%)
Place of birth for the foreign-born population - Ukraine (%)
Place of birth for the foreign-born population - Other Eastern Europe (%)
Place of birth for the foreign-born population - China (%)
Place of birth for the foreign-born population - Hong Kong (%)
Place of birth for the foreign-born population - Taiwan (%)
Place of birth for the foreign-born population - Japan (%)
Place of birth for the foreign-born population - Korea (%)
Place of birth for the foreign-born population - Other Eastern Asia (%)
Place of birth for the foreign-born population - Afghanistan (%)
Place of birth for the foreign-born population - Bangladesh (%)
Place of birth for the foreign-born population - India (%)
Place of birth for the foreign-born population - Iran (%)
Place of birth for the foreign-born population - Kazakhstan (%)
Place of birth for the foreign-born population - Nepal (%)
Place of birth for the foreign-born population - Pakistan (%)
Place of birth for the foreign-born population - Sri Lanka (%)
Place of birth for the foreign-born population - Uzbekistan (%)
Place of birth for the foreign-born population - Other South Central Asia (%)
Place of birth for the foreign-born population - Burma (%)
Place of birth for the foreign-born population - Cambodia (%)
Place of birth for the foreign-born population - Indonesia (%)
Place of birth for the foreign-born population - Laos (%)
Place of birth for the foreign-born population - Malaysia (%)
Place of birth for the foreign-born population - Philippines (%)
Place of birth for the foreign-born population - Singapore (%)
Place of birth for the foreign-born population - Thailand (%)
Place of birth for the foreign-born population - Vietnam (%)
Place of birth for the foreign-born population - Other South Eastern Asia (%)
Place of birth for the foreign-born population - Armenia (%)
Place of birth for the foreign-born population - Iraq (%)
Place of birth for the foreign-born population - Israel (%)
Place of birth for the foreign-born population - Jordan (%)
Place of birth for the foreign-born population - Kuwait (%)
Place of birth for the foreign-born population - Lebanon (%)
Place of birth for the foreign-born population - Saudi Arabia (%)
Place of birth for the foreign-born population - Syria (%)
Place of birth for the foreign-born population - Turkey (%)
Place of birth for the foreign-born population - Yemen (%)
Place of birth for the foreign-born population - Other Western Asia (%)
Place of birth for the foreign-born population - Eritrea (%)
Place of birth for the foreign-born population - Ethiopia (%)
Place of birth for the foreign-born population - Kenya (%)
Place of birth for the foreign-born population - Somalia (%)
Place of birth for the foreign-born population - Uganda (%)
Place of birth for the foreign-born population - Zimbabwe (%)
Place of birth for the foreign-born population - Other Eastern Africa (%)
Place of birth for the foreign-born population - Cameroon (%)
Place of birth for the foreign-born population - Congo (%)
Place of birth for the foreign-born population - Democratic Republic of Congo (Zaire) (%)
Place of birth for the foreign-born population - Other Middle Africa (%)
Place of birth for the foreign-born population - Egypt (%)
Place of birth for the foreign-born population - Morocco (%)
Place of birth for the foreign-born population - Sudan (%)
Place of birth for the foreign-born population - Other Northern Africa (%)
Place of birth for the foreign-born population - South Africa (%)
Place of birth for the foreign-born population - Other Southern Africa (%)
Place of birth for the foreign-born population - Cabo Verde (%)
Place of birth for the foreign-born population - Ghana (%)
Place of birth for the foreign-born population - Liberia (%)
Place of birth for the foreign-born population - Nigeria (%)
Place of birth for the foreign-born population - Senegal (%)
Place of birth for the foreign-born population - Sierra Leone (%)
Place of birth for the foreign-born population - Other Western Africa (%)
Place of birth for the foreign-born population - Australia (%)
Place of birth for the foreign-born population - New Zealand (%)
Place of birth for the foreign-born population - Fiji (%)
Place of birth for the foreign-born population - Micronesia (%)
Place of birth for the foreign-born population - Bahamas (%)
Place of birth for the foreign-born population - Barbados (%)
Place of birth for the foreign-born population - Cuba (%)
Place of birth for the foreign-born population - Dominica (%)
Place of birth for the foreign-born population - Dominican Republic (%)
Place of birth for the foreign-born population - Grenada (%)
Place of birth for the foreign-born population - Haiti (%)
Place of birth for the foreign-born population - Jamaica (%)
Place of birth for the foreign-born population - St. Vincent and the Grenadines (%)
Place of birth for the foreign-born population - Trinidad and Tobago (%)
Place of birth for the foreign-born population - West Indies (%)
Place of birth for the foreign-born population - Other Caribbean (%)
Place of birth for the foreign-born population - Belize (%)
Place of birth for the foreign-born population - Costa Rica (%)
Place of birth for the foreign-born population - El Salvador (%)
Place of birth for the foreign-born population - Guatemala (%)
Place of birth for the foreign-born population - Honduras (%)
Place of birth for the foreign-born population - Mexico (%)
Place of birth for the foreign-born population - Nicaragua (%)
Place of birth for the foreign-born population - Panama (%)
Place of birth for the foreign-born population - Other Central America (%)
Place of birth for the foreign-born population - Argentina (%)
Place of birth for the foreign-born population - Bolivia (%)
Place of birth for the foreign-born population - Brazil (%)
Place of birth for the foreign-born population - Chile (%)
Place of birth for the foreign-born population - Colombia (%)
Place of birth for the foreign-born population - Ecuador (%)
Place of birth for the foreign-born population - Guyana (%)
Place of birth for the foreign-born population - Peru (%)
Place of birth for the foreign-born population - Uruguay (%)
Place of birth for the foreign-born population - Venezuela (%)
Place of birth for the foreign-born population - Other South America (%)
Place of birth for the foreign-born population - Canada (%)
Place of birth for the foreign-born population - Other Northern America (%)
Place of birth for the foreign-born population - Other (%)
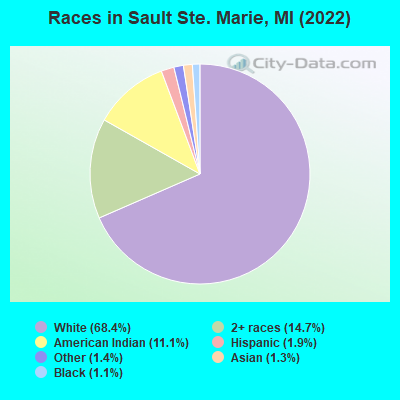
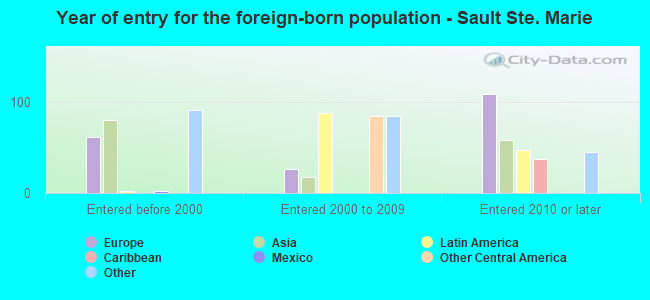
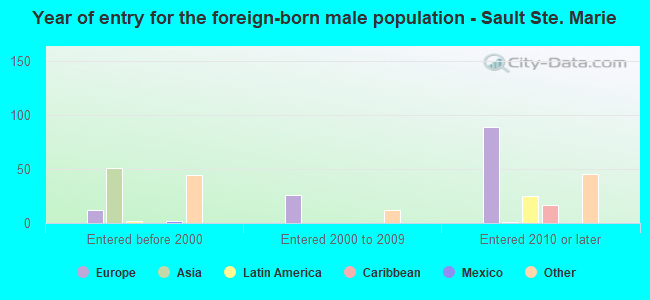
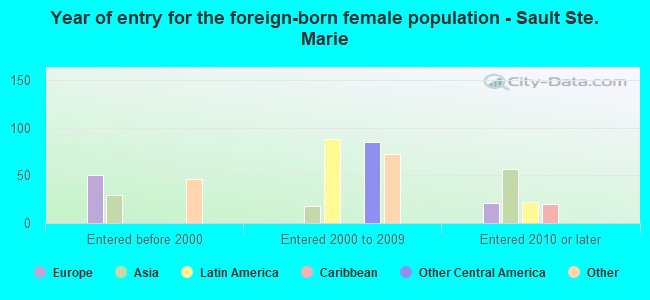
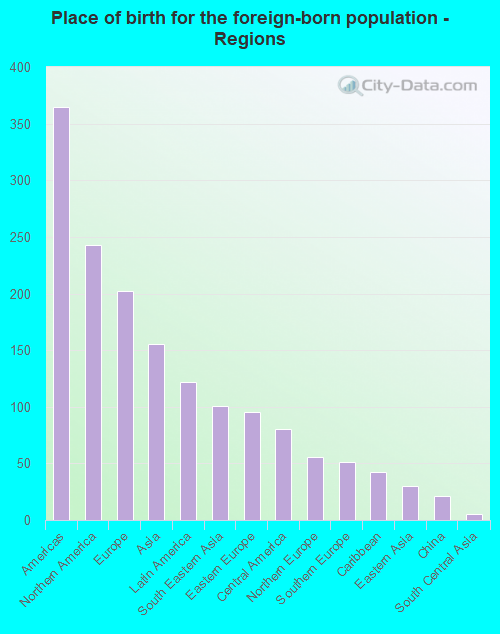
According to 2022 data, the most numerous races in Sault Ste. Marie, MI are White alone (9,150 residents), Black alone (145 residents), and Hispanic (253 residents). 94.9% of Sault Ste. Marie residents speak English at home. 5.4% of Sault Ste. Marie, MI residents are foreign-born (1.8% born in North America, 1.5% born in Europe, 1.2% born in Asia, 0.9% born in Latin America), which is 11.0% less than the foreign-born rate of 6.0% across the entire state of Michigan.
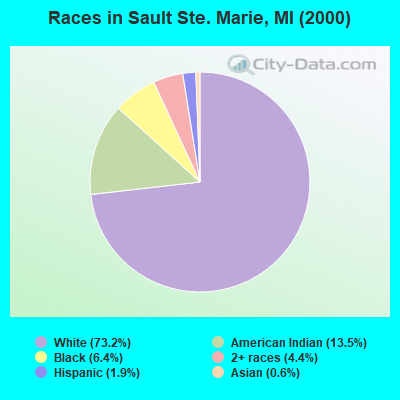
Race distribution in Sault Ste. Marie
2000 2022
7,806,691 78.6% White alone 1,402,047 14.1% Black alone 323,877 3.3% Hispanic 175,311 1.8% Asian alone 163,487 1.6% Two or more races 53,421 0.5% American Indian alone 11,465 0.1% Other race alone 2,145 0.02% Native Hawaiian and Other
7,289,051 72.6% White alone 1,310,464 13.1% Black alone 572,405 5.7% Hispanic 450,031 4.5% Two or more races 335,732 3.3% Asian alone 45,217 0.5% Other race alone 29,011 0.3% American Indian alone 2,207 0.02% Native Hawaiian and Other
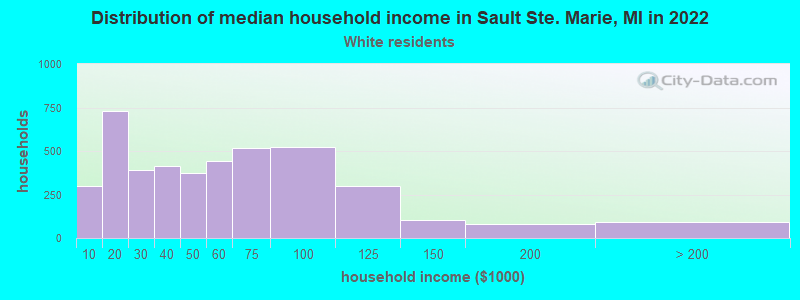
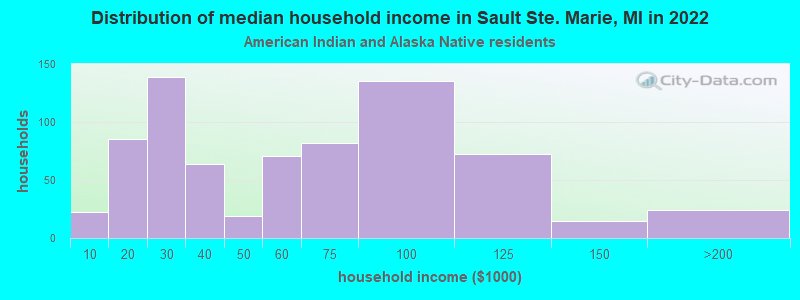
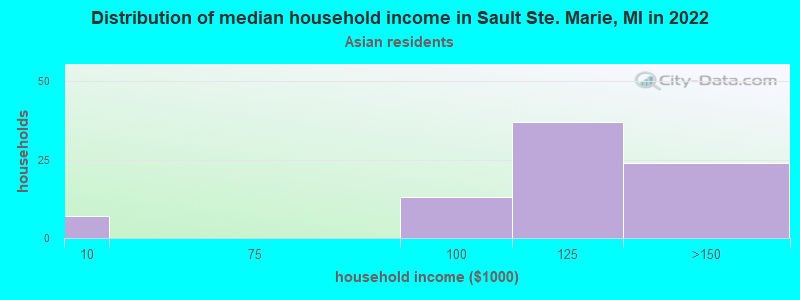
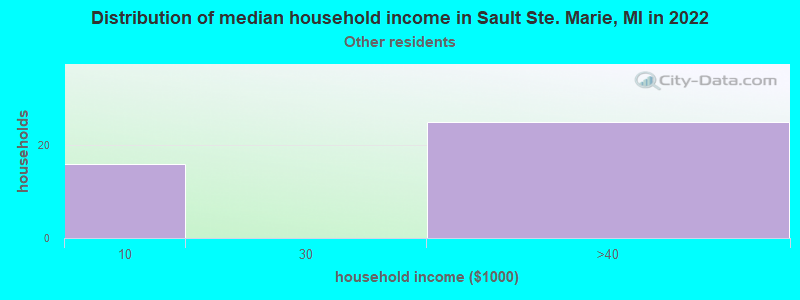
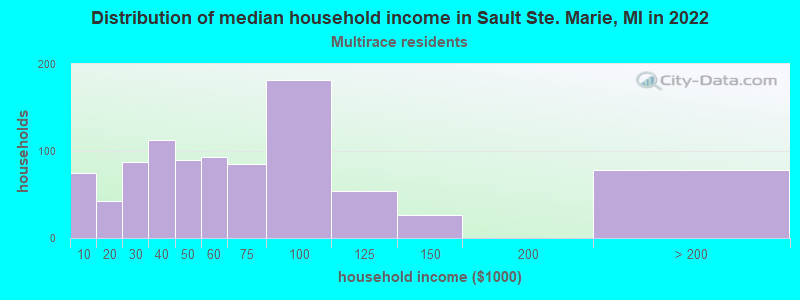
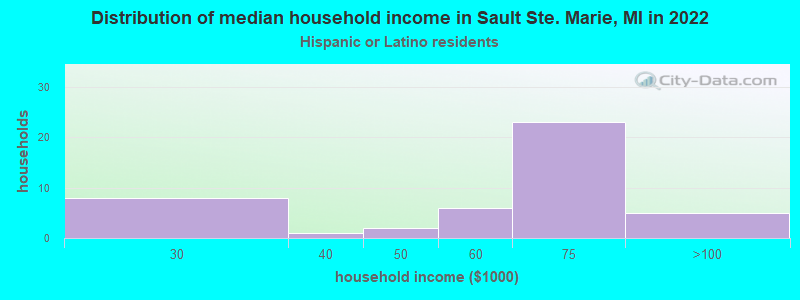
Income and house value in Sault Ste. Marie Median household income in 2022 $47,925 White non-Hispanic householders$54,930 American Indian and Alaska Native householders$111,563 Asian householders$57,976 Two or more races householders$68,206 Hispanic or Latino race householdersMedian 2022 house value $142,710 White Non-Hispanic householders$117,357 American Indian or Alaska Native householders $141,074 Asian householders$56,225 Some other race householders$120,220 Two or more races householders$56,225 Hispanic or Latino householders
Median age by race in Sault Ste. Marie
39.2 Median age for White residents34.8 46.5 21.2 Median age for Black or African American residents21.2 21.3 30.5 Median age for American Indian / Alaska Native residents30.4 30.5 41.6 Median age for Asian residents43.8 28.3 -670,531,400.3 Median age for Native Hawaiian / Pacific Islander residents-674,772,035.8 -699,588,476.7 28.7 Median age for Other race residents22.4 -696,109,357.9 31.7 Median age for Two or more races residents31.0 31.8 39.2 Median age for White alone residents34.8 46.3 34.6 Median age for Hispanic or Latino residents15.1 49.1
Owner/renter occupied households by race in Sault Ste. Marie
House owners and renters - White residents 2,456 58.3% Owner occupied1,757 41.7% Renter occupiedHouse owners and renters - Black or African American residents 25 100.0% Renter occupiedHouse owners and renters - American Indian / Alaska Native residents 507 66.8% Owner occupied253 33.2% Renter occupiedHouse owners and renters - Asian residents 49 54.7% Owner occupied40 45.3% Renter occupiedHouse owners and renters - Native Hawaiian / Pacific Islander residents 6 100.0% Owner occupiedHouse owners and renters - Other race residents 46 100.0% Renter occupiedHouse owners and renters - Two or more races residents 635 69.0% Owner occupied285 31.0% Renter occupiedHouse owners and renters - White alone residents 2,451 58.2% Owner occupied1,764 41.8% Renter occupiedHouse owners and renters - Hispanic or Latino residents 32 76.1% Owner occupied10 23.9% Renter occupied
Language usage in Sault Ste. Marie
English speakers - Total 94.9% of residents of Sault Ste. Marie speak English at home.
0.8% of residents speak Spanish at home 106 100.0% Speak English very well4.0% of residents speak other language at home 419 82.2% Speak English very well91 17.8% Speak English less than very well
English speakers - Born in the United States 96.1% of residents of Sault Ste. Marie speak English at home.
2.4% of residents speak Spanish at home 45 100.0% Speak English very well1.1% of residents speak other language at home 13 61.9% Speak English very well8 38.1% Speak English less than very well
English speakers - Native, born elsewhere 96.6% of residents of Sault Ste. Marie speak English at home.
7.5% of residents speak other language at home 11 100.0% Speak English very well
English speakers - Foreign-born 66.9% of residents of Sault Ste. Marie speak English at home.
0.3% of residents speak Spanish at home 2 100.0% Speak English very well28.3% of residents speak other language at home 137 66.8% Speak English very well68 33.2% Speak English less than very well
White (Caucasian) - Speak only English Native:
98.2% (8,157)Foreign-born:
78.2% (306)
White (Caucasian) - Speak another language Native:
1.9% (159)Foreign-born:
21.9% (86)
Black or African American - Speak only English Native:
100.0% (104)Foreign-born:
90.9% (38)
American Indian / Alaska Native - Speak only English Native:
85.1% (1,428)Foreign-born:
91.6% (21)
Asian - Speak only English Native:
96.8% (19)Foreign-born:
31.1% (46)
Other race - Speak another language Native:
35.6% (61)Foreign-born:
100.0% (2)
Two or more races - Speak only English Native:
95.6% (1,875)Foreign-born:
80.8% (91)
Two or more races - Speak another language Native:
3.2% (62)Foreign-born:
2.6% (3)
White alone - Speak only English Native:
97.9% (8,152)Foreign-born:
73.3% (308)
White alone - Speak another language Native:
2.1% (172)Foreign-born:
22.4% (94)
Hispanic or Latino - Speak only English Native:
85.8% (96)Foreign-born:
93.9% (77)
Hispanic or Latino - Speak another language Native:
14.1% (16)Foreign-born:
2.5% (2)
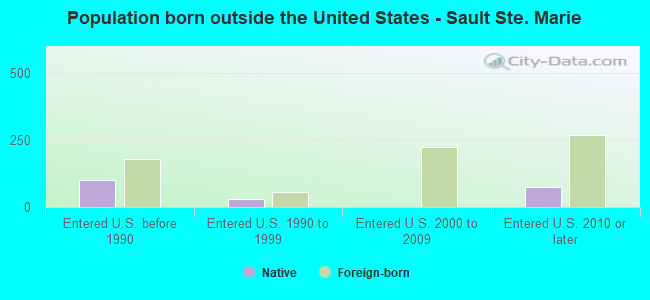
Foreign-born residents in Sault Ste. Marie 723 residents are foreign born (1.8% North America , 1.5% Europe , 1.2% Asia , 0.9% Latin America ).
This city:
5.4%Michigan:
6.9%
Marital status for residents in Sault Ste. Marie Marital status - White (Caucasian) population 15 years and over
Males 42.9% Never married36.8% Now married1.2% Separated5.8% Widowed13.3% DivorcedFemales 31.5% Never married32.5% Now married2.3% Separated16.9% Widowed16.7% DivorcedWomen who gave birth in the past 12 months Now married:
86.1% (84)Unmarried:
13.9% (13)
Women who did not give birth in the past 12 months Now married:
31.8% (582)Unmarried:
68.2% (1,247)
Marital status - Black or African American population 15 years and over
Males 71.7% Never married22.5% Now married0.0% Separated0.0% Widowed5.8% DivorcedFemales 63.3% Never married16.7% Now married0.0% Separated0.0% Widowed20.0% DivorcedWomen who did not give birth in the past 12 months Now married:
20.8% (5)Unmarried:
79.2% (18)
Marital status - American Indian / Alaska Native population 15 years and over
Males 46.6% Never married33.3% Now married4.9% Separated2.4% Widowed12.8% DivorcedFemales 44.2% Never married31.8% Now married0.0% Separated15.0% Widowed8.9% DivorcedWomen who gave birth in the past 12 months Now married:
66.0% (34)Unmarried:
34.0% (18)
Women who did not give birth in the past 12 months Now married:
28.6% (133)Unmarried:
71.4% (332)
Marital status - Asian population 15 years and over
Males 1.7% Never married89.8% Now married0.0% Separated8.5% Widowed0.0% DivorcedFemales 6.6% Never married59.2% Now married0.0% Separated9.2% Widowed25.0% DivorcedWomen who did not give birth in the past 12 months Now married:
90.0% (47)Unmarried:
10.0% (5)
Marital status - Other race population 15 years and over
Males 73.1% Never married0.0% Now married0.0% Separated0.0% Widowed26.9% DivorcedFemales 100.0% Never married0.0% Now married0.0% Separated0.0% Widowed0.0% DivorcedWomen who did not give birth in the past 12 months Now married:
0.0% (0)Unmarried:
100.0% (13)
Marital status - Two or more races population 15 years and over
Males 39.2% Never married40.9% Now married0.0% Separated0.0% Widowed19.9% DivorcedFemales 36.8% Never married38.5% Now married0.0% Separated10.2% Widowed14.5% DivorcedWomen who gave birth in the past 12 months Now married:
100.0% (45)Unmarried:
0.0% (0)
Women who did not give birth in the past 12 months Now married:
43.8% (333)Unmarried:
56.2% (426)
Marital status - White alone, not Hispanic / Latino population 15 years and over
Males 42.7% Never married37.0% Now married1.2% Separated5.8% Widowed13.2% DivorcedFemales 31.4% Never married32.8% Now married2.4% Separated16.6% Widowed16.8% DivorcedWomen who gave birth in the past 12 months Now married:
87.9% (85)Unmarried:
12.1% (12)
Women who did not give birth in the past 12 months Now married:
32.1% (590)Unmarried:
67.9% (1,250)
Marital status - Hispanic or Latino population 15 years and over
Males 66.0% Never married21.3% Now married0.0% Separated0.0% Widowed12.8% DivorcedFemales 16.7% Never married61.9% Now married0.0% Separated21.4% Widowed0.0% DivorcedWomen who gave birth in the past 12 months Now married:
0.0% (0)Unmarried:
100.0% (2)
Women who did not give birth in the past 12 months Now married:
80.4% (81)Unmarried:
19.6% (20)
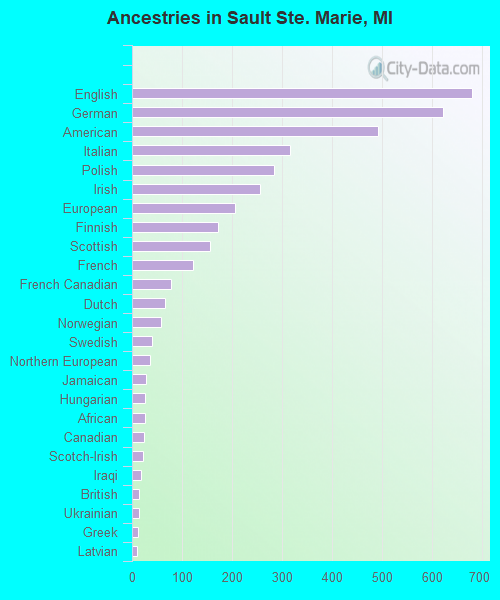
Ancestries in Sault Ste. Marie
680 11.9% English623 10.9% German493 8.6% American316 5.5% Italian284 5.0% Polish257 4.5% Irish207 3.6% European173 3.0% Finnish156 2.7% Scottish122 2.1% French79 1.4% French Canadian67 1.2% Dutch59 1.0% Norwegian41 0.7% Swedish37 0.6% Northern European28 0.5% Jamaican27 0.5% Hungarian27 0.5% African24 0.4% Canadian23 0.4% Scotch-Irish18 0.3% Iraqi15 0.3% British14 0.2% Ukrainian12 0.2% Greek10 0.2% Latvian9 0.2% West Indian8 0.1% Belgian7 0.1% Russian2 0.03% Scandinavian
Geographical mobility in Sault Ste. Marie Same house 1 year ago 6,701 74.5% White (Caucasian)124 84.5% Black or African American1,628 88.1% American Indian / Alaska Native182 100.0% Asian12 100.0% Native Hawaiian / Pacific Islander165 100.0% Other race1,944 86.6% Two or more races6,726 74.4% White alone, not Hispanic / Latino171 82.7% Hispanic or LatinoMoved within same county 1,200 13.4% White / Caucasian4 2.7% Black or African American178 9.6% American Indian / Alaska Native206 9.2% Two or more races1,229 13.6% White alone, not Hispanic / Latino15 7.2% Hispanic or LatinoMoved within same state 555 6.2% White / Caucasian12 8.1% Black or African American28 1.5% American Indian / Alaska Native36 1.6% Two or more races553 6.1% White alone, not Hispanic / Latino22 10.7% Hispanic or LatinoMoved from different state 459 5.1% White / Caucasian9 6.4% Black or African American5 0.2% American Indian / Alaska Native46 2.0% Two or more races468 5.2% White alone, not Hispanic / LatinoMoved from abroad 27 0.3% White29 0.3% White alone, not Hispanic / Latino
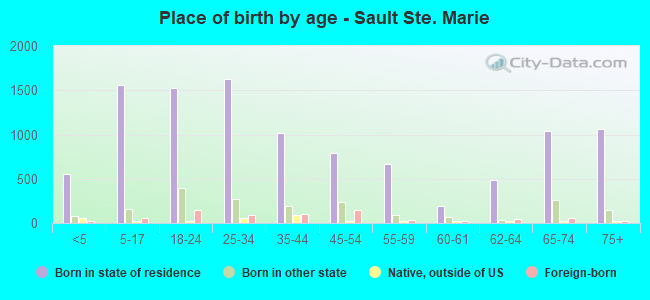
Children Nativity (place of birth) in Sault Ste. Marie
Children under 6 years - Living with two parents Both parents native 362 100.0% NativeBoth parents foreign-born 16 100.0% NativeOne native, one foreign-born parent 131 100.0% NativeChildren under 6 years - Living with one parent Native parent 279 100.0% NativeChildren 6 to 17 years - Living with two parents Both parents native 592 91.1% Native58 8.9% Foreign-bornBoth parents foreign-born 8 100.0% NativeOne native, one foreign-born parent 127 100.0% NativeChildren 6 to 17 years - Living with one parent Native parent 773 100.0% NativeForeign-born parent 17 49.3% Native18 50.7% Foreign-born
Grandparents responsible for own grandchildren in Sault Ste. Marie
Grandparents (30 to 59 years) White / Caucasian 26 90.6% Responsible for grandchildren3 9.4% Not responsible for grandchildrenAmerican Indian / Alaska Native 37 88.4% Responsible for grandchildren5 11.6% Not responsible for grandchildrenWhite alone, not Hispanic / Latino 26 90.7% Responsible for grandchildren3 9.3% Not responsible for grandchildren
Grandparents (60 years and over) White / Caucasian 22 100.0% Responsible for grandchildrenAmerican Indian / Alaska Native 19 100.0% Responsible for grandchildrenWhite alone, not Hispanic / Latino 22 100.0% Responsible for grandchildren