Races in Schenectady, New York (NY) Detailed Stats
Data:
Races - White alone (%)
Races - White alone (% change since 2000)
Races - Black alone (%)
Races - Black alone (% change since 2000)
Races - American Indian alone (%)
Races - American Indian alone (% change since 2000)
Races - Asian alone (%)
Races - Asian alone (% change since 2000)
Races - Hispanic (%)
Races - Hispanic (% change since 2000)
Races - Native Hawaiian and Other Pacific Islander alone (%)
Races - Native Hawaiian and Other Pacific Islander alone (% change since 2000)
Races - Two or more races(%)
Races - Two or more races(% change since 2000)
Races - Other race alone (%)
Races - Other race alone (% change since 2000)
Racial diversity
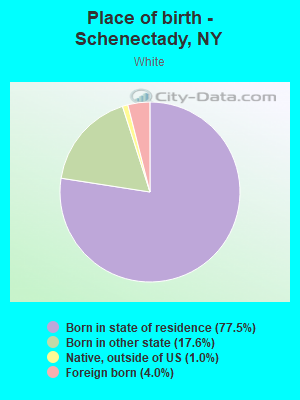
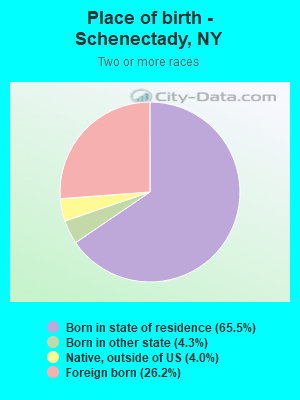
Place of birth - Born in state of residence (%)
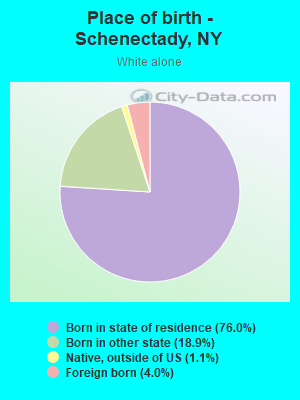
Place of birth - Born in state of residence (%) - White
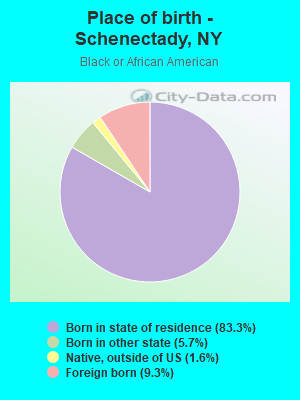
Place of birth - Born in state of residence (%) - Black or African American
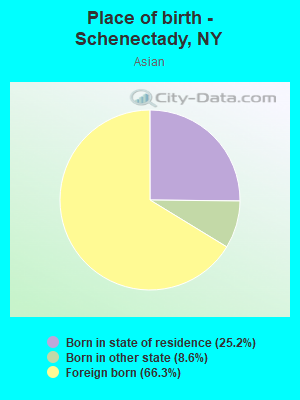
Place of birth - Born in state of residence (%) - Asian
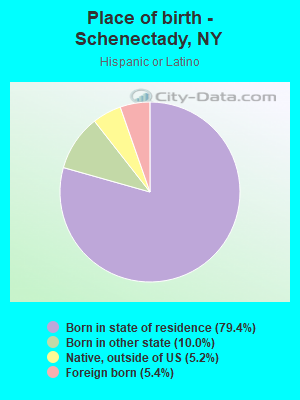
Place of birth - Born in state of residence (%) - Hispanic or Latino
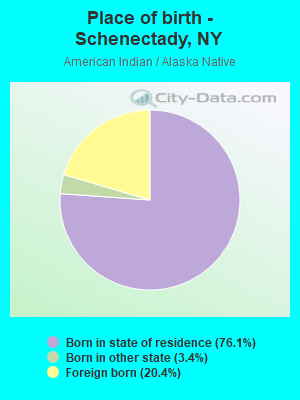
Place of birth - Born in state of residence (%) - American Indian and Alaska Native
Place of birth - Born in state of residence (%) - Multirace
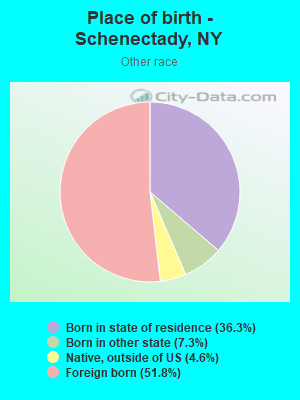
Place of birth - Born in state of residence (%) - Other Race
Place of birth - Born in other state (%)
Place of birth - Born in other state (%) - White
Place of birth - Born in other state (%) - Black or African American
Place of birth - Born in other state (%) - Asian
Place of birth - Born in other state (%) - Hispanic or Latino
Place of birth - Born in other state (%) - American Indian and Alaska Native
Place of birth - Born in other state (%) - Multirace
Place of birth - Born in other state (%) - Other Race
Place of birth - Native, outside of US (%)
Place of birth - Native, outside of US (%) - White
Place of birth - Native, outside of US (%) - Black or African American
Place of birth - Native, outside of US (%) - Asian
Place of birth - Native, outside of US (%) - Hispanic or Latino
Place of birth - Native, outside of US (%) - American Indian and Alaska Native
Place of birth - Native, outside of US (%) - Multirace
Place of birth - Native, outside of US (%) - Other Race
Place of birth - Foreign born (%)
Place of birth - Foreign born (%) - White
Place of birth - Foreign born (%) - Black or African American
Place of birth - Foreign born (%) - Asian
Place of birth - Foreign born (%) - Hispanic or Latino
Place of birth - Foreign born (%) - American Indian and Alaska Native
Place of birth - Foreign born (%) - Multirace
Place of birth - Foreign born (%) - Other Race
Residents speaking English at home (%)
Residents speaking English at home - Born in the United States (%)
Residents speaking English at home - Native, born elsewhere (%)
Residents speaking English at home - Foreign born (%)
Residents speaking Spanish at home (%)
Residents speaking Spanish at home - Born in the United States (%)
Residents speaking Spanish at home - Native, born elsewhere (%)
Residents speaking Spanish at home - Foreign born (%)
Residents speaking other language at home (%)
Residents speaking other language at home - Born in the United States (%)
Residents speaking other language at home - Native, born elsewhere (%)
Residents speaking other language at home - Foreign born (%)
Marital status - Never married (%)
Marital status - Now married (%)
Marital status - Separated (%)
Marital status - Widowed (%)
Marital status - Divorced (%)
Ancestries Reported - Arab (%)
Ancestries Reported - Czech (%)
Ancestries Reported - Danish (%)
Ancestries Reported - Dutch (%)
Ancestries Reported - English (%)
Ancestries Reported - French (%)
Ancestries Reported - French Canadian (%)
Ancestries Reported - German (%)
Ancestries Reported - Greek (%)
Ancestries Reported - Hungarian (%)
Ancestries Reported - Irish (%)
Ancestries Reported - Italian (%)
Ancestries Reported - Lithuanian (%)
Ancestries Reported - Norwegian (%)
Ancestries Reported - Polish (%)
Ancestries Reported - Portuguese (%)
Ancestries Reported - Russian (%)
Ancestries Reported - Scotch-Irish (%)
Ancestries Reported - Scottish (%)
Ancestries Reported - Slovak (%)
Ancestries Reported - Subsaharan African (%)
Ancestries Reported - Swedish (%)
Ancestries Reported - Swiss (%)
Ancestries Reported - Ukrainian (%)
Ancestries Reported - United States (%)
Ancestries Reported - Welsh (%)
Ancestries Reported - West Indian (%)
Ancestries Reported - Other (%)
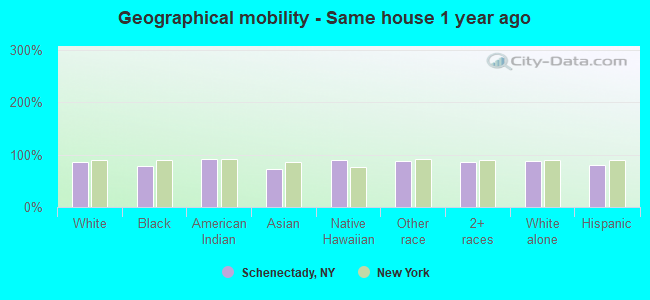
Geographical mobility - Same house 1 year ago (%)
Geographical mobility - Same house 1 year ago (%) - White
Geographical mobility - Same house 1 year ago (%) - Black or African American
Geographical mobility - Same house 1 year ago (%) - Asian
Geographical mobility - Same house 1 year ago (%) - Hispanic or Latino
Geographical mobility - Same house 1 year ago (%) - American Indian and Alaska Native
Geographical mobility - Same house 1 year ago (%) - Multirace
Geographical mobility - Same house 1 year ago (%) - Other Race
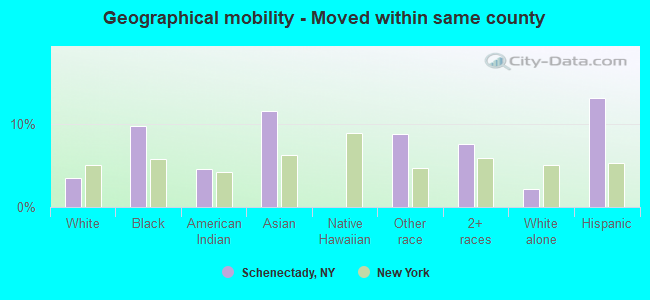
Geographical mobility - Moved within same county (%)
Geographical mobility - Moved within same county (%) - White
Geographical mobility - Moved within same county (%) - Black or African American
Geographical mobility - Moved within same county (%) - Asian
Geographical mobility - Moved within same county (%) - Hispanic or Latino
Geographical mobility - Moved within same county (%) - American Indian and Alaska Native
Geographical mobility - Moved within same county (%) - Multirace
Geographical mobility - Moved within same county (%) - Other Race
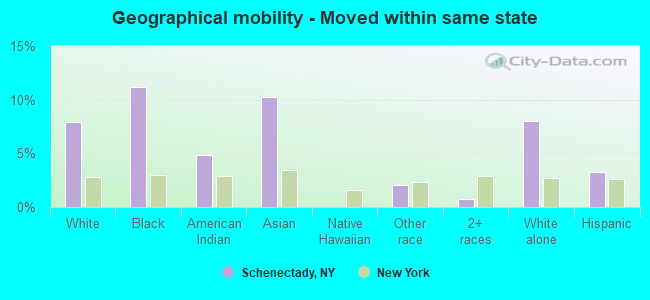
Geographical mobility - Moved from different county within same state (%)
Geographical mobility - Moved from different county within same state (%) - White
Geographical mobility - Moved from different county within same state (%) - Black or African American
Geographical mobility - Moved from different county within same state (%) - Asian
Geographical mobility - Moved from different county within same state (%) - Hispanic or Latino
Geographical mobility - Moved from different county within same state (%) - American Indian and Alaska Native
Geographical mobility - Moved from different county within same state (%) - Multirace
Geographical mobility - Moved from different county within same state (%) - Other Race
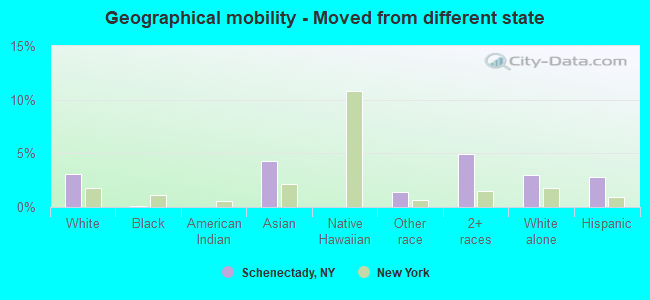
Geographical mobility - Moved from different state (%)
Geographical mobility - Moved from different state (%) - White
Geographical mobility - Moved from different state (%) - Black or African American
Geographical mobility - Moved from different state (%) - Asian
Geographical mobility - Moved from different state (%) - Hispanic or Latino
Geographical mobility - Moved from different state (%) - American Indian and Alaska Native
Geographical mobility - Moved from different state (%) - Multirace
Geographical mobility - Moved from different state (%) - Other Race
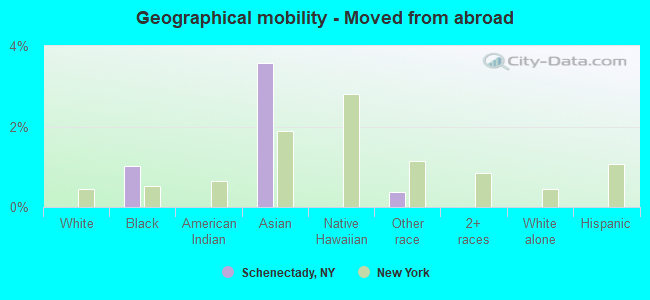
Geographical mobility - Moved from abroad (%)
Geographical mobility - Moved from abroad (%) - White
Geographical mobility - Moved from abroad (%) - Black or African American
Geographical mobility - Moved from abroad (%) - Asian
Geographical mobility - Moved from abroad (%) - Hispanic or Latino
Geographical mobility - Moved from abroad (%) - American Indian and Alaska Native
Geographical mobility - Moved from abroad (%) - Multirace
Geographical mobility - Moved from abroad (%) - Other Race
Place of birth for the foreign-born population - Ireland (%)
Place of birth for the foreign-born population - Denmark (%)
Place of birth for the foreign-born population - Norway (%)
Place of birth for the foreign-born population - Sweden (%)
Place of birth for the foreign-born population - United Kingdom (%)
Place of birth for the foreign-born population - England (%)
Place of birth for the foreign-born population - Scotland (%)
Place of birth for the foreign-born population - Other Northern Europe (%)
Place of birth for the foreign-born population - Austria (%)
Place of birth for the foreign-born population - Belgium (%)
Place of birth for the foreign-born population - France (%)
Place of birth for the foreign-born population - Germany (%)
Place of birth for the foreign-born population - Netherlands (%)
Place of birth for the foreign-born population - Switzerland (%)
Place of birth for the foreign-born population - Other Western Europe (%)
Place of birth for the foreign-born population - Greece (%)
Place of birth for the foreign-born population - Italy (%)
Place of birth for the foreign-born population - Portugal (%)
Place of birth for the foreign-born population - Spain (%)
Place of birth for the foreign-born population - Other Southern Europe (%)
Place of birth for the foreign-born population - Albania (%)
Place of birth for the foreign-born population - Belarus (%)
Place of birth for the foreign-born population - Bosnia and Herzegovina (%)
Place of birth for the foreign-born population - Bulgaria (%)
Place of birth for the foreign-born population - Croatia (%)
Place of birth for the foreign-born population - Czechoslovakia (%)
Place of birth for the foreign-born population - Hungary (%)
Place of birth for the foreign-born population - Latvia (%)
Place of birth for the foreign-born population - Lithuania (%)
Place of birth for the foreign-born population - North Macedonia (Macedonia) (%)
Place of birth for the foreign-born population - Moldova (%)
Place of birth for the foreign-born population - Poland (%)
Place of birth for the foreign-born population - Romania (%)
Place of birth for the foreign-born population - Russia (%)
Place of birth for the foreign-born population - Serbia (%)
Place of birth for the foreign-born population - Ukraine (%)
Place of birth for the foreign-born population - Other Eastern Europe (%)
Place of birth for the foreign-born population - China (%)
Place of birth for the foreign-born population - Hong Kong (%)
Place of birth for the foreign-born population - Taiwan (%)
Place of birth for the foreign-born population - Japan (%)
Place of birth for the foreign-born population - Korea (%)
Place of birth for the foreign-born population - Other Eastern Asia (%)
Place of birth for the foreign-born population - Afghanistan (%)
Place of birth for the foreign-born population - Bangladesh (%)
Place of birth for the foreign-born population - India (%)
Place of birth for the foreign-born population - Iran (%)
Place of birth for the foreign-born population - Kazakhstan (%)
Place of birth for the foreign-born population - Nepal (%)
Place of birth for the foreign-born population - Pakistan (%)
Place of birth for the foreign-born population - Sri Lanka (%)
Place of birth for the foreign-born population - Uzbekistan (%)
Place of birth for the foreign-born population - Other South Central Asia (%)
Place of birth for the foreign-born population - Burma (%)
Place of birth for the foreign-born population - Cambodia (%)
Place of birth for the foreign-born population - Indonesia (%)
Place of birth for the foreign-born population - Laos (%)
Place of birth for the foreign-born population - Malaysia (%)
Place of birth for the foreign-born population - Philippines (%)
Place of birth for the foreign-born population - Singapore (%)
Place of birth for the foreign-born population - Thailand (%)
Place of birth for the foreign-born population - Vietnam (%)
Place of birth for the foreign-born population - Other South Eastern Asia (%)
Place of birth for the foreign-born population - Armenia (%)
Place of birth for the foreign-born population - Iraq (%)
Place of birth for the foreign-born population - Israel (%)
Place of birth for the foreign-born population - Jordan (%)
Place of birth for the foreign-born population - Kuwait (%)
Place of birth for the foreign-born population - Lebanon (%)
Place of birth for the foreign-born population - Saudi Arabia (%)
Place of birth for the foreign-born population - Syria (%)
Place of birth for the foreign-born population - Turkey (%)
Place of birth for the foreign-born population - Yemen (%)
Place of birth for the foreign-born population - Other Western Asia (%)
Place of birth for the foreign-born population - Eritrea (%)
Place of birth for the foreign-born population - Ethiopia (%)
Place of birth for the foreign-born population - Kenya (%)
Place of birth for the foreign-born population - Somalia (%)
Place of birth for the foreign-born population - Uganda (%)
Place of birth for the foreign-born population - Zimbabwe (%)
Place of birth for the foreign-born population - Other Eastern Africa (%)
Place of birth for the foreign-born population - Cameroon (%)
Place of birth for the foreign-born population - Congo (%)
Place of birth for the foreign-born population - Democratic Republic of Congo (Zaire) (%)
Place of birth for the foreign-born population - Other Middle Africa (%)
Place of birth for the foreign-born population - Egypt (%)
Place of birth for the foreign-born population - Morocco (%)
Place of birth for the foreign-born population - Sudan (%)
Place of birth for the foreign-born population - Other Northern Africa (%)
Place of birth for the foreign-born population - South Africa (%)
Place of birth for the foreign-born population - Other Southern Africa (%)
Place of birth for the foreign-born population - Cabo Verde (%)
Place of birth for the foreign-born population - Ghana (%)
Place of birth for the foreign-born population - Liberia (%)
Place of birth for the foreign-born population - Nigeria (%)
Place of birth for the foreign-born population - Senegal (%)
Place of birth for the foreign-born population - Sierra Leone (%)
Place of birth for the foreign-born population - Other Western Africa (%)
Place of birth for the foreign-born population - Australia (%)
Place of birth for the foreign-born population - New Zealand (%)
Place of birth for the foreign-born population - Fiji (%)
Place of birth for the foreign-born population - Micronesia (%)
Place of birth for the foreign-born population - Bahamas (%)
Place of birth for the foreign-born population - Barbados (%)
Place of birth for the foreign-born population - Cuba (%)
Place of birth for the foreign-born population - Dominica (%)
Place of birth for the foreign-born population - Dominican Republic (%)
Place of birth for the foreign-born population - Grenada (%)
Place of birth for the foreign-born population - Haiti (%)
Place of birth for the foreign-born population - Jamaica (%)
Place of birth for the foreign-born population - St. Vincent and the Grenadines (%)
Place of birth for the foreign-born population - Trinidad and Tobago (%)
Place of birth for the foreign-born population - West Indies (%)
Place of birth for the foreign-born population - Other Caribbean (%)
Place of birth for the foreign-born population - Belize (%)
Place of birth for the foreign-born population - Costa Rica (%)
Place of birth for the foreign-born population - El Salvador (%)
Place of birth for the foreign-born population - Guatemala (%)
Place of birth for the foreign-born population - Honduras (%)
Place of birth for the foreign-born population - Mexico (%)
Place of birth for the foreign-born population - Nicaragua (%)
Place of birth for the foreign-born population - Panama (%)
Place of birth for the foreign-born population - Other Central America (%)
Place of birth for the foreign-born population - Argentina (%)
Place of birth for the foreign-born population - Bolivia (%)
Place of birth for the foreign-born population - Brazil (%)
Place of birth for the foreign-born population - Chile (%)
Place of birth for the foreign-born population - Colombia (%)
Place of birth for the foreign-born population - Ecuador (%)
Place of birth for the foreign-born population - Guyana (%)
Place of birth for the foreign-born population - Peru (%)
Place of birth for the foreign-born population - Uruguay (%)
Place of birth for the foreign-born population - Venezuela (%)
Place of birth for the foreign-born population - Other South America (%)
Place of birth for the foreign-born population - Canada (%)
Place of birth for the foreign-born population - Other Northern America (%)
Place of birth for the foreign-born population - Other (%)
Latest news about races in Schenectady, NY collected exclusively by city-data.com from local newspapers, TV, and radio stations
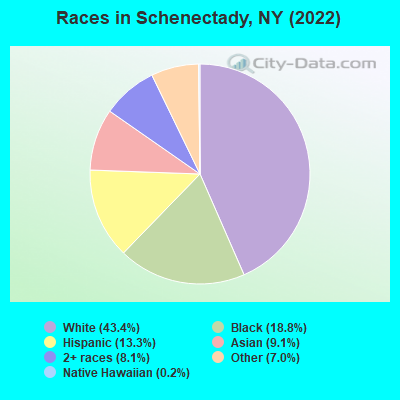
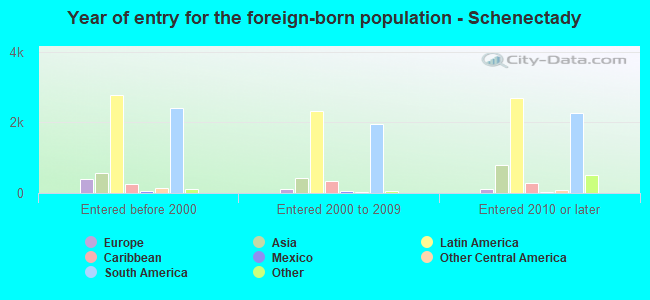
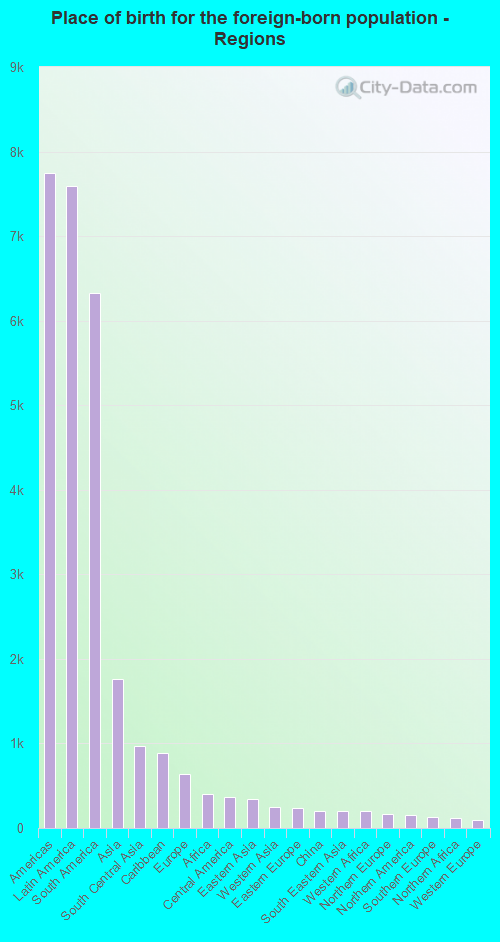
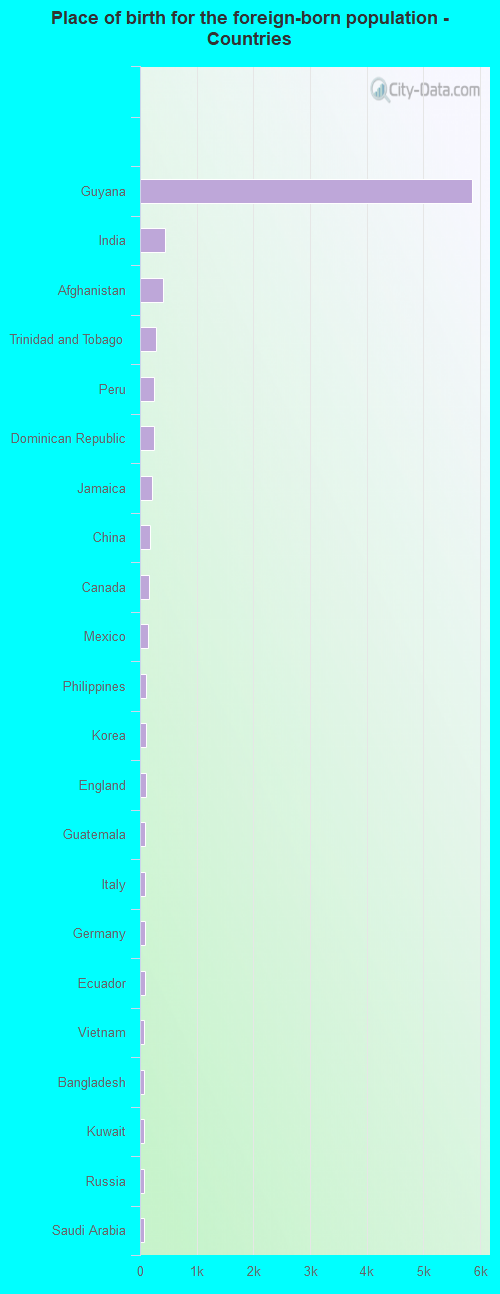
According to 2022 data, the most numerous races in Schenectady, NY are White alone (29,870 residents), Hispanic (9,161 residents), and Black alone (12,948 residents). 89.2% of Schenectady residents speak English at home. 15.3% of Schenectady, NY residents are foreign-born (11.2% born in Latin America, 2.6% born in Asia), which is 43.3% less than the foreign-born rate of 22.0% across the entire state of New York.
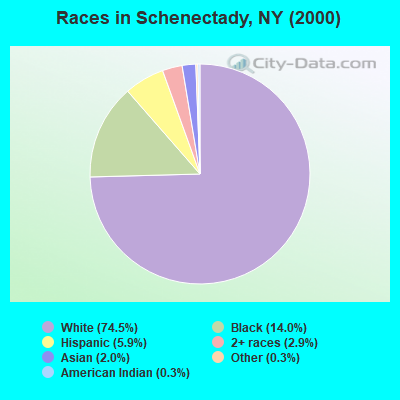
Race distribution in Schenectady
2000 2022
46,069 74.5% White alone 8,651 14.0% Black alone 3,632 5.9% Hispanic 1,813 2.9% Two or more races 1,222 2.0% Asian alone 210 0.3% Other race alone 204 0.3% American Indian alone 20 0.03% Native Hawaiian and Other
29,870 43.4% White alone 12,948 18.8% Black alone 9,161 13.3% Hispanic 6,244 9.1% Asian alone 5,585 8.1% Two or more races 4,807 7.0% Other race alone 172 0.2% Native Hawaiian and Other 23 0.03% American Indian alone
2000 2022
11,760,981 62.0% White alone 2,867,583 15.1% Hispanic 2,812,623 14.8% Black alone 1,035,926 5.5% Asian alone 366,116 1.9% Two or more races 75,499 0.4% Other race alone 52,499 0.3% American Indian alone 5,230 0.03% Native Hawaiian and Other
10,408,933 52.9% White alone 3,867,299 19.7% Hispanic 2,633,840 13.4% Black alone 1,776,286 9.0% Asian alone 732,670 3.7% Two or more races 216,110 1.1% Other race alone 35,082 0.2% American Indian alone 6,931 0.04% Native Hawaiian and Other
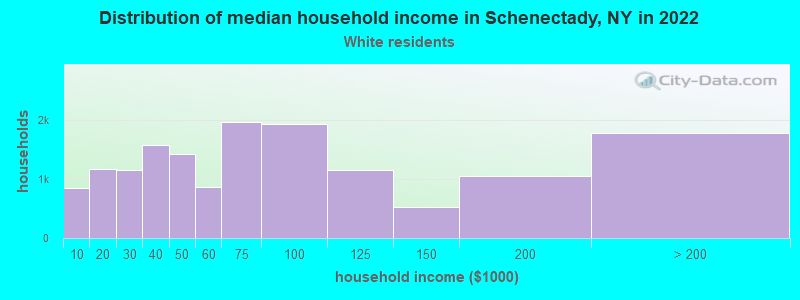
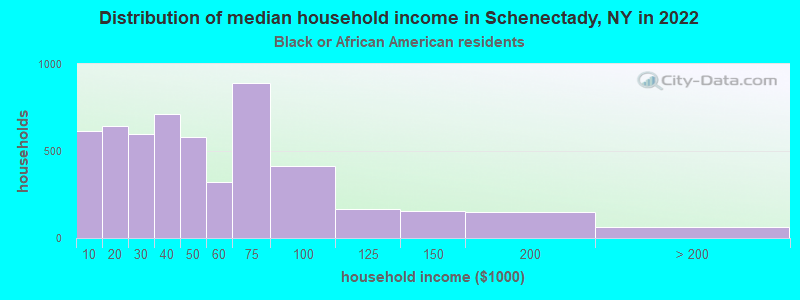
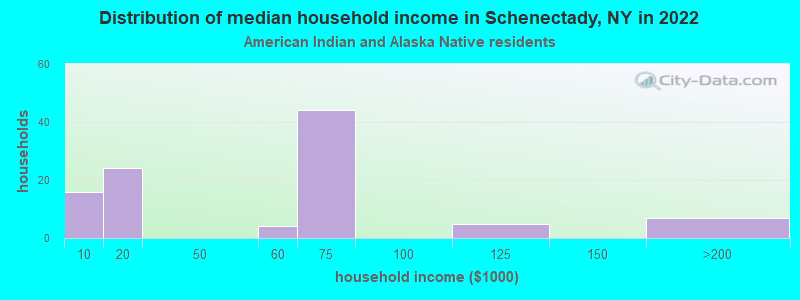
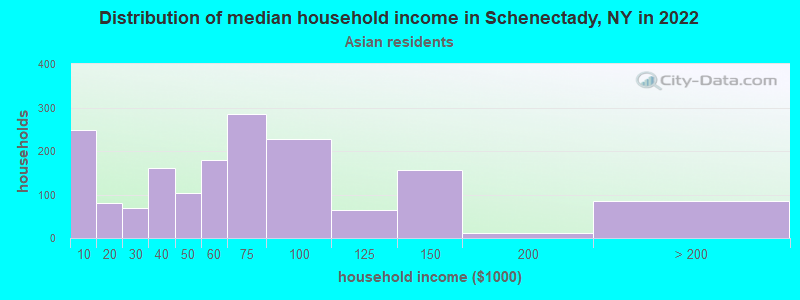
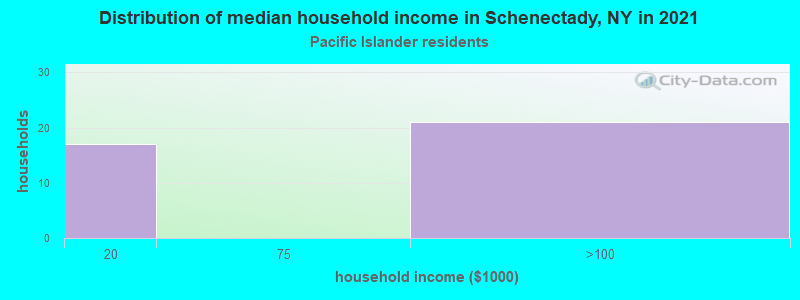
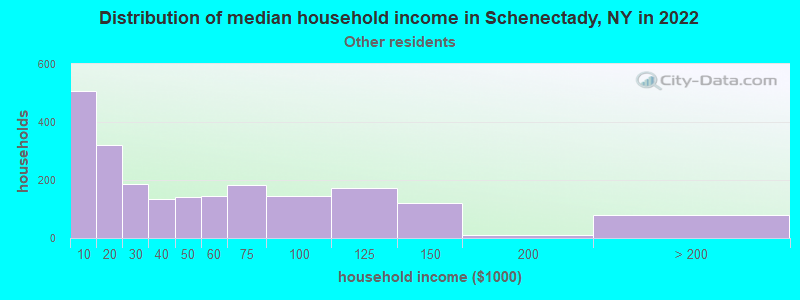
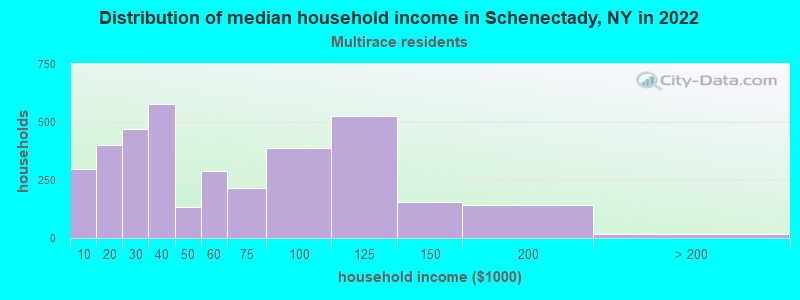
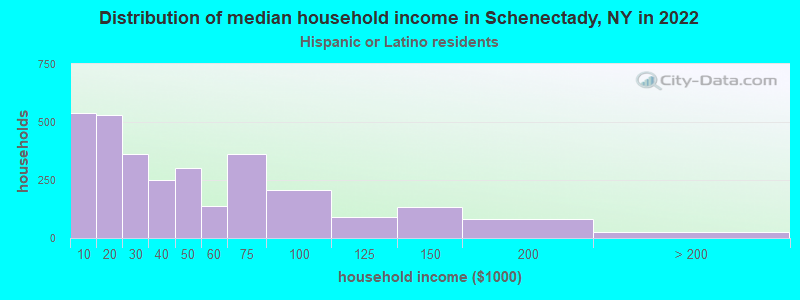
Income and house value in Schenectady Median household income in 2022 $64,221 White non-Hispanic householders$37,857 Black householders$43,472 Asian householders$51,426 Some other race householders$52,120 Two or more races householders$48,028 Hispanic or Latino race householdersMedian 2022 house value $171,446 White Non-Hispanic householders$157,319 Black or African American householders$227,478 American Indian or Alaska Native householders $212,153 Asian householders$838,078 Native Hawaiian and other Pacific Islander householders$157,079 Some other race householders$148,220 Two or more races householders$157,079 Hispanic or Latino householders
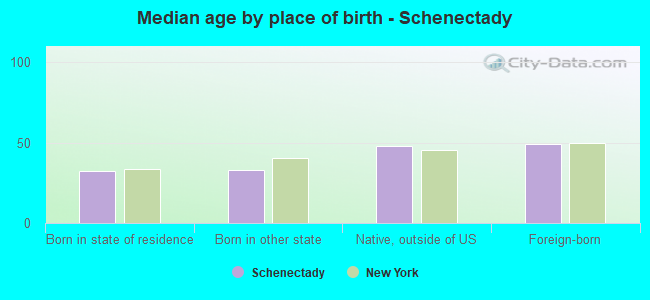
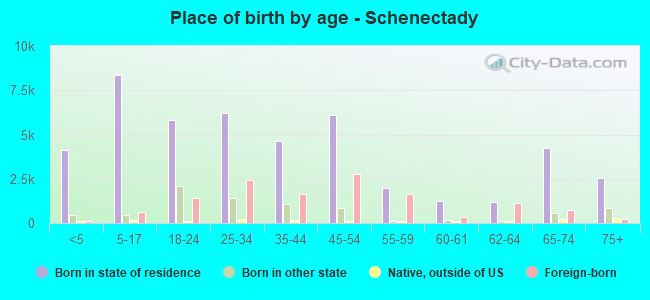
Median age by race in Schenectady
42.1 Median age for White residents37.5 45.9 32.6 Median age for Black or African American residents35.6 30.2 25.5 Median age for American Indian / Alaska Native residents25.2 -666,666,666.0 33.6 Median age for Asian residents33.8 33.4 -666,666,666.0 Median age for Native Hawaiian / Pacific Islander residents-666,666,666.0 -666,666,666.0 45.3 Median age for Other race residents35.6 47.5 25.2 Median age for Two or more races residents23.0 25.6 42.8 Median age for White alone residents40.0 48.9 25.4 Median age for Hispanic or Latino residents25.5 23.9
Owner/renter occupied households by race in Schenectady
House owners and renters - White residents 9,694 62.7% Owner occupied5,768 37.3% Renter occupiedHouse owners and renters - Black or African American residents 1,629 26.6% Owner occupied4,487 73.4% Renter occupiedHouse owners and renters - American Indian / Alaska Native residents 27 25.2% Owner occupied79 74.8% Renter occupiedHouse owners and renters - Asian residents 965 50.0% Owner occupied964 50.0% Renter occupiedHouse owners and renters - Native Hawaiian / Pacific Islander residents 36 59.9% Owner occupied24 40.1% Renter occupiedHouse owners and renters - Other race residents 1,177 48.9% Owner occupied1,229 51.1% Renter occupiedHouse owners and renters - Two or more races residents 756 46.6% Owner occupied865 53.4% Renter occupiedHouse owners and renters - White alone residents 9,432 63.4% Owner occupied5,445 36.6% Renter occupiedHouse owners and renters - Hispanic or Latino residents 395 13.6% Owner occupied2,504 86.4% Renter occupied
Language usage in Schenectady
English speakers - Total 89.2% of residents of Schenectady speak English at home.
4.1% of residents speak Spanish at home 1,555 58.5% Speak English very well1,105 41.5% Speak English less than very well6.7% of residents speak other language at home 2,783 65.0% Speak English very well1,496 35.0% Speak English less than very well
English speakers - Born in the United States 93.8% of residents of Schenectady speak English at home.
3.3% of residents speak Spanish at home 250 100.0% Speak English very well3.0% of residents speak other language at home 227 100.0% Speak English very well
English speakers - Native, born elsewhere 56.2% of residents of Schenectady speak English at home.
39.1% of residents speak Spanish at home 197 41.2% Speak English very well281 58.8% Speak English less than very well4.7% of residents speak other language at home 57 100.0% Speak English very well
English speakers - Foreign-born 72.0% of residents of Schenectady speak English at home.
3.3% of residents speak Spanish at home 312 73.4% Speak English very well113 26.6% Speak English less than very well24.7% of residents speak other language at home 1,683 52.9% Speak English very well1,496 47.1% Speak English less than very well
White (Caucasian) - Speak only English Native:
95.7% (30,403)Foreign-born:
49.6% (625)
White (Caucasian) - Speak another language Native:
4.4% (1,382)Foreign-born:
50.5% (636)
Black or African American - Speak only English Native:
98.3% (11,176)Foreign-born:
100.0% (1,390)
Black or African American - Speak another language Native:
1.9% (211)Foreign-born:
42.2% (587)
American Indian / Alaska Native - Speak only English Native:
76.1% (244)Foreign-born:
13.9% (15)
American Indian / Alaska Native - Speak another language Native:
18.2% (58)Foreign-born:
83.8% (89)
Asian - Speak only English Native:
87.4% (1,203)Foreign-born:
57.5% (2,380)
Asian - Speak another language Native:
12.6% (174)Foreign-born:
42.5% (1,757)
Other race - Speak only English Native:
77.0% (2,725)Foreign-born:
90.3% (3,801)
Other race - Speak another language Native:
22.5% (796)Foreign-born:
10.7% (449)
Two or more races - Speak only English Native:
86.1% (3,869)Foreign-born:
97.1% (1,872)
Two or more races - Speak another language Native:
13.9% (625)Foreign-born:
2.9% (56)
White alone - Speak only English Native:
96.9% (29,348)Foreign-born:
52.4% (610)
White alone - Speak another language Native:
3.1% (953)Foreign-born:
47.0% (548)
Hispanic or Latino - Speak only English Native:
79.6% (6,067)Foreign-born:
13.4% (66)
Hispanic or Latino - Speak another language Native:
20.4% (1,554)Foreign-born:
86.6% (425)
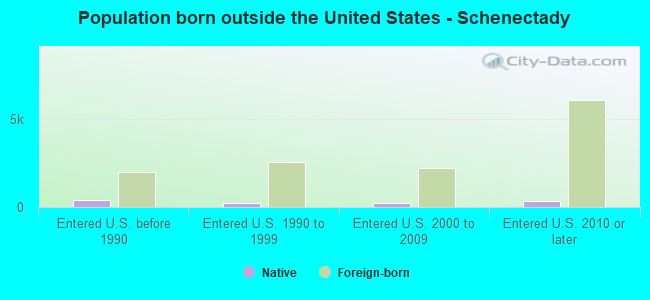
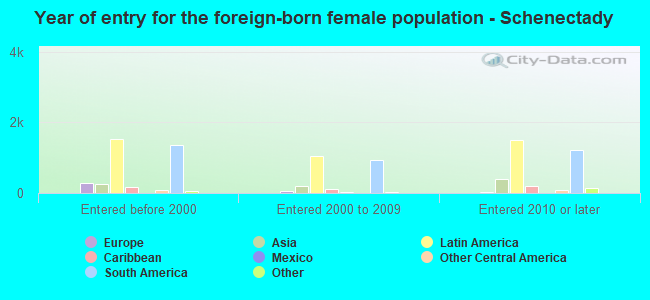
Foreign-born residents in Schenectady 10,552 residents are foreign born (11.2% Latin America , 2.6% Asia ).
This city:
15.3%New York:
22.6%
Marital status for residents in Schenectady Marital status - White (Caucasian) population 15 years and over
Males 51.5% Never married34.0% Now married0.2% Separated1.6% Widowed12.7% DivorcedFemales 34.4% Never married33.4% Now married3.7% Separated14.3% Widowed14.1% DivorcedWomen who gave birth in the past 12 months Now married:
74.2% (270)Unmarried:
25.8% (94)
Women who did not give birth in the past 12 months Now married:
36.8% (2,261)Unmarried:
63.2% (3,884)
Marital status - Black or African American population 15 years and over
Males 48.8% Never married27.7% Now married9.4% Separated1.8% Widowed12.2% DivorcedFemales 51.7% Never married30.8% Now married0.0% Separated6.2% Widowed11.2% DivorcedWomen who gave birth in the past 12 months Now married:
100.0% (396)Unmarried:
0.0% (0)
Women who did not give birth in the past 12 months Now married:
19.4% (567)Unmarried:
80.6% (2,353)
Marital status - American Indian / Alaska Native population 15 years and over
Males 68.4% Never married27.7% Now married0.0% Separated0.0% Widowed4.0% DivorcedFemales 57.6% Never married36.7% Now married0.0% Separated5.8% Widowed0.0% DivorcedWomen who gave birth in the past 12 months Now married:
100.0% (37)Unmarried:
0.0% (0)
Women who did not give birth in the past 12 months Now married:
14.8% (19)Unmarried:
85.2% (107)
Marital status - Asian population 15 years and over
Males 37.9% Never married55.5% Now married2.2% Separated1.8% Widowed2.7% DivorcedFemales 35.6% Never married50.5% Now married2.0% Separated4.5% Widowed7.4% DivorcedWomen who gave birth in the past 12 months Now married:
100.0% (105)Unmarried:
0.0% (0)
Women who did not give birth in the past 12 months Now married:
35.3% (348)Unmarried:
64.7% (638)
Marital status - Native Hawaiian / Pacific Islander population 15 years and over
Males 0.0% Never married100.0% Now married0.0% Separated0.0% Widowed0.0% DivorcedFemales 100.0% Never married0.0% Now married0.0% Separated0.0% Widowed0.0% DivorcedMarital status - Other race population 15 years and over
Males 48.3% Never married41.0% Now married2.5% Separated4.3% Widowed3.9% DivorcedFemales 43.7% Never married45.7% Now married0.2% Separated3.8% Widowed6.7% DivorcedWomen who gave birth in the past 12 months Now married:
65.5% (42)Unmarried:
34.5% (22)
Women who did not give birth in the past 12 months Now married:
46.4% (714)Unmarried:
53.6% (825)
Marital status - Two or more races population 15 years and over
Males 57.2% Never married30.7% Now married1.7% Separated3.1% Widowed7.3% DivorcedFemales 42.8% Never married41.8% Now married0.8% Separated8.4% Widowed6.1% DivorcedWomen who gave birth in the past 12 months Now married:
88.8% (210)Unmarried:
11.2% (26)
Women who did not give birth in the past 12 months Now married:
39.7% (1,064)Unmarried:
60.3% (1,613)
Marital status - White alone, not Hispanic / Latino population 15 years and over
Males 48.8% Never married35.6% Now married0.2% Separated1.8% Widowed13.6% DivorcedFemales 32.6% Never married33.1% Now married3.9% Separated15.3% Widowed15.1% DivorcedWomen who gave birth in the past 12 months Now married:
53.7% (109)Unmarried:
46.3% (94)
Women who did not give birth in the past 12 months Now married:
40.2% (2,261)Unmarried:
59.8% (3,370)
Marital status - Hispanic or Latino population 15 years and over
Males 66.0% Never married22.2% Now married1.2% Separated3.8% Widowed6.8% DivorcedFemales 54.6% Never married27.8% Now married5.5% Separated4.8% Widowed7.3% DivorcedWomen who gave birth in the past 12 months Now married:
73.5% (116)Unmarried:
26.5% (42)
Women who did not give birth in the past 12 months Now married:
29.8% (645)Unmarried:
70.2% (1,518)
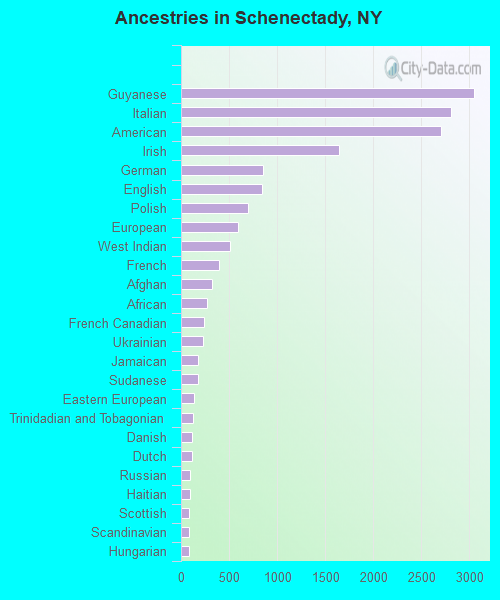
Ancestries in Schenectady
3,055 9.0% Guyanese2,816 8.3% Italian2,705 7.9% American1,648 4.8% Irish852 2.5% German845 2.5% English697 2.0% Polish596 1.8% European507 1.5% West Indian392 1.2% French319 0.9% Afghan270 0.8% African243 0.7% French Canadian226 0.7% Ukrainian181 0.5% Jamaican178 0.5% Sudanese133 0.4% Eastern European125 0.4% Trinidadian and Tobagonian116 0.3% Danish115 0.3% Dutch93 0.3% Russian92 0.3% Haitian84 0.2% Scottish82 0.2% Scandinavian80 0.2% Hungarian75 0.2% Arab65 0.2% British West Indian57 0.2% Welsh55 0.2% Swedish54 0.2% Egyptian50 0.1% Greek43 0.1% Slovak41 0.1% Finnish40 0.1% Scotch-Irish36 0.1% Nigerian34 0.10% Canadian31 0.09% Czech31 0.09% Lithuanian30 0.09% British29 0.09% Armenian28 0.08% Northern European23 0.07% Romanian22 0.06% Portuguese22 0.06% U.S. Virgin Islander15 0.04% Norwegian9 0.03% Croatian6 0.02% Czechoslovakian5 0.01% Latvian
Geographical mobility in Schenectady Same house 1 year ago 27,289 85.5% White (Caucasian)11,120 78.0% Black or African American467 90.9% American Indian / Alaska Native3,215 71.6% Asian76 89.7% Native Hawaiian / Pacific Islander5,123 86.9% Other race6,256 86.6% Two or more races25,849 86.8% White alone, not Hispanic / Latino7,284 80.8% Hispanic or LatinoMoved within same county 1,136 3.6% White / Caucasian1,393 9.8% Black or African American24 4.6% American Indian / Alaska Native521 11.6% Asian524 8.9% Other race553 7.7% Two or more races659 2.2% White alone, not Hispanic / Latino1,192 13.2% Hispanic or LatinoMoved within same state 2,541 8.0% White / Caucasian1,590 11.1% Black or African American25 4.8% American Indian / Alaska Native459 10.2% Asian119 2.0% Other race53 0.7% Two or more races2,400 8.1% White alone, not Hispanic / Latino291 3.2% Hispanic or LatinoMoved from different state 968 3.0% White / Caucasian15 0.1% Black or African American194 4.3% Asian82 1.4% Other race358 5.0% Two or more races876 2.9% White alone, not Hispanic / Latino250 2.8% Hispanic or LatinoMoved from abroad 146 1.0% Black or African American161 3.6% Asian22 0.4% Other race
Children Nativity (place of birth) in Schenectady
Children under 6 years - Living with two parents Both parents native 1,492 99.9% Native1 0.1% Foreign-bornBoth parents foreign-born 822 94.0% Native52 6.0% Foreign-bornOne native, one foreign-born parent 214 100.0% NativeChildren under 6 years - Living with one parent Native parent 1,693 100.0% NativeForeign-born parent 250 100.0% NativeChildren 6 to 17 years - Living with two parents Both parents native 2,206 99.1% Native20 0.9% Foreign-bornBoth parents foreign-born 1,429 84.2% Native268 15.8% Foreign-bornOne native, one foreign-born parent 322 95.8% Native14 4.2% Foreign-bornChildren 6 to 17 years - Living with one parent Native parent 2,211 100.0% NativeForeign-born parent 829 55.1% Native677 44.9% Foreign-born
Grandparents responsible for own grandchildren in Schenectady
Grandparents (30 to 59 years) White / Caucasian 137 71.7% Responsible for grandchildren54 28.3% Not responsible for grandchildrenBlack or African American 49 71.0% Responsible for grandchildren20 29.0% Not responsible for grandchildrenAmerican Indian / Alaska Native 36 100.0% Responsible for grandchildrenAsian 82 100.0% Not responsible for grandchildrenTwo or more races 25 100.0% Responsible for grandchildrenWhite alone, not Hispanic / Latino 133 67.6% Responsible for grandchildren63 32.4% Not responsible for grandchildrenHispanic or Latino 15 100.0% Responsible for grandchildrenGrandparents (60 years and over) White / Caucasian 70 41.7% Responsible for grandchildren98 58.3% Not responsible for grandchildrenBlack or African American 30 56.6% Responsible for grandchildren23 43.4% Not responsible for grandchildrenAsian 43 100.0% Not responsible for grandchildrenWhite alone, not Hispanic / Latino 76 41.9% Responsible for grandchildren105 58.1% Not responsible for grandchildren