Races in Scotch Plains, New Jersey (NJ) Detailed Stats
Ancestries, Foreign-born residents, place of birth

Recent posts about races in Scotch Plains, New Jersey on our local forum with over 2,400,000 registered users:
 | Livingston or Scotch Plains? Where to Move - Please Help! (44 replies) |
| Housing Market (Westfield, Scotch Plains, Fanwood) (9 replies) |
| Cranford/Scotch Plains/Kenilworth house hunt (43 replies) |
| Town suggestions for buying a house (9 replies) |
| American Water service charge - Scotch Plains (14 replies) |
| Best location to buy a house in NJ (20 replies) |
15.7% of Scotch Plains, NJ residents are foreign-born (5.7% born in Asia, 4.5% born in Europe, 4.1% born in Latin America), which is 46.2% less than the foreign-born rate of 23.0% across the entire state of New Jersey.
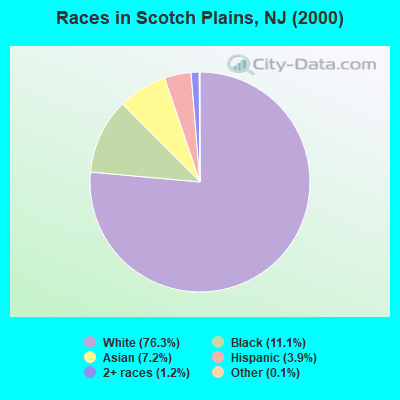
Race distribution in Scotch Plains

- 17,33576.3%White alone
- 2,53211.1%Black alone
- 1,6387.2%Asian alone
- 8953.9%Hispanic
- 2841.2%Two or more races
- 300.1%Other race alone
- 160.07%American Indian alone
- 20.01%Native Hawaiian and Other
Pacific Islander alone
2000
2022
-
- 5,557,20966.0%White alone
- 1,117,19113.3%Hispanic
- 1,096,17113.0%Black alone
- 477,0125.7%Asian alone
- 133,6891.6%Two or more races
- 19,5650.2%Other race alone
- 11,3380.1%American Indian alone
- 2,1750.03%Native Hawaiian and Other
Pacific Islander alone

-
- 4,766,47651.5%White alone
- 2,028,47021.9%Hispanic
- 1,111,63212.0%Black alone
- 923,54610.0%Asian alone
- 332,2373.6%Two or more races
- 89,8471.0%Other race alone
- 8,5570.09%American Indian alone
- 9340.01%Native Hawaiian and Other
Pacific Islander alone

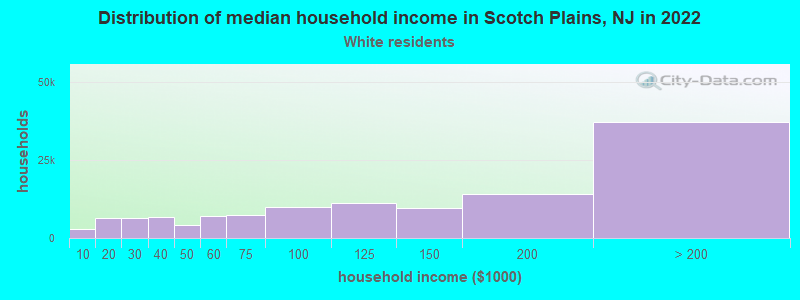
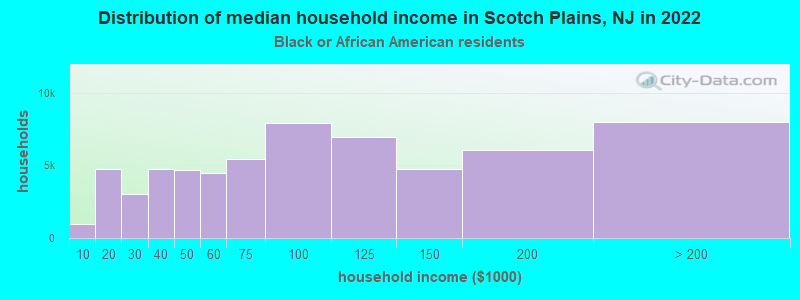
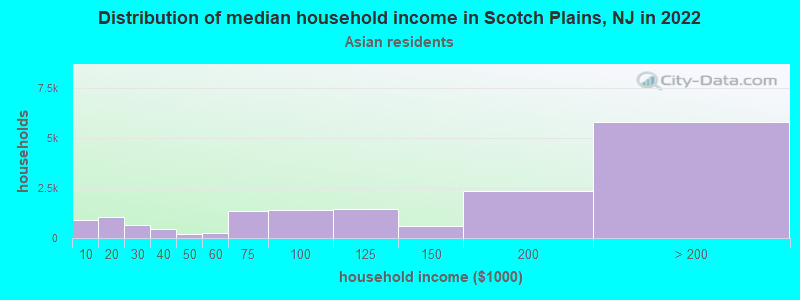
Income and house value in Scotch Plains
- Median household income in 2022
- $170,227White non-Hispanic householders
- $123,106Black householders
- over $200,000Asian householders
- $123,225Some other race householders
- $101,344Two or more races householders
- $142,780Hispanic or Latino race householders
- Median 2022 house value
- $730,393White Non-Hispanic householders
- $455,180Black or African American householders
- $967,561Asian householders
- $854,508Some other race householders
- $533,966Two or more races householders
- $635,147Hispanic or Latino householders
Household income for White non-Hispanic householders
Household income for Black householders
Household income for Asian householders
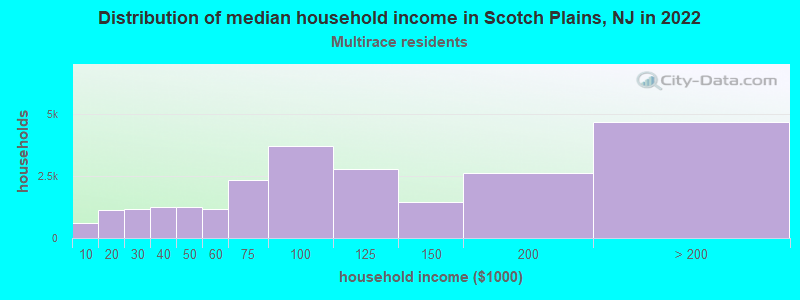
Household income for Two or more races householders
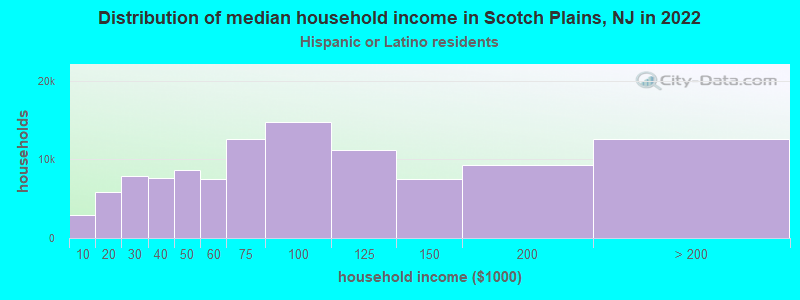
Household income for Hispanic or Latino race householders
Foreign-born residents in Scotch Plains
3,577 residents are foreign born (5.7% Asia, 4.5% Europe, 4.1% Latin America).
| This city: | 15.7% |
| New Jersey: | 17.5% |
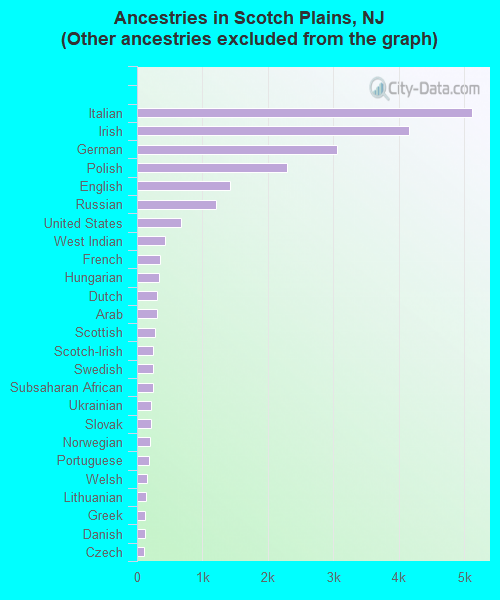
Ancestries in Scotch Plains

- 6,33522.2%Other
- 5,12418.0%Italian
- 4,15314.6%Irish
- 3,05710.7%German
- 2,2868.0%Polish
- 1,4265.0%English
- 1,2114.2%Russian
- 6712.4%United States
- 4301.5%West Indian
- 3581.3%French
- 3291.2%Hungarian
- 3091.1%Dutch
- 3081.1%Arab
- 2680.9%Scottish
- 2500.9%Scotch-Irish
- 2380.8%Swedish
- 2370.8%Subsaharan African
- 2210.8%Ukrainian
- 2190.8%Slovak
- 1940.7%Norwegian
- 1890.7%Portuguese
- 1510.5%Welsh
- 1340.5%Lithuanian
- 1240.4%Greek
- 1180.4%Danish
- 1100.4%Czech
- 380.1%French Canadian
- 310.1%Swiss
Zip codes: 07090.