Races in Scotchtown, New York (NY) Detailed Stats
Data:
Races - White alone (%)
Races - White alone (% change since 2000)
Races - Black alone (%)
Races - Black alone (% change since 2000)
Races - American Indian alone (%)
Races - American Indian alone (% change since 2000)
Races - Asian alone (%)
Races - Asian alone (% change since 2000)
Races - Hispanic (%)
Races - Hispanic (% change since 2000)
Races - Native Hawaiian and Other Pacific Islander alone (%)
Races - Native Hawaiian and Other Pacific Islander alone (% change since 2000)
Races - Two or more races(%)
Races - Two or more races(% change since 2000)
Races - Other race alone (%)
Races - Other race alone (% change since 2000)
Racial diversity
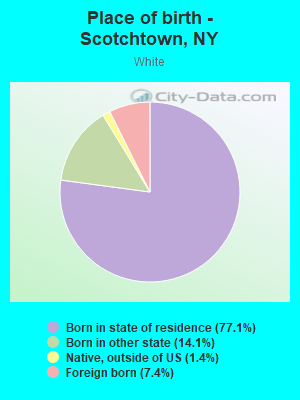
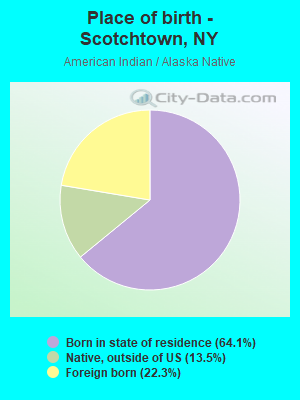
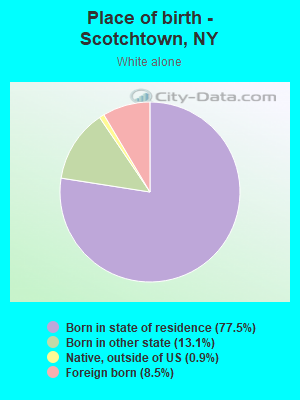
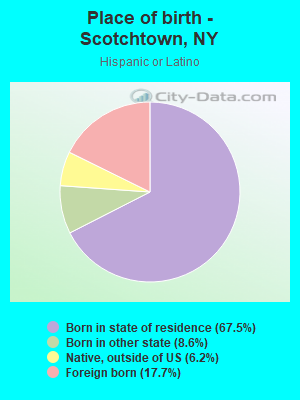
Place of birth - Born in state of residence (%)
Place of birth - Born in state of residence (%) - White
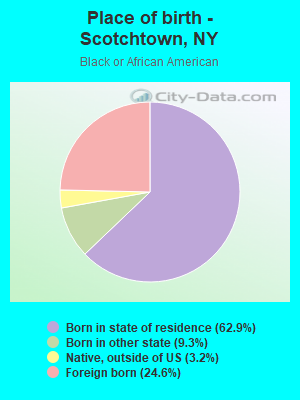
Place of birth - Born in state of residence (%) - Black or African American
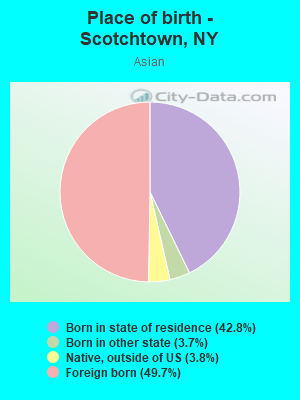
Place of birth - Born in state of residence (%) - Asian
Place of birth - Born in state of residence (%) - Hispanic or Latino
Place of birth - Born in state of residence (%) - American Indian and Alaska Native
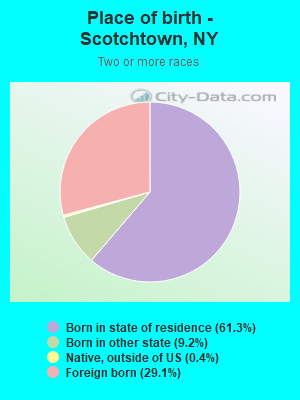
Place of birth - Born in state of residence (%) - Multirace
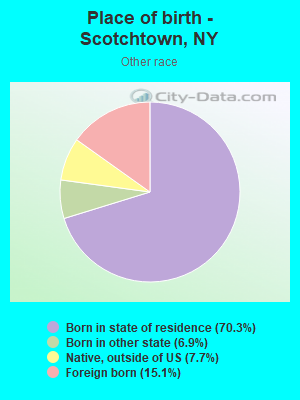
Place of birth - Born in state of residence (%) - Other Race
Place of birth - Born in other state (%)
Place of birth - Born in other state (%) - White
Place of birth - Born in other state (%) - Black or African American
Place of birth - Born in other state (%) - Asian
Place of birth - Born in other state (%) - Hispanic or Latino
Place of birth - Born in other state (%) - American Indian and Alaska Native
Place of birth - Born in other state (%) - Multirace
Place of birth - Born in other state (%) - Other Race
Place of birth - Native, outside of US (%)
Place of birth - Native, outside of US (%) - White
Place of birth - Native, outside of US (%) - Black or African American
Place of birth - Native, outside of US (%) - Asian
Place of birth - Native, outside of US (%) - Hispanic or Latino
Place of birth - Native, outside of US (%) - American Indian and Alaska Native
Place of birth - Native, outside of US (%) - Multirace
Place of birth - Native, outside of US (%) - Other Race
Place of birth - Foreign born (%)
Place of birth - Foreign born (%) - White
Place of birth - Foreign born (%) - Black or African American
Place of birth - Foreign born (%) - Asian
Place of birth - Foreign born (%) - Hispanic or Latino
Place of birth - Foreign born (%) - American Indian and Alaska Native
Place of birth - Foreign born (%) - Multirace
Place of birth - Foreign born (%) - Other Race
Residents speaking English at home (%)
Residents speaking English at home - Born in the United States (%)
Residents speaking English at home - Native, born elsewhere (%)
Residents speaking English at home - Foreign born (%)
Residents speaking Spanish at home (%)
Residents speaking Spanish at home - Born in the United States (%)
Residents speaking Spanish at home - Native, born elsewhere (%)
Residents speaking Spanish at home - Foreign born (%)
Residents speaking other language at home (%)
Residents speaking other language at home - Born in the United States (%)
Residents speaking other language at home - Native, born elsewhere (%)
Residents speaking other language at home - Foreign born (%)
Marital status - Never married (%)
Marital status - Now married (%)
Marital status - Separated (%)
Marital status - Widowed (%)
Marital status - Divorced (%)
Ancestries Reported - Arab (%)
Ancestries Reported - Czech (%)
Ancestries Reported - Danish (%)
Ancestries Reported - Dutch (%)
Ancestries Reported - English (%)
Ancestries Reported - French (%)
Ancestries Reported - French Canadian (%)
Ancestries Reported - German (%)
Ancestries Reported - Greek (%)
Ancestries Reported - Hungarian (%)
Ancestries Reported - Irish (%)
Ancestries Reported - Italian (%)
Ancestries Reported - Lithuanian (%)
Ancestries Reported - Norwegian (%)
Ancestries Reported - Polish (%)
Ancestries Reported - Portuguese (%)
Ancestries Reported - Russian (%)
Ancestries Reported - Scotch-Irish (%)
Ancestries Reported - Scottish (%)
Ancestries Reported - Slovak (%)
Ancestries Reported - Subsaharan African (%)
Ancestries Reported - Swedish (%)
Ancestries Reported - Swiss (%)
Ancestries Reported - Ukrainian (%)
Ancestries Reported - United States (%)
Ancestries Reported - Welsh (%)
Ancestries Reported - West Indian (%)
Ancestries Reported - Other (%)
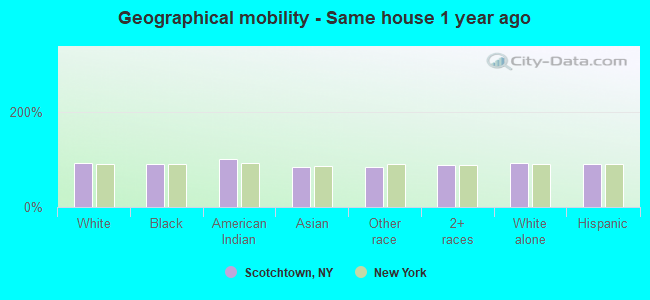
Geographical mobility - Same house 1 year ago (%)
Geographical mobility - Same house 1 year ago (%) - White
Geographical mobility - Same house 1 year ago (%) - Black or African American
Geographical mobility - Same house 1 year ago (%) - Asian
Geographical mobility - Same house 1 year ago (%) - Hispanic or Latino
Geographical mobility - Same house 1 year ago (%) - American Indian and Alaska Native
Geographical mobility - Same house 1 year ago (%) - Multirace
Geographical mobility - Same house 1 year ago (%) - Other Race
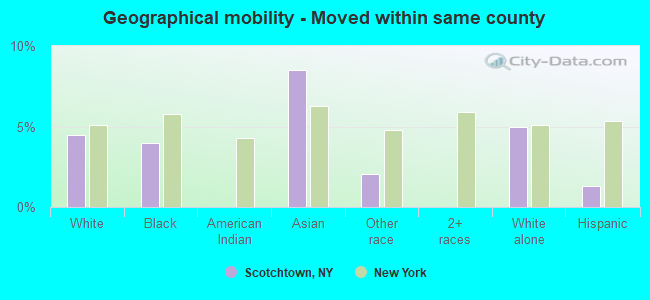
Geographical mobility - Moved within same county (%)
Geographical mobility - Moved within same county (%) - White
Geographical mobility - Moved within same county (%) - Black or African American
Geographical mobility - Moved within same county (%) - Asian
Geographical mobility - Moved within same county (%) - Hispanic or Latino
Geographical mobility - Moved within same county (%) - American Indian and Alaska Native
Geographical mobility - Moved within same county (%) - Multirace
Geographical mobility - Moved within same county (%) - Other Race
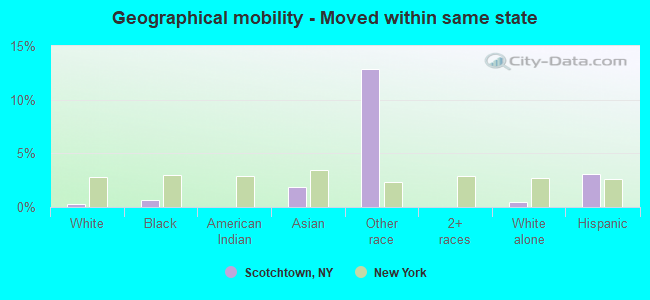
Geographical mobility - Moved from different county within same state (%)
Geographical mobility - Moved from different county within same state (%) - White
Geographical mobility - Moved from different county within same state (%) - Black or African American
Geographical mobility - Moved from different county within same state (%) - Asian
Geographical mobility - Moved from different county within same state (%) - Hispanic or Latino
Geographical mobility - Moved from different county within same state (%) - American Indian and Alaska Native
Geographical mobility - Moved from different county within same state (%) - Multirace
Geographical mobility - Moved from different county within same state (%) - Other Race
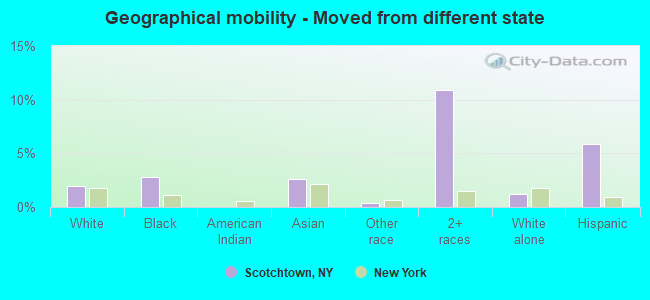
Geographical mobility - Moved from different state (%)
Geographical mobility - Moved from different state (%) - White
Geographical mobility - Moved from different state (%) - Black or African American
Geographical mobility - Moved from different state (%) - Asian
Geographical mobility - Moved from different state (%) - Hispanic or Latino
Geographical mobility - Moved from different state (%) - American Indian and Alaska Native
Geographical mobility - Moved from different state (%) - Multirace
Geographical mobility - Moved from different state (%) - Other Race
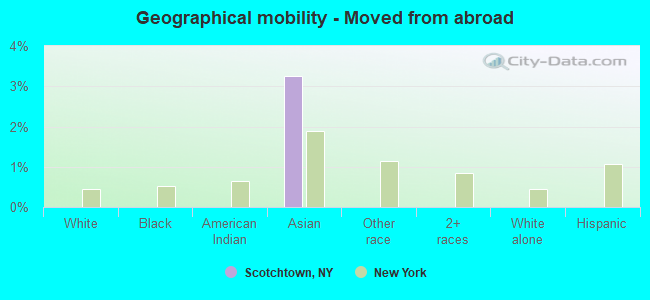
Geographical mobility - Moved from abroad (%)
Geographical mobility - Moved from abroad (%) - White
Geographical mobility - Moved from abroad (%) - Black or African American
Geographical mobility - Moved from abroad (%) - Asian
Geographical mobility - Moved from abroad (%) - Hispanic or Latino
Geographical mobility - Moved from abroad (%) - American Indian and Alaska Native
Geographical mobility - Moved from abroad (%) - Multirace
Geographical mobility - Moved from abroad (%) - Other Race
Place of birth for the foreign-born population - Ireland (%)
Place of birth for the foreign-born population - Denmark (%)
Place of birth for the foreign-born population - Norway (%)
Place of birth for the foreign-born population - Sweden (%)
Place of birth for the foreign-born population - United Kingdom (%)
Place of birth for the foreign-born population - England (%)
Place of birth for the foreign-born population - Scotland (%)
Place of birth for the foreign-born population - Other Northern Europe (%)
Place of birth for the foreign-born population - Austria (%)
Place of birth for the foreign-born population - Belgium (%)
Place of birth for the foreign-born population - France (%)
Place of birth for the foreign-born population - Germany (%)
Place of birth for the foreign-born population - Netherlands (%)
Place of birth for the foreign-born population - Switzerland (%)
Place of birth for the foreign-born population - Other Western Europe (%)
Place of birth for the foreign-born population - Greece (%)
Place of birth for the foreign-born population - Italy (%)
Place of birth for the foreign-born population - Portugal (%)
Place of birth for the foreign-born population - Spain (%)
Place of birth for the foreign-born population - Other Southern Europe (%)
Place of birth for the foreign-born population - Albania (%)
Place of birth for the foreign-born population - Belarus (%)
Place of birth for the foreign-born population - Bosnia and Herzegovina (%)
Place of birth for the foreign-born population - Bulgaria (%)
Place of birth for the foreign-born population - Croatia (%)
Place of birth for the foreign-born population - Czechoslovakia (%)
Place of birth for the foreign-born population - Hungary (%)
Place of birth for the foreign-born population - Latvia (%)
Place of birth for the foreign-born population - Lithuania (%)
Place of birth for the foreign-born population - North Macedonia (Macedonia) (%)
Place of birth for the foreign-born population - Moldova (%)
Place of birth for the foreign-born population - Poland (%)
Place of birth for the foreign-born population - Romania (%)
Place of birth for the foreign-born population - Russia (%)
Place of birth for the foreign-born population - Serbia (%)
Place of birth for the foreign-born population - Ukraine (%)
Place of birth for the foreign-born population - Other Eastern Europe (%)
Place of birth for the foreign-born population - China (%)
Place of birth for the foreign-born population - Hong Kong (%)
Place of birth for the foreign-born population - Taiwan (%)
Place of birth for the foreign-born population - Japan (%)
Place of birth for the foreign-born population - Korea (%)
Place of birth for the foreign-born population - Other Eastern Asia (%)
Place of birth for the foreign-born population - Afghanistan (%)
Place of birth for the foreign-born population - Bangladesh (%)
Place of birth for the foreign-born population - India (%)
Place of birth for the foreign-born population - Iran (%)
Place of birth for the foreign-born population - Kazakhstan (%)
Place of birth for the foreign-born population - Nepal (%)
Place of birth for the foreign-born population - Pakistan (%)
Place of birth for the foreign-born population - Sri Lanka (%)
Place of birth for the foreign-born population - Uzbekistan (%)
Place of birth for the foreign-born population - Other South Central Asia (%)
Place of birth for the foreign-born population - Burma (%)
Place of birth for the foreign-born population - Cambodia (%)
Place of birth for the foreign-born population - Indonesia (%)
Place of birth for the foreign-born population - Laos (%)
Place of birth for the foreign-born population - Malaysia (%)
Place of birth for the foreign-born population - Philippines (%)
Place of birth for the foreign-born population - Singapore (%)
Place of birth for the foreign-born population - Thailand (%)
Place of birth for the foreign-born population - Vietnam (%)
Place of birth for the foreign-born population - Other South Eastern Asia (%)
Place of birth for the foreign-born population - Armenia (%)
Place of birth for the foreign-born population - Iraq (%)
Place of birth for the foreign-born population - Israel (%)
Place of birth for the foreign-born population - Jordan (%)
Place of birth for the foreign-born population - Kuwait (%)
Place of birth for the foreign-born population - Lebanon (%)
Place of birth for the foreign-born population - Saudi Arabia (%)
Place of birth for the foreign-born population - Syria (%)
Place of birth for the foreign-born population - Turkey (%)
Place of birth for the foreign-born population - Yemen (%)
Place of birth for the foreign-born population - Other Western Asia (%)
Place of birth for the foreign-born population - Eritrea (%)
Place of birth for the foreign-born population - Ethiopia (%)
Place of birth for the foreign-born population - Kenya (%)
Place of birth for the foreign-born population - Somalia (%)
Place of birth for the foreign-born population - Uganda (%)
Place of birth for the foreign-born population - Zimbabwe (%)
Place of birth for the foreign-born population - Other Eastern Africa (%)
Place of birth for the foreign-born population - Cameroon (%)
Place of birth for the foreign-born population - Congo (%)
Place of birth for the foreign-born population - Democratic Republic of Congo (Zaire) (%)
Place of birth for the foreign-born population - Other Middle Africa (%)
Place of birth for the foreign-born population - Egypt (%)
Place of birth for the foreign-born population - Morocco (%)
Place of birth for the foreign-born population - Sudan (%)
Place of birth for the foreign-born population - Other Northern Africa (%)
Place of birth for the foreign-born population - South Africa (%)
Place of birth for the foreign-born population - Other Southern Africa (%)
Place of birth for the foreign-born population - Cabo Verde (%)
Place of birth for the foreign-born population - Ghana (%)
Place of birth for the foreign-born population - Liberia (%)
Place of birth for the foreign-born population - Nigeria (%)
Place of birth for the foreign-born population - Senegal (%)
Place of birth for the foreign-born population - Sierra Leone (%)
Place of birth for the foreign-born population - Other Western Africa (%)
Place of birth for the foreign-born population - Australia (%)
Place of birth for the foreign-born population - New Zealand (%)
Place of birth for the foreign-born population - Fiji (%)
Place of birth for the foreign-born population - Micronesia (%)
Place of birth for the foreign-born population - Bahamas (%)
Place of birth for the foreign-born population - Barbados (%)
Place of birth for the foreign-born population - Cuba (%)
Place of birth for the foreign-born population - Dominica (%)
Place of birth for the foreign-born population - Dominican Republic (%)
Place of birth for the foreign-born population - Grenada (%)
Place of birth for the foreign-born population - Haiti (%)
Place of birth for the foreign-born population - Jamaica (%)
Place of birth for the foreign-born population - St. Vincent and the Grenadines (%)
Place of birth for the foreign-born population - Trinidad and Tobago (%)
Place of birth for the foreign-born population - West Indies (%)
Place of birth for the foreign-born population - Other Caribbean (%)
Place of birth for the foreign-born population - Belize (%)
Place of birth for the foreign-born population - Costa Rica (%)
Place of birth for the foreign-born population - El Salvador (%)
Place of birth for the foreign-born population - Guatemala (%)
Place of birth for the foreign-born population - Honduras (%)
Place of birth for the foreign-born population - Mexico (%)
Place of birth for the foreign-born population - Nicaragua (%)
Place of birth for the foreign-born population - Panama (%)
Place of birth for the foreign-born population - Other Central America (%)
Place of birth for the foreign-born population - Argentina (%)
Place of birth for the foreign-born population - Bolivia (%)
Place of birth for the foreign-born population - Brazil (%)
Place of birth for the foreign-born population - Chile (%)
Place of birth for the foreign-born population - Colombia (%)
Place of birth for the foreign-born population - Ecuador (%)
Place of birth for the foreign-born population - Guyana (%)
Place of birth for the foreign-born population - Peru (%)
Place of birth for the foreign-born population - Uruguay (%)
Place of birth for the foreign-born population - Venezuela (%)
Place of birth for the foreign-born population - Other South America (%)
Place of birth for the foreign-born population - Canada (%)
Place of birth for the foreign-born population - Other Northern America (%)
Place of birth for the foreign-born population - Other (%)
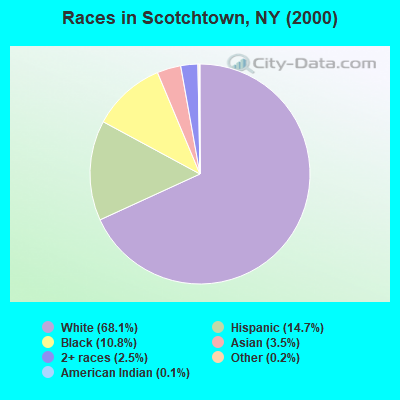
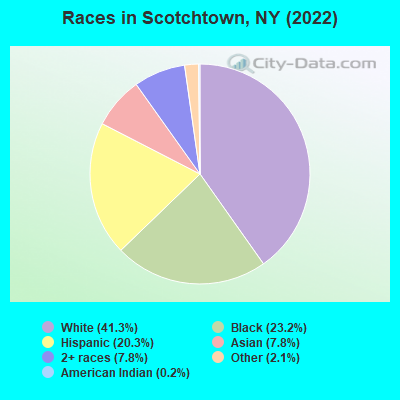
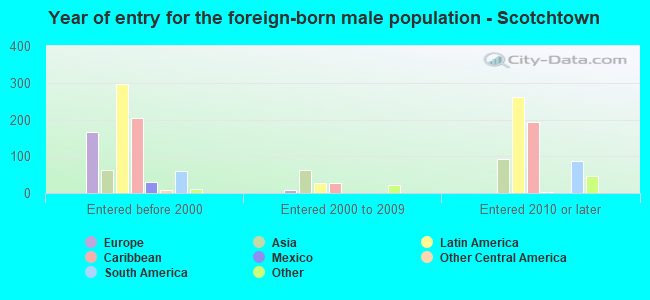
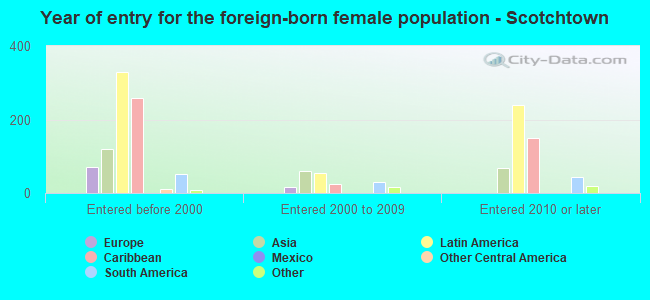
According to 2022 data, the most numerous races in Scotchtown, NY are White alone (4,321 residents), Hispanic (2,130 residents), and Black alone (2,429 residents). 70.3% of Scotchtown residents speak English at home. 17.5% of Scotchtown, NY residents are foreign-born (9.4% born in Latin America, 4.6% born in Asia, 2.8% born in Europe), which is 25.9% less than the foreign-born rate of 22.0% across the entire state of New York.
Race distribution in Scotchtown
2000 2022
11,760,981 62.0% White alone 2,867,583 15.1% Hispanic 2,812,623 14.8% Black alone 1,035,926 5.5% Asian alone 366,116 1.9% Two or more races 75,499 0.4% Other race alone 52,499 0.3% American Indian alone 5,230 0.03% Native Hawaiian and Other
10,408,933 52.9% White alone 3,867,299 19.7% Hispanic 2,633,840 13.4% Black alone 1,776,286 9.0% Asian alone 732,670 3.7% Two or more races 216,110 1.1% Other race alone 35,082 0.2% American Indian alone 6,931 0.04% Native Hawaiian and Other
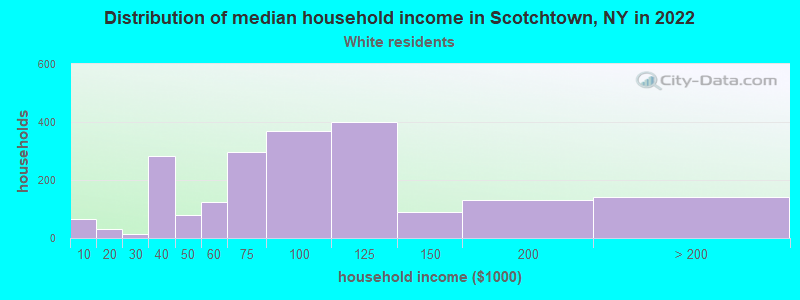
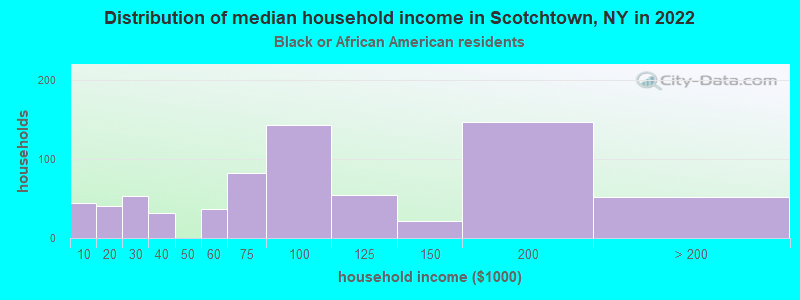
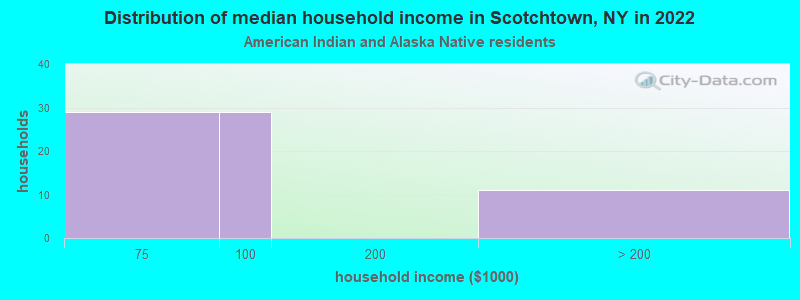
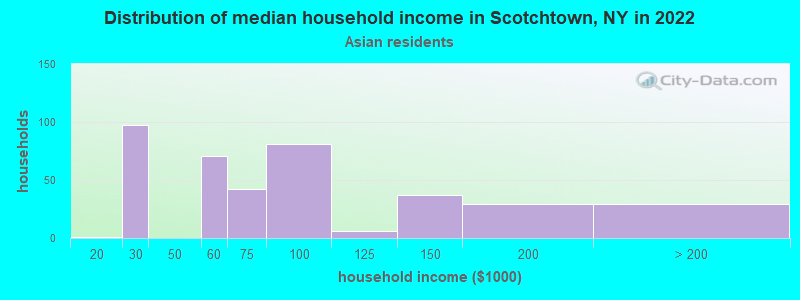
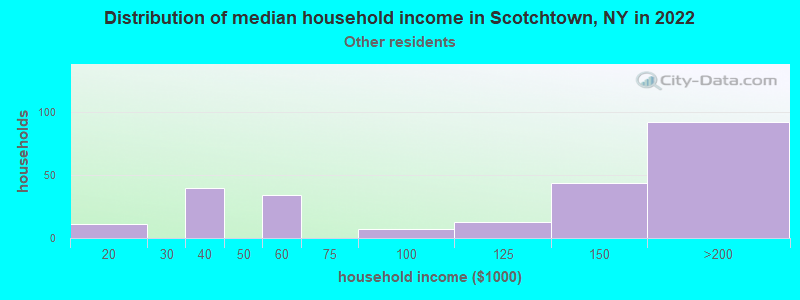
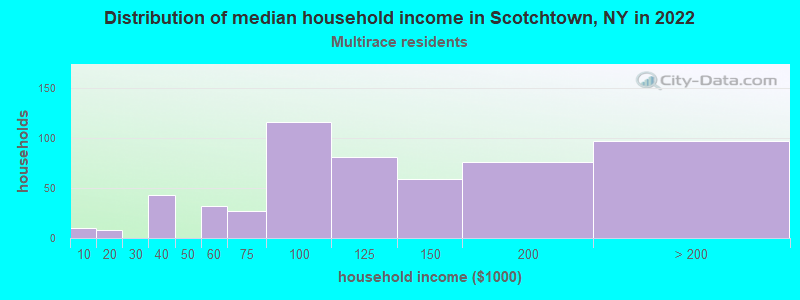
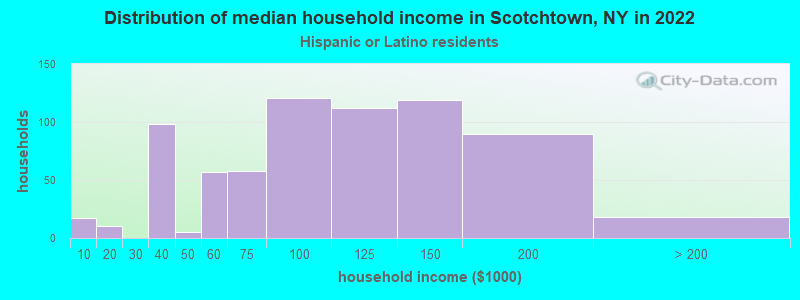
Income and house value in Scotchtown Median household income in 2022 $83,008 White non-Hispanic householders$85,018 Black householders$72,693 American Indian and Alaska Native householders$65,246 Asian householders$136,432 Some other race householders$93,487 Two or more races householders$95,354 Hispanic or Latino race householdersMedian 2022 house value $305,476 White Non-Hispanic householders$325,206 Black or African American householders $311,683 Asian householders$351,586 Some other race householders$244,292 Two or more races householders$325,427 Hispanic or Latino householders
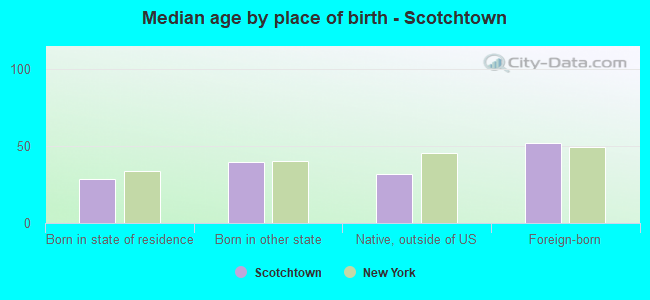
Median age by race in Scotchtown
40.2 Median age for White residents35.7 45.5 36.0 Median age for Black or African American residents35.2 35.4 32.0 Median age for American Indian / Alaska Native residents32.0 51.0 26.2 Median age for Asian residents28.3 26.0 -487,992,314.6 Median age for Native Hawaiian / Pacific Islander residents-477,502,295.2 -497,387,669.3 34.5 Median age for Other race residents34.1 34.8 37.6 Median age for Two or more races residents39.6 33.3 41.7 Median age for White alone residents36.0 44.9 33.0 Median age for Hispanic or Latino residents35.2 31.0
Owner/renter occupied households by race in Scotchtown
House owners and renters - White residents 1,253 63.6% Owner occupied718 36.4% Renter occupiedHouse owners and renters - Black or African American residents 361 41.8% Owner occupied503 58.2% Renter occupiedHouse owners and renters - American Indian / Alaska Native residents 44 59.6% Owner occupied30 40.4% Renter occupiedHouse owners and renters - Asian residents 123 31.0% Owner occupied274 69.0% Renter occupiedHouse owners and renters - Other race residents 180 68.7% Owner occupied82 31.3% Renter occupiedHouse owners and renters - Two or more races residents 220 31.6% Owner occupied475 68.4% Renter occupiedHouse owners and renters - White alone residents 1,162 63.5% Owner occupied668 36.5% Renter occupiedHouse owners and renters - Hispanic or Latino residents 440 59.4% Owner occupied301 40.6% Renter occupied
Language usage in Scotchtown
English speakers - Total 70.3% of residents of Scotchtown speak English at home.
10.5% of residents speak Spanish at home 733 69.5% Speak English very well322 30.5% Speak English less than very well18.9% of residents speak other language at home 1,482 78.5% Speak English very well405 21.5% Speak English less than very well
English speakers - Born in the United States 81.0% of residents of Scotchtown speak English at home.
7.0% of residents speak Spanish at home 76 100.0% Speak English very well14.8% of residents speak other language at home 161 100.0% Speak English very well
English speakers - Native, born elsewhere 21.6% of residents of Scotchtown speak English at home.
43.1% of residents speak Spanish at home 70 50.7% Speak English very well68 49.3% Speak English less than very well46.2% of residents speak other language at home 145 98.0% Speak English very well3 2.0% Speak English less than very well
English speakers - Foreign-born 31.4% of residents of Scotchtown speak English at home.
19.0% of residents speak Spanish at home 180 46.9% Speak English very well204 53.1% Speak English less than very well45.8% of residents speak other language at home 578 62.6% Speak English very well346 37.4% Speak English less than very well
White (Caucasian) - Speak only English Native:
86.9% (3,447)Foreign-born:
27.4% (91)
White (Caucasian) - Speak another language Native:
11.4% (453)Foreign-born:
67.6% (225)
Black or African American - Speak only English Native:
87.9% (1,643)Foreign-born:
37.3% (241)
Black or African American - Speak another language Native:
12.9% (241)Foreign-born:
70.7% (457)
American Indian / Alaska Native - Speak another language Native:
26.6% (31)Foreign-born:
100.0% (31)
Asian - Speak only English Native:
37.6% (154)Foreign-born:
27.9% (118)
Asian - Speak another language Native:
43.5% (179)Foreign-born:
72.3% (305)
Other race - Speak another language Native:
42.8% (344)Foreign-born:
97.2% (141)
Two or more races - Speak only English Native:
74.3% (919)Foreign-born:
23.4% (124)
Two or more races - Speak another language Native:
24.6% (305)Foreign-born:
56.5% (300)
White alone - Speak only English Native:
87.2% (3,289)Foreign-born:
24.4% (90)
White alone - Speak another language Native:
10.0% (378)Foreign-born:
71.8% (265)
Hispanic or Latino - Speak only English Native:
62.4% (982)Foreign-born:
2.5% (9)
Hispanic or Latino - Speak another language Native:
37.3% (587)Foreign-born:
98.2% (351)
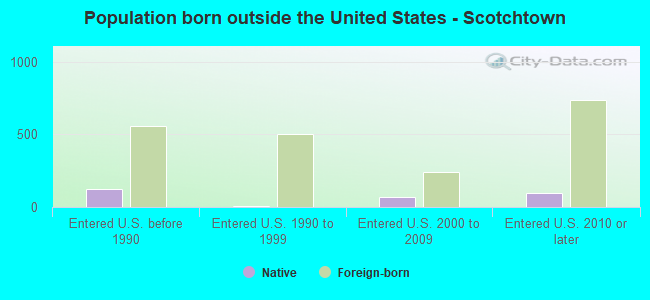
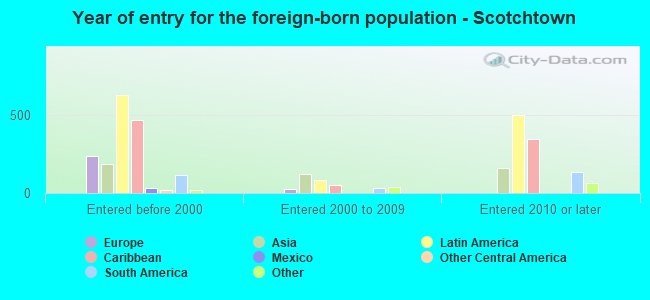
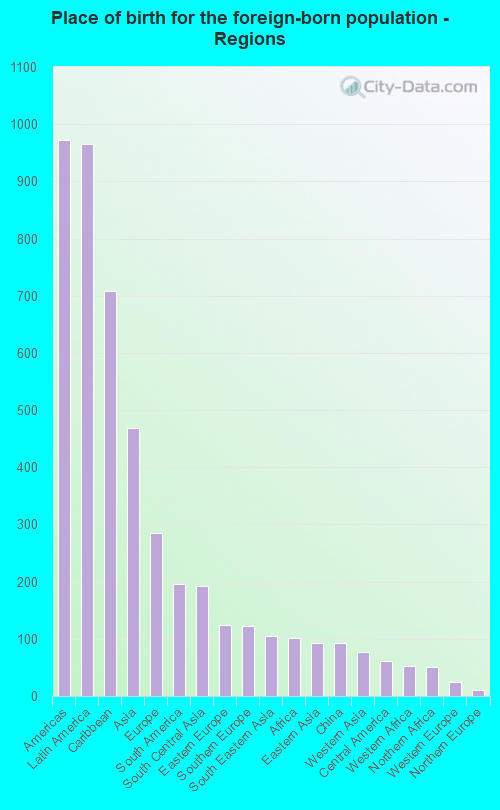
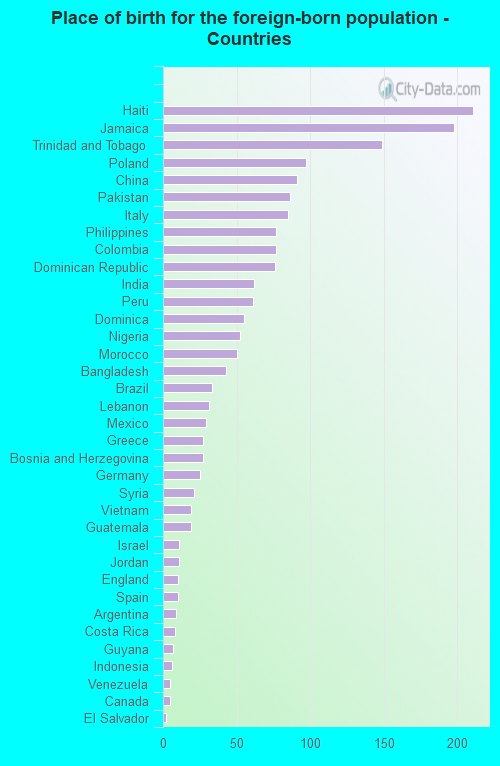
Foreign-born residents in Scotchtown 1,830 residents are foreign born (9.4% Latin America , 4.6% Asia , 2.8% Europe ).
This city:
17.5%New York:
22.6%
Marital status for residents in Scotchtown Marital status - White (Caucasian) population 15 years and over
Males 53.3% Never married41.0% Now married0.6% Separated2.5% Widowed2.6% DivorcedFemales 37.9% Never married44.4% Now married1.1% Separated8.2% Widowed8.4% DivorcedWomen who gave birth in the past 12 months Now married:
100.0% (32)Unmarried:
0.0% (0)
Women who did not give birth in the past 12 months Now married:
30.6% (310)Unmarried:
69.4% (703)
Marital status - Black or African American population 15 years and over
Males 54.9% Never married33.0% Now married8.4% Separated1.8% Widowed2.0% DivorcedFemales 44.6% Never married37.1% Now married6.5% Separated0.7% Widowed11.1% DivorcedWomen who gave birth in the past 12 months Now married:
100.0% (6)Unmarried:
0.0% (0)
Women who did not give birth in the past 12 months Now married:
31.4% (174)Unmarried:
68.6% (380)
Marital status - American Indian / Alaska Native population 15 years and over
Males 68.8% Never married31.2% Now married0.0% Separated0.0% Widowed0.0% DivorcedFemales 0.0% Never married9.1% Now married90.9% Separated0.0% Widowed0.0% DivorcedWomen who did not give birth in the past 12 months Now married:
100.0% (3)Unmarried:
0.0% (0)
Marital status - Asian population 15 years and over
Males 80.1% Never married19.6% Now married0.0% Separated0.3% Widowed0.0% DivorcedFemales 50.0% Never married31.0% Now married3.0% Separated8.1% Widowed7.8% DivorcedWomen who did not give birth in the past 12 months Now married:
28.1% (84)Unmarried:
71.9% (215)
Marital status - Other race population 15 years and over
Males 40.2% Never married31.9% Now married8.3% Separated0.0% Widowed19.6% DivorcedFemales 52.6% Never married26.0% Now married6.4% Separated11.4% Widowed3.6% DivorcedWomen who gave birth in the past 12 months Now married:
100.0% (47)Unmarried:
0.0% (0)
Women who did not give birth in the past 12 months Now married:
8.3% (23)Unmarried:
91.7% (250)
Marital status - Two or more races population 15 years and over
Males 29.7% Never married57.3% Now married0.0% Separated3.5% Widowed9.5% DivorcedFemales 70.2% Never married29.8% Now married0.0% Separated0.0% Widowed0.0% DivorcedWomen who did not give birth in the past 12 months Now married:
22.5% (137)Unmarried:
77.5% (474)
Marital status - White alone, not Hispanic / Latino population 15 years and over
Males 52.6% Never married41.3% Now married0.7% Separated2.6% Widowed2.8% DivorcedFemales 36.7% Never married46.7% Now married0.9% Separated7.7% Widowed8.0% DivorcedWomen who gave birth in the past 12 months Now married:
100.0% (34)Unmarried:
0.0% (0)
Women who did not give birth in the past 12 months Now married:
32.5% (309)Unmarried:
67.5% (642)
Marital status - Hispanic or Latino population 15 years and over
Males 50.5% Never married38.0% Now married2.5% Separated2.4% Widowed6.7% DivorcedFemales 50.1% Never married35.3% Now married5.0% Separated4.0% Widowed5.6% DivorcedWomen who gave birth in the past 12 months Now married:
100.0% (37)Unmarried:
0.0% (0)
Women who did not give birth in the past 12 months Now married:
20.9% (105)Unmarried:
79.1% (397)
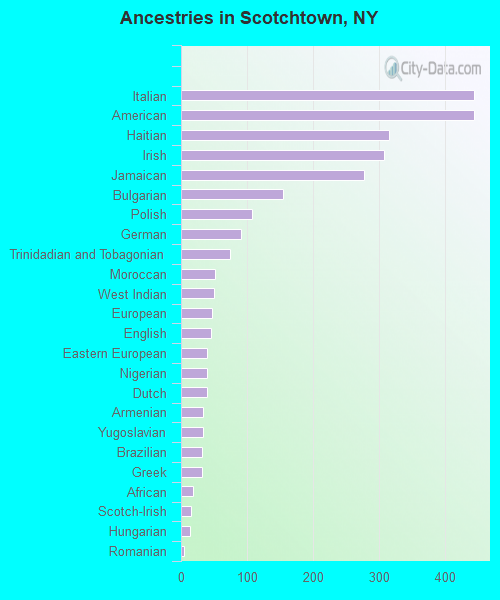
Ancestries in Scotchtown
445 8.6% Italian444 8.6% American315 6.1% Haitian308 6.0% Irish278 5.4% Jamaican154 3.0% Bulgarian108 2.1% Polish91 1.8% German75 1.4% Trinidadian and Tobagonian51 1.0% Moroccan50 1.0% West Indian47 0.9% European45 0.9% English40 0.8% Eastern European40 0.8% Nigerian39 0.8% Dutch34 0.7% Armenian33 0.6% Yugoslavian32 0.6% Brazilian32 0.6% Greek18 0.3% African15 0.3% Scotch-Irish14 0.3% Hungarian5 0.10% Romanian4 0.08% Portuguese2 0.04% Latvian
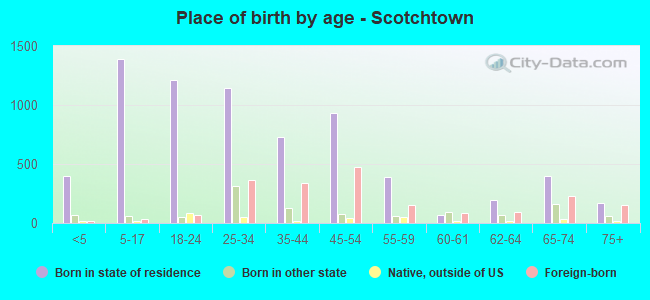
Children Nativity (place of birth) in Scotchtown
Children under 6 years - Living with two parents Both parents native 157 100.0% NativeBoth parents foreign-born 30 100.0% NativeOne native, one foreign-born parent 76 100.0% NativeChildren under 6 years - Living with one parent Native parent 239 100.0% NativeForeign-born parent 30 100.0% NativeChildren 6 to 17 years - Living with two parents Both parents native 406 100.0% NativeBoth parents foreign-born 143 79.3% Native37 20.7% Foreign-bornOne native, one foreign-born parent 136 100.0% NativeChildren 6 to 17 years - Living with one parent Native parent 515 100.0% NativeForeign-born parent 153 51.7% Native143 48.3% Foreign-born
Grandparents responsible for own grandchildren in Scotchtown
Grandparents (30 to 59 years) White / Caucasian 18 100.0% Not responsible for grandchildrenBlack or African American 50 48.9% Responsible for grandchildren52 51.1% Not responsible for grandchildrenTwo or more races 88 100.0% Not responsible for grandchildrenWhite alone, not Hispanic / Latino 11 100.0% Not responsible for grandchildrenHispanic or Latino 112 100.0% Not responsible for grandchildren
Grandparents (60 years and over) White / Caucasian 16 100.0% Not responsible for grandchildrenBlack or African American 33 100.0% Responsible for grandchildrenWhite alone, not Hispanic / Latino 17 100.0% Not responsible for grandchildrenHispanic or Latino 22 100.0% Not responsible for grandchildren