Races in Scotland, Connecticut (CT) Detailed Stats
Ancestries, Foreign-born residents, place of birth

Recent posts about races in Scotland, Connecticut on our local forum with over 2,400,000 registered users:
 | 2024 Connecticut Town Tournament VI (Celebrating the 10-Year Anniversary & Dazzleman's Memorial) (1069 replies) |
| Desegregate Connecticut---Raised CT Zoning Bill (2532 replies) |
| Connecticut TOWN TOURNAMENT V (2022) (831 replies) |
| COVID-19 in Connecticut (7486 replies) |
| Connecticut TOWN TOURNAMENT IV (2020) (849 replies) |
| Bradley gets second European carrier (27 replies) |
4.7% of Scotland, CT residents are foreign-born (2.2% born in Europe, 1.7% born in North America), which is 219.7% less than the foreign-born rate of 15.0% across the entire state of Connecticut.
Race distribution in Scotland

- 1,49696.1%White alone
- 362.3%Hispanic
- 80.5%Asian alone
- 80.5%Two or more races
- 70.4%Black alone
- 10.06%Native Hawaiian and Other
Pacific Islander alone

2000
2022
-
- 2,638,84577.5%White alone
- 320,3239.4%Hispanic
- 295,5718.7%Black alone
- 81,5642.4%Asian alone
- 52,8961.6%Two or more races
- 8,1410.2%Other race alone
- 7,2670.2%American Indian alone
- 9580.03%Native Hawaiian and Other
Pacific Islander alone

-
- 2,246,91362.0%White alone
- 658,97818.2%Hispanic
- 353,9739.8%Black alone
- 172,9294.8%Asian alone
- 159,6314.4%Two or more races
- 29,7610.8%Other race alone
- 3,4280.09%American Indian alone
- 5920.02%Native Hawaiian and Other
Pacific Islander alone

Income and house value in Scotland
- Median household income in 2022
- $98,192White non-Hispanic householders
- $103,857Black householders
- $77,594American Indian and Alaska Native householders
- $139,066Hispanic or Latino race householders
- Median 2022 house value
- $287,964White Non-Hispanic householders
- $297,260Black or African American householders
- $297,260American Indian or Alaska Native householders
- $243,212Hispanic or Latino householders
Household income for White non-Hispanic householders

Household income for Black householders

Household income for American Indian and Alaska Native householders

Household income for Hispanic or Latino race householders

Foreign-born residents in Scotland
73 residents are foreign born (2.2% Europe, 1.7% North America).
| This city: | 4.7% |
| Connecticut: | 10.9% |
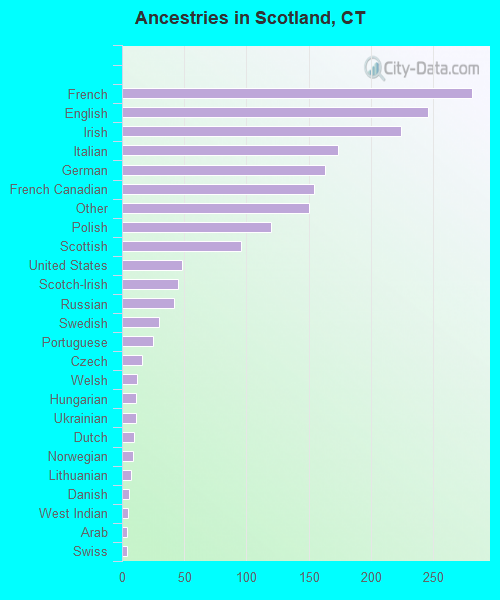
Ancestries in Scotland

- 28114.8%French
- 24613.0%English
- 22411.8%Irish
- 1749.2%Italian
- 1638.6%German
- 1548.1%French Canadian
- 1507.9%Other
- 1206.3%Polish
- 965.1%Scottish
- 482.5%United States
- 452.4%Scotch-Irish
- 422.2%Russian
- 301.6%Swedish
- 251.3%Portuguese
- 160.8%Czech
- 120.6%Welsh
- 110.6%Hungarian
- 110.6%Ukrainian
- 100.5%Dutch
- 90.5%Norwegian
- 70.4%Lithuanian
- 60.3%Danish
- 50.3%West Indian
- 40.2%Arab
- 40.2%Swiss
- 20.1%Greek
- 20.1%Slovak
Zip codes: 06247.