Races in Seattle Hill-Silver Firs, Washington (WA) Detailed Stats
Ancestries, Foreign-born residents, place of birth

Discuss Seattle Hill-Silver Firs, Washington races on our local forum with over 2,400,000 registered users
9.2% of Seattle Hill-Silver Firs, WA residents are foreign-born (5.3% born in Asia, 1.6% born in Europe, 1.4% born in North America), which is 62.6% less than the foreign-born rate of 15.0% across the entire state of Washington.
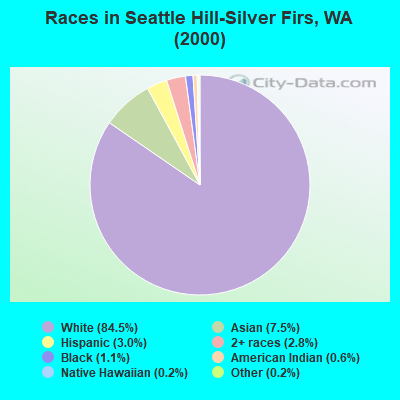
Race distribution in Seattle Hill-Silver Firs

- 29,85484.5%White alone
- 2,6467.5%Asian alone
- 1,0653.0%Hispanic
- 9992.8%Two or more races
- 3941.1%Black alone
- 2070.6%American Indian alone
- 740.2%Native Hawaiian and Other
Pacific Islander alone - 720.2%Other race alone
2000
2022
-
- 4,652,49078.9%White alone
- 441,5097.5%Hispanic
- 319,4015.4%Asian alone
- 184,6313.1%Black alone
- 175,9263.0%Two or more races
- 85,3961.4%American Indian alone
- 22,7790.4%Native Hawaiian and Other
Pacific Islander alone - 11,9890.2%Other race alone

-
- 4,941,45663.5%White alone
- 1,093,31314.0%Hispanic
- 755,8329.7%Asian alone
- 523,4486.7%Two or more races
- 299,5373.8%Black alone
- 69,0240.9%American Indian alone
- 52,2310.7%Native Hawaiian and Other
Pacific Islander alone - 50,9450.7%Other race alone

Income and house value in Seattle Hill-Silver Firs
- Median household income in 2022
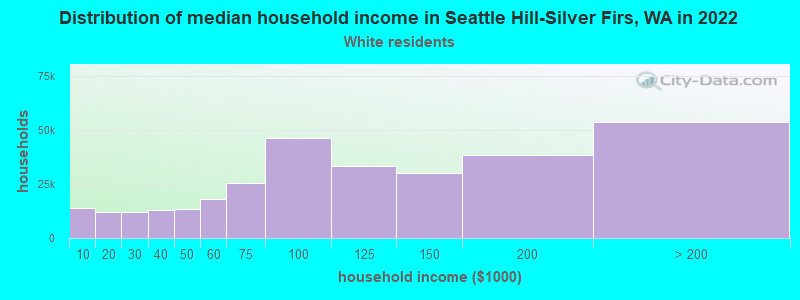
- $136,071White non-Hispanic householders
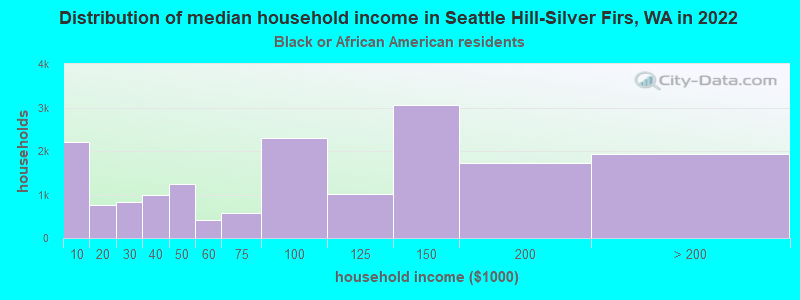
- $145,889Black householders
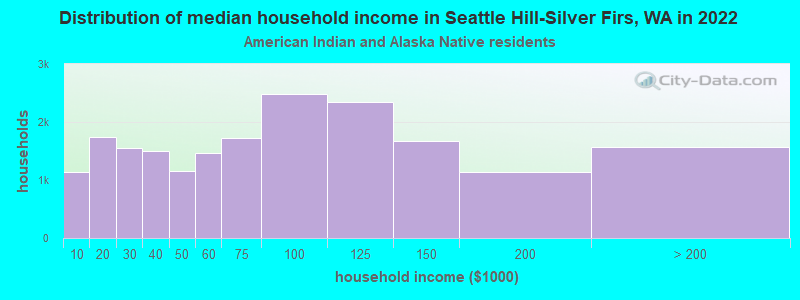
- $152,565American Indian and Alaska Native householders
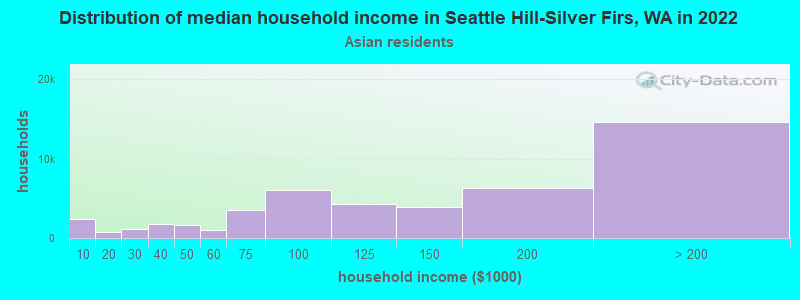
- $168,436Asian householders
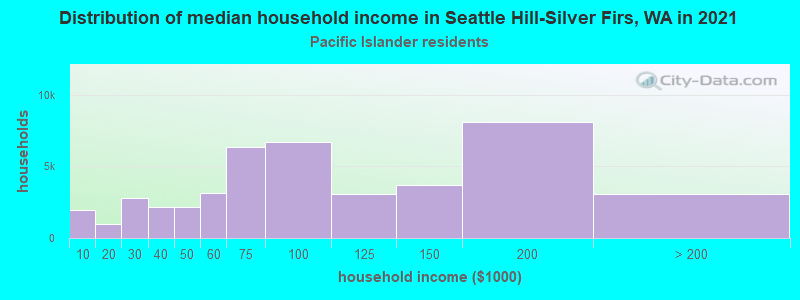
- over $200,000Native Hawaiian and other Pacific Islander householders
- $135,181Some other race householders
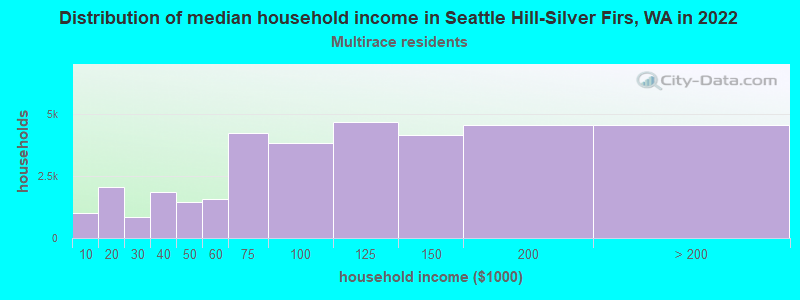
- $145,974Two or more races householders
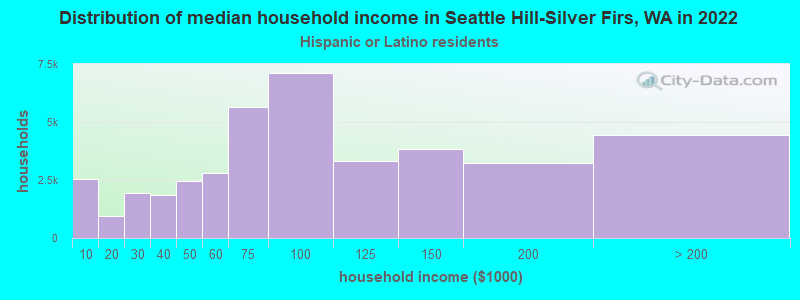
- $141,641Hispanic or Latino race householders
- Median 2022 house value
- $823,243White Non-Hispanic householders
- $752,149Black or African American householders
- $659,502American Indian or Alaska Native householders
- $890,176Asian householders
- over $1,000,000Native Hawaiian and other Pacific Islander householders
- $780,133Some other race householders
- $831,940Two or more races householders
- $861,814Hispanic or Latino householders
Household income for White non-Hispanic householders
Household income for Black householders
Household income for American Indian and Alaska Native householders
Household income for Asian householders
Household income for Native Hawaiian and other Pacific Islander householders
Household income for Two or more races householders
Household income for Hispanic or Latino race householders
Foreign-born residents in Seattle Hill-Silver Firs
3,257 residents are foreign born (5.3% Asia, 1.6% Europe, 1.4% North America).
| This city: | 9.2% |
| Washington: | 10.4% |
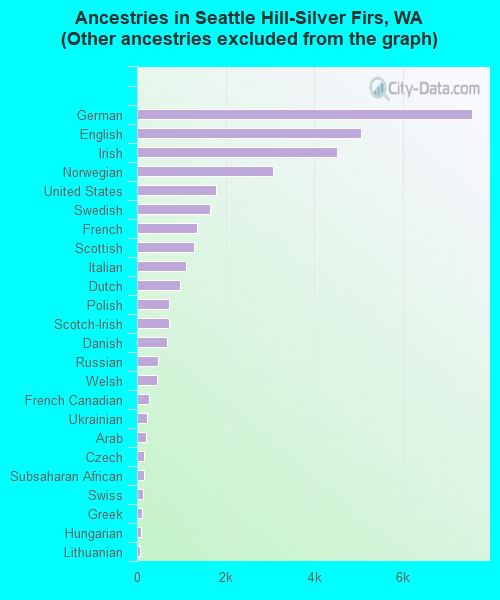
Ancestries in Seattle Hill-Silver Firs

- 8,38820.3%Other
- 7,56418.3%German
- 5,05812.2%English
- 4,51910.9%Irish
- 3,0757.4%Norwegian
- 1,7914.3%United States
- 1,6554.0%Swedish
- 1,3633.3%French
- 1,2753.1%Scottish
- 1,1162.7%Italian
- 9672.3%Dutch
- 7291.8%Polish
- 7151.7%Scotch-Irish
- 6841.7%Danish
- 4821.2%Russian
- 4611.1%Welsh
- 2660.6%French Canadian
- 2280.6%Ukrainian
- 1920.5%Arab
- 1520.4%Czech
- 1490.4%Subsaharan African
- 1360.3%Swiss
- 1060.3%Greek
- 990.2%Hungarian
- 690.2%Lithuanian
- 640.2%Portuguese
- 430.1%Slovak
- 50.01%West Indian
Zip codes: 98208.