Races in Sedalia, Missouri (MO) Detailed Stats
Data:
Races - White alone (%)
Races - White alone (% change since 2000)
Races - Black alone (%)
Races - Black alone (% change since 2000)
Races - American Indian alone (%)
Races - American Indian alone (% change since 2000)
Races - Asian alone (%)
Races - Asian alone (% change since 2000)
Races - Hispanic (%)
Races - Hispanic (% change since 2000)
Races - Native Hawaiian and Other Pacific Islander alone (%)
Races - Native Hawaiian and Other Pacific Islander alone (% change since 2000)
Races - Two or more races(%)
Races - Two or more races(% change since 2000)
Races - Other race alone (%)
Races - Other race alone (% change since 2000)
Racial diversity
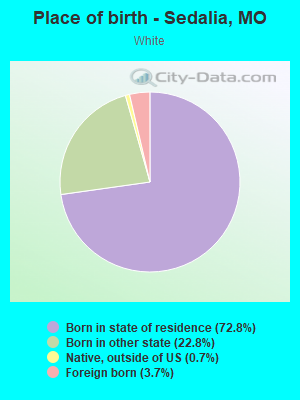
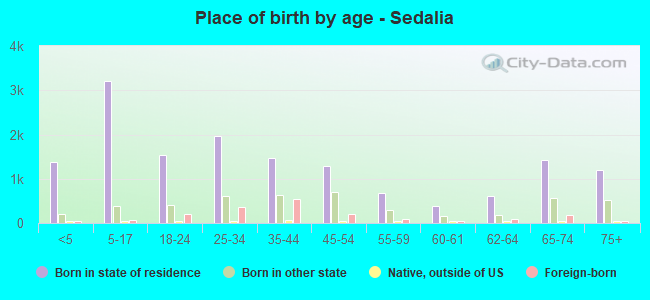
Place of birth - Born in state of residence (%)
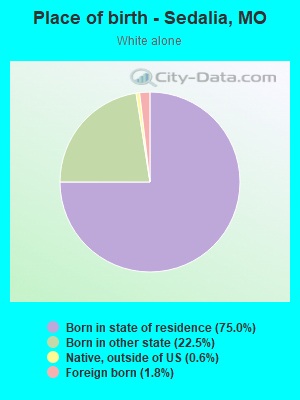
Place of birth - Born in state of residence (%) - White
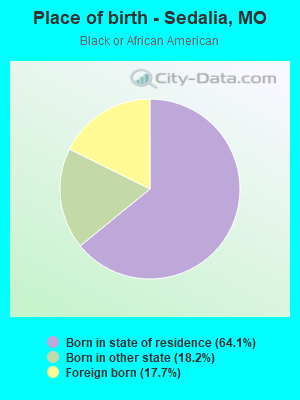
Place of birth - Born in state of residence (%) - Black or African American
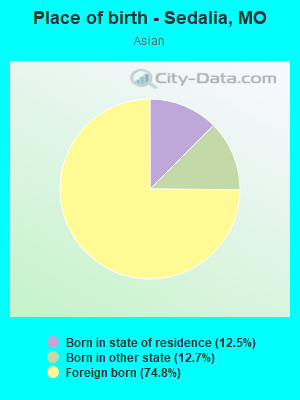
Place of birth - Born in state of residence (%) - Asian
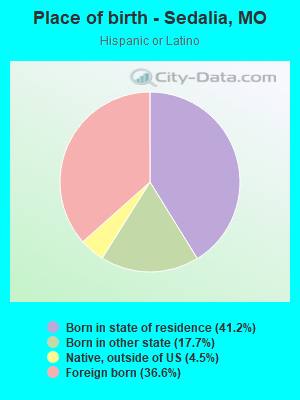
Place of birth - Born in state of residence (%) - Hispanic or Latino
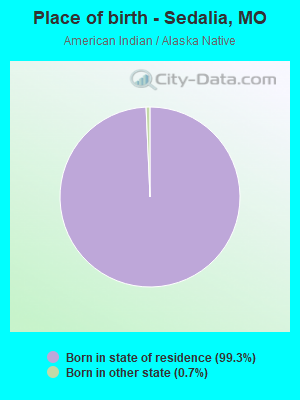
Place of birth - Born in state of residence (%) - American Indian and Alaska Native
Place of birth - Born in state of residence (%) - Multirace
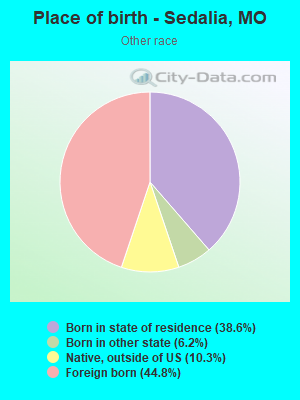
Place of birth - Born in state of residence (%) - Other Race
Place of birth - Born in other state (%)
Place of birth - Born in other state (%) - White
Place of birth - Born in other state (%) - Black or African American
Place of birth - Born in other state (%) - Asian
Place of birth - Born in other state (%) - Hispanic or Latino
Place of birth - Born in other state (%) - American Indian and Alaska Native
Place of birth - Born in other state (%) - Multirace
Place of birth - Born in other state (%) - Other Race
Place of birth - Native, outside of US (%)
Place of birth - Native, outside of US (%) - White
Place of birth - Native, outside of US (%) - Black or African American
Place of birth - Native, outside of US (%) - Asian
Place of birth - Native, outside of US (%) - Hispanic or Latino
Place of birth - Native, outside of US (%) - American Indian and Alaska Native
Place of birth - Native, outside of US (%) - Multirace
Place of birth - Native, outside of US (%) - Other Race
Place of birth - Foreign born (%)
Place of birth - Foreign born (%) - White
Place of birth - Foreign born (%) - Black or African American
Place of birth - Foreign born (%) - Asian
Place of birth - Foreign born (%) - Hispanic or Latino
Place of birth - Foreign born (%) - American Indian and Alaska Native
Place of birth - Foreign born (%) - Multirace
Place of birth - Foreign born (%) - Other Race
Residents speaking English at home (%)
Residents speaking English at home - Born in the United States (%)
Residents speaking English at home - Native, born elsewhere (%)
Residents speaking English at home - Foreign born (%)
Residents speaking Spanish at home (%)
Residents speaking Spanish at home - Born in the United States (%)
Residents speaking Spanish at home - Native, born elsewhere (%)
Residents speaking Spanish at home - Foreign born (%)
Residents speaking other language at home (%)
Residents speaking other language at home - Born in the United States (%)
Residents speaking other language at home - Native, born elsewhere (%)
Residents speaking other language at home - Foreign born (%)
Marital status - Never married (%)
Marital status - Now married (%)
Marital status - Separated (%)
Marital status - Widowed (%)
Marital status - Divorced (%)
Ancestries Reported - Arab (%)
Ancestries Reported - Czech (%)
Ancestries Reported - Danish (%)
Ancestries Reported - Dutch (%)
Ancestries Reported - English (%)
Ancestries Reported - French (%)
Ancestries Reported - French Canadian (%)
Ancestries Reported - German (%)
Ancestries Reported - Greek (%)
Ancestries Reported - Hungarian (%)
Ancestries Reported - Irish (%)
Ancestries Reported - Italian (%)
Ancestries Reported - Lithuanian (%)
Ancestries Reported - Norwegian (%)
Ancestries Reported - Polish (%)
Ancestries Reported - Portuguese (%)
Ancestries Reported - Russian (%)
Ancestries Reported - Scotch-Irish (%)
Ancestries Reported - Scottish (%)
Ancestries Reported - Slovak (%)
Ancestries Reported - Subsaharan African (%)
Ancestries Reported - Swedish (%)
Ancestries Reported - Swiss (%)
Ancestries Reported - Ukrainian (%)
Ancestries Reported - United States (%)
Ancestries Reported - Welsh (%)
Ancestries Reported - West Indian (%)
Ancestries Reported - Other (%)
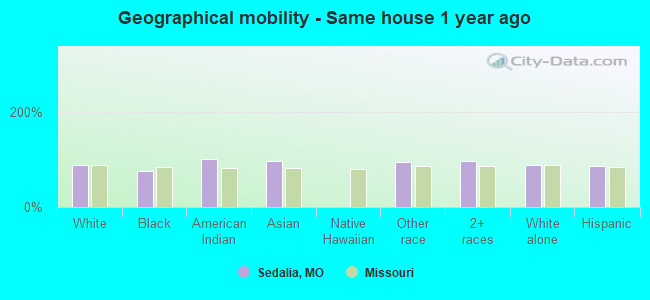
Geographical mobility - Same house 1 year ago (%)
Geographical mobility - Same house 1 year ago (%) - White
Geographical mobility - Same house 1 year ago (%) - Black or African American
Geographical mobility - Same house 1 year ago (%) - Asian
Geographical mobility - Same house 1 year ago (%) - Hispanic or Latino
Geographical mobility - Same house 1 year ago (%) - American Indian and Alaska Native
Geographical mobility - Same house 1 year ago (%) - Multirace
Geographical mobility - Same house 1 year ago (%) - Other Race
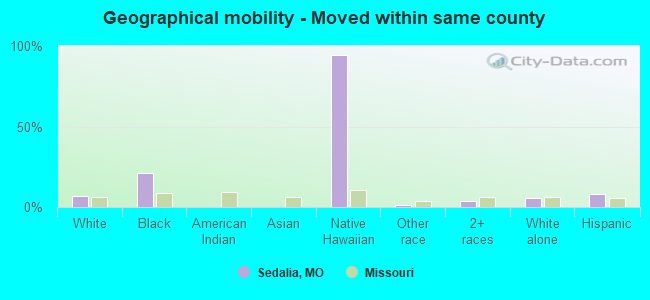
Geographical mobility - Moved within same county (%)
Geographical mobility - Moved within same county (%) - White
Geographical mobility - Moved within same county (%) - Black or African American
Geographical mobility - Moved within same county (%) - Asian
Geographical mobility - Moved within same county (%) - Hispanic or Latino
Geographical mobility - Moved within same county (%) - American Indian and Alaska Native
Geographical mobility - Moved within same county (%) - Multirace
Geographical mobility - Moved within same county (%) - Other Race
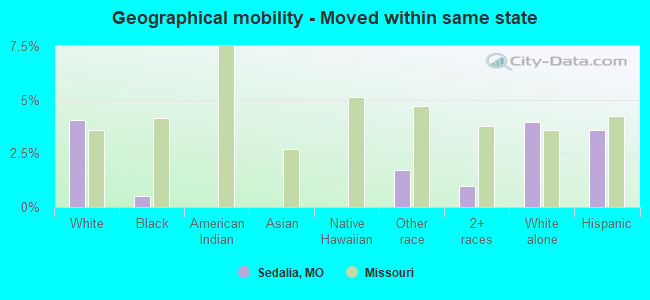
Geographical mobility - Moved from different county within same state (%)
Geographical mobility - Moved from different county within same state (%) - White
Geographical mobility - Moved from different county within same state (%) - Black or African American
Geographical mobility - Moved from different county within same state (%) - Asian
Geographical mobility - Moved from different county within same state (%) - Hispanic or Latino
Geographical mobility - Moved from different county within same state (%) - American Indian and Alaska Native
Geographical mobility - Moved from different county within same state (%) - Multirace
Geographical mobility - Moved from different county within same state (%) - Other Race
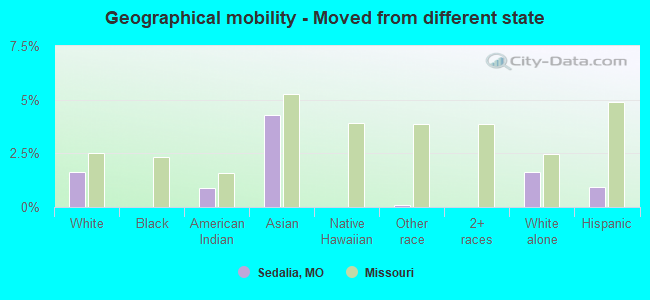
Geographical mobility - Moved from different state (%)
Geographical mobility - Moved from different state (%) - White
Geographical mobility - Moved from different state (%) - Black or African American
Geographical mobility - Moved from different state (%) - Asian
Geographical mobility - Moved from different state (%) - Hispanic or Latino
Geographical mobility - Moved from different state (%) - American Indian and Alaska Native
Geographical mobility - Moved from different state (%) - Multirace
Geographical mobility - Moved from different state (%) - Other Race
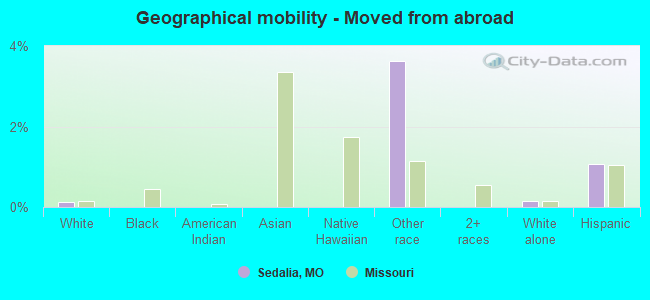
Geographical mobility - Moved from abroad (%)
Geographical mobility - Moved from abroad (%) - White
Geographical mobility - Moved from abroad (%) - Black or African American
Geographical mobility - Moved from abroad (%) - Asian
Geographical mobility - Moved from abroad (%) - Hispanic or Latino
Geographical mobility - Moved from abroad (%) - American Indian and Alaska Native
Geographical mobility - Moved from abroad (%) - Multirace
Geographical mobility - Moved from abroad (%) - Other Race
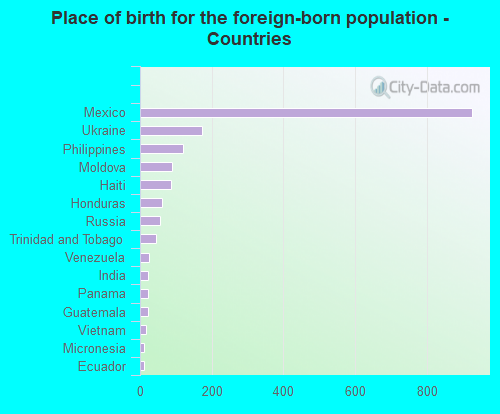
Place of birth for the foreign-born population - Ireland (%)
Place of birth for the foreign-born population - Denmark (%)
Place of birth for the foreign-born population - Norway (%)
Place of birth for the foreign-born population - Sweden (%)
Place of birth for the foreign-born population - United Kingdom (%)
Place of birth for the foreign-born population - England (%)
Place of birth for the foreign-born population - Scotland (%)
Place of birth for the foreign-born population - Other Northern Europe (%)
Place of birth for the foreign-born population - Austria (%)
Place of birth for the foreign-born population - Belgium (%)
Place of birth for the foreign-born population - France (%)
Place of birth for the foreign-born population - Germany (%)
Place of birth for the foreign-born population - Netherlands (%)
Place of birth for the foreign-born population - Switzerland (%)
Place of birth for the foreign-born population - Other Western Europe (%)
Place of birth for the foreign-born population - Greece (%)
Place of birth for the foreign-born population - Italy (%)
Place of birth for the foreign-born population - Portugal (%)
Place of birth for the foreign-born population - Spain (%)
Place of birth for the foreign-born population - Other Southern Europe (%)
Place of birth for the foreign-born population - Albania (%)
Place of birth for the foreign-born population - Belarus (%)
Place of birth for the foreign-born population - Bosnia and Herzegovina (%)
Place of birth for the foreign-born population - Bulgaria (%)
Place of birth for the foreign-born population - Croatia (%)
Place of birth for the foreign-born population - Czechoslovakia (%)
Place of birth for the foreign-born population - Hungary (%)
Place of birth for the foreign-born population - Latvia (%)
Place of birth for the foreign-born population - Lithuania (%)
Place of birth for the foreign-born population - North Macedonia (Macedonia) (%)
Place of birth for the foreign-born population - Moldova (%)
Place of birth for the foreign-born population - Poland (%)
Place of birth for the foreign-born population - Romania (%)
Place of birth for the foreign-born population - Russia (%)
Place of birth for the foreign-born population - Serbia (%)
Place of birth for the foreign-born population - Ukraine (%)
Place of birth for the foreign-born population - Other Eastern Europe (%)
Place of birth for the foreign-born population - China (%)
Place of birth for the foreign-born population - Hong Kong (%)
Place of birth for the foreign-born population - Taiwan (%)
Place of birth for the foreign-born population - Japan (%)
Place of birth for the foreign-born population - Korea (%)
Place of birth for the foreign-born population - Other Eastern Asia (%)
Place of birth for the foreign-born population - Afghanistan (%)
Place of birth for the foreign-born population - Bangladesh (%)
Place of birth for the foreign-born population - India (%)
Place of birth for the foreign-born population - Iran (%)
Place of birth for the foreign-born population - Kazakhstan (%)
Place of birth for the foreign-born population - Nepal (%)
Place of birth for the foreign-born population - Pakistan (%)
Place of birth for the foreign-born population - Sri Lanka (%)
Place of birth for the foreign-born population - Uzbekistan (%)
Place of birth for the foreign-born population - Other South Central Asia (%)
Place of birth for the foreign-born population - Burma (%)
Place of birth for the foreign-born population - Cambodia (%)
Place of birth for the foreign-born population - Indonesia (%)
Place of birth for the foreign-born population - Laos (%)
Place of birth for the foreign-born population - Malaysia (%)
Place of birth for the foreign-born population - Philippines (%)
Place of birth for the foreign-born population - Singapore (%)
Place of birth for the foreign-born population - Thailand (%)
Place of birth for the foreign-born population - Vietnam (%)
Place of birth for the foreign-born population - Other South Eastern Asia (%)
Place of birth for the foreign-born population - Armenia (%)
Place of birth for the foreign-born population - Iraq (%)
Place of birth for the foreign-born population - Israel (%)
Place of birth for the foreign-born population - Jordan (%)
Place of birth for the foreign-born population - Kuwait (%)
Place of birth for the foreign-born population - Lebanon (%)
Place of birth for the foreign-born population - Saudi Arabia (%)
Place of birth for the foreign-born population - Syria (%)
Place of birth for the foreign-born population - Turkey (%)
Place of birth for the foreign-born population - Yemen (%)
Place of birth for the foreign-born population - Other Western Asia (%)
Place of birth for the foreign-born population - Eritrea (%)
Place of birth for the foreign-born population - Ethiopia (%)
Place of birth for the foreign-born population - Kenya (%)
Place of birth for the foreign-born population - Somalia (%)
Place of birth for the foreign-born population - Uganda (%)
Place of birth for the foreign-born population - Zimbabwe (%)
Place of birth for the foreign-born population - Other Eastern Africa (%)
Place of birth for the foreign-born population - Cameroon (%)
Place of birth for the foreign-born population - Congo (%)
Place of birth for the foreign-born population - Democratic Republic of Congo (Zaire) (%)
Place of birth for the foreign-born population - Other Middle Africa (%)
Place of birth for the foreign-born population - Egypt (%)
Place of birth for the foreign-born population - Morocco (%)
Place of birth for the foreign-born population - Sudan (%)
Place of birth for the foreign-born population - Other Northern Africa (%)
Place of birth for the foreign-born population - South Africa (%)
Place of birth for the foreign-born population - Other Southern Africa (%)
Place of birth for the foreign-born population - Cabo Verde (%)
Place of birth for the foreign-born population - Ghana (%)
Place of birth for the foreign-born population - Liberia (%)
Place of birth for the foreign-born population - Nigeria (%)
Place of birth for the foreign-born population - Senegal (%)
Place of birth for the foreign-born population - Sierra Leone (%)
Place of birth for the foreign-born population - Other Western Africa (%)
Place of birth for the foreign-born population - Australia (%)
Place of birth for the foreign-born population - New Zealand (%)
Place of birth for the foreign-born population - Fiji (%)
Place of birth for the foreign-born population - Micronesia (%)
Place of birth for the foreign-born population - Bahamas (%)
Place of birth for the foreign-born population - Barbados (%)
Place of birth for the foreign-born population - Cuba (%)
Place of birth for the foreign-born population - Dominica (%)
Place of birth for the foreign-born population - Dominican Republic (%)
Place of birth for the foreign-born population - Grenada (%)
Place of birth for the foreign-born population - Haiti (%)
Place of birth for the foreign-born population - Jamaica (%)
Place of birth for the foreign-born population - St. Vincent and the Grenadines (%)
Place of birth for the foreign-born population - Trinidad and Tobago (%)
Place of birth for the foreign-born population - West Indies (%)
Place of birth for the foreign-born population - Other Caribbean (%)
Place of birth for the foreign-born population - Belize (%)
Place of birth for the foreign-born population - Costa Rica (%)
Place of birth for the foreign-born population - El Salvador (%)
Place of birth for the foreign-born population - Guatemala (%)
Place of birth for the foreign-born population - Honduras (%)
Place of birth for the foreign-born population - Mexico (%)
Place of birth for the foreign-born population - Nicaragua (%)
Place of birth for the foreign-born population - Panama (%)
Place of birth for the foreign-born population - Other Central America (%)
Place of birth for the foreign-born population - Argentina (%)
Place of birth for the foreign-born population - Bolivia (%)
Place of birth for the foreign-born population - Brazil (%)
Place of birth for the foreign-born population - Chile (%)
Place of birth for the foreign-born population - Colombia (%)
Place of birth for the foreign-born population - Ecuador (%)
Place of birth for the foreign-born population - Guyana (%)
Place of birth for the foreign-born population - Peru (%)
Place of birth for the foreign-born population - Uruguay (%)
Place of birth for the foreign-born population - Venezuela (%)
Place of birth for the foreign-born population - Other South America (%)
Place of birth for the foreign-born population - Canada (%)
Place of birth for the foreign-born population - Other Northern America (%)
Place of birth for the foreign-born population - Other (%)
Latest news about races in Sedalia, MO collected exclusively by city-data.com from local newspapers, TV, and radio stations
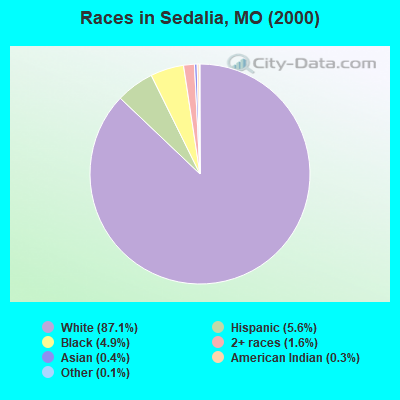
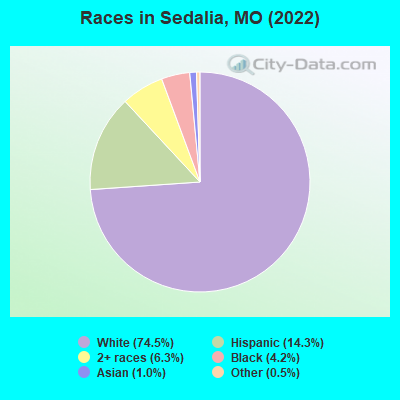
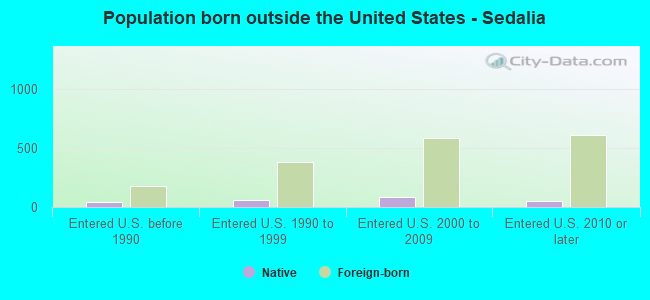
According to 2022 data, the most numerous races in Sedalia, MO are White alone (16,268 residents), Black alone (923 residents), and Two or more races (1,372 residents). 86.8% of Sedalia residents speak English at home. 8.0% of Sedalia, MO residents are foreign-born (5.7% born in Latin America, 1.6% born in Europe, 0.9% born in Asia), which is 50.3% greater than the foreign-born rate of 4.0% across the entire state of Missouri.
Race distribution in Sedalia
2000 2022
4,686,474 83.8% White alone 625,667 11.2% Black alone 118,592 2.1% Hispanic 71,905 1.3% Two or more races 61,041 1.1% Asian alone 23,302 0.4% American Indian alone 5,291 0.09% Other race alone 2,939 0.05% Native Hawaiian and Other
4,733,411 76.6% White alone 656,739 10.6% Black alone 316,300 5.1% Two or more races 291,763 4.7% Hispanic 132,436 2.1% Asian alone 27,467 0.4% Other race alone 12,313 0.2% American Indian alone 7,528 0.1% Native Hawaiian and Other
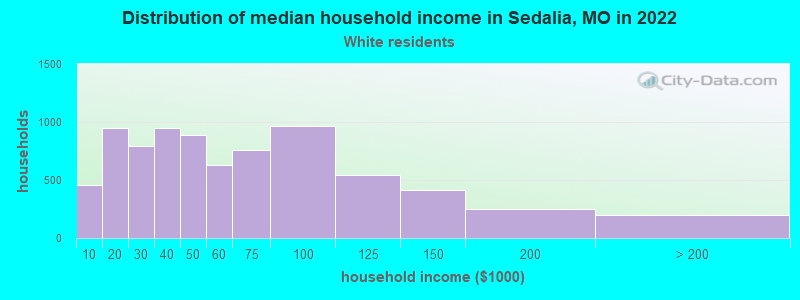
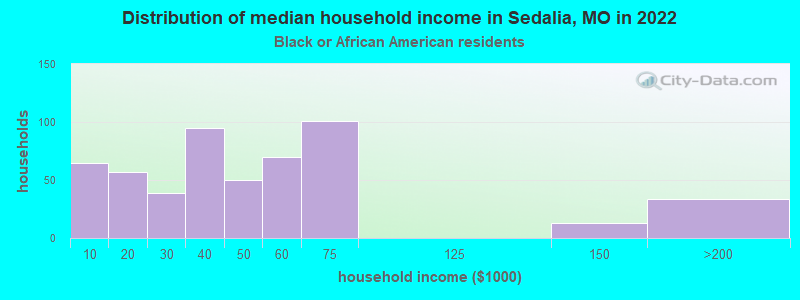
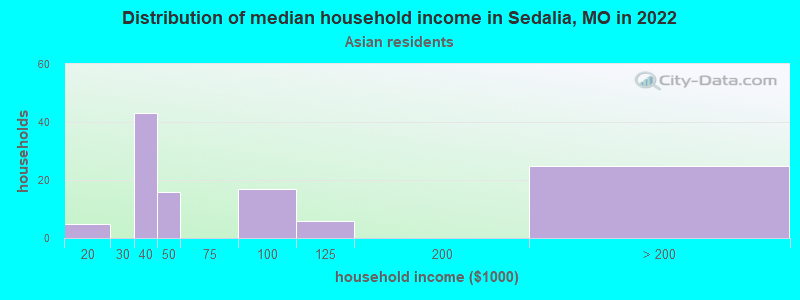
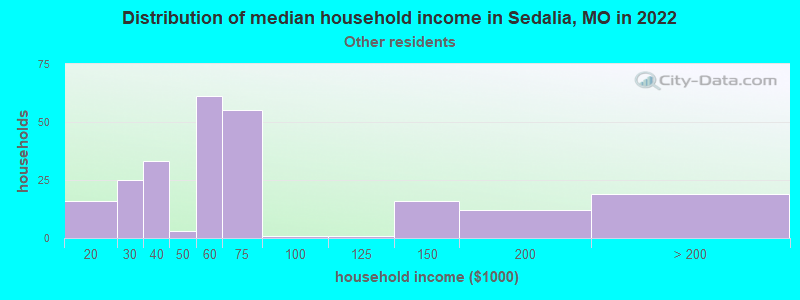
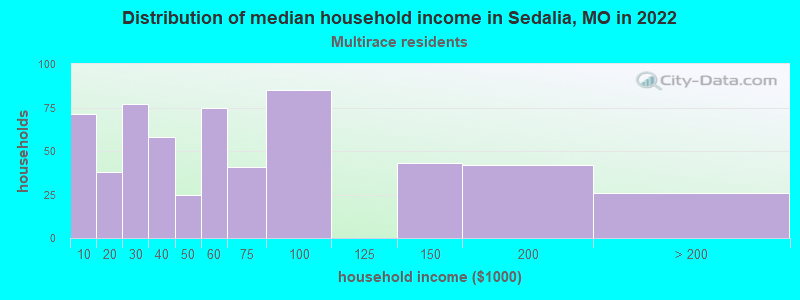
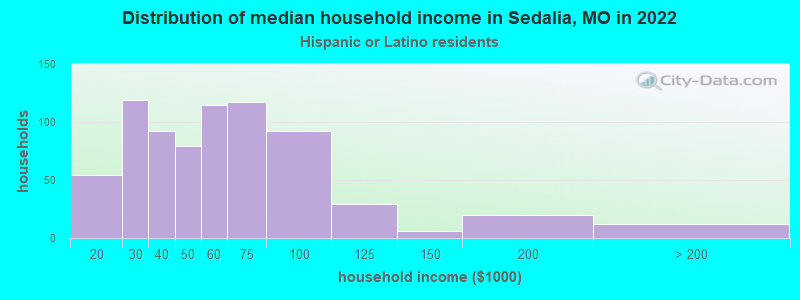
Income and house value in Sedalia Median household income in 2022 $48,011 White non-Hispanic householders$40,713 Black householders$54,236 Some other race householders$56,694 Two or more races householders$54,045 Hispanic or Latino race householdersMedian 2022 house value $142,053 White Non-Hispanic householders$111,038 Black or African American householders$153,891 American Indian or Alaska Native householders $266,350 Asian householders$171,648 Some other race householders$96,596 Two or more races householders$170,701 Hispanic or Latino householders
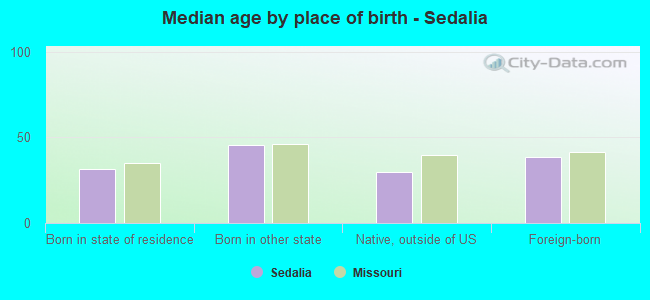
Median age by race in Sedalia
38.9 Median age for White residents36.9 41.1 40.6 Median age for Black or African American residents34.1 54.4 17.3 Median age for American Indian / Alaska Native residents-652,291,104.5 16.5 40.9 Median age for Asian residents57.3 40.4 -693,430,656.2 Median age for Native Hawaiian / Pacific Islander residents-683,513,838.1 -752,136,751.4 23.9 Median age for Other race residents19.5 27.3 20.3 Median age for Two or more races residents20.8 19.0 40.2 Median age for White alone residents38.2 42.2 21.8 Median age for Hispanic or Latino residents22.5 20.9
Owner/renter occupied households by race in Sedalia
House owners and renters - White residents 4,597 59.1% Owner occupied3,177 40.9% Renter occupiedHouse owners and renters - Black or African American residents 142 28.0% Owner occupied366 72.0% Renter occupiedHouse owners and renters - Asian residents 56 59.1% Owner occupied39 40.9% Renter occupiedHouse owners and renters - Other race residents 222 88.8% Owner occupied28 11.2% Renter occupiedHouse owners and renters - Two or more races residents 278 49.2% Owner occupied287 50.8% Renter occupiedHouse owners and renters - White alone residents 4,466 59.9% Owner occupied2,988 40.1% Renter occupiedHouse owners and renters - Hispanic or Latino residents 412 57.5% Owner occupied304 42.5% Renter occupied
Language usage in Sedalia
English speakers - Total 86.8% of residents of Sedalia speak English at home.
10.0% of residents speak Spanish at home 1,010 50.1% Speak English very well1,004 49.9% Speak English less than very well3.3% of residents speak other language at home 382 56.5% Speak English very well294 43.5% Speak English less than very well
English speakers - Born in the United States 93.8% of residents of Sedalia speak English at home.
2.7% of residents speak Spanish at home 78 65.5% Speak English very well41 34.5% Speak English less than very well3.5% of residents speak other language at home 146 93.0% Speak English very well11 7.0% Speak English less than very well
English speakers - Native, born elsewhere 43.8% of residents of Sedalia speak English at home.
45.8% of residents speak Spanish at home 88 80.0% Speak English very well22 20.0% Speak English less than very well
English speakers - Foreign-born 18.8% of residents of Sedalia speak English at home.
59.7% of residents speak Spanish at home 259 25.0% Speak English very well778 75.0% Speak English less than very well22.4% of residents speak other language at home 122 31.4% Speak English very well267 68.6% Speak English less than very well
White (Caucasian) - Speak only English Native:
95.7% (15,053)Foreign-born:
10.8% (69)
White (Caucasian) - Speak another language Native:
4.0% (629)Foreign-born:
88.6% (569)
Black or African American - Speak only English Native:
99.2% (718)Foreign-born:
84.2% (138)
Asian - Speak only English Native:
100.0% (28)Foreign-born:
69.9% (118)
Other race - Speak only English Native:
27.2% (134)Foreign-born:
3.1% (13)
Other race - Speak another language Native:
64.8% (320)Foreign-born:
92.9% (403)
Two or more races - Speak only English Native:
91.3% (1,391)Foreign-born:
1.2% (4)
Two or more races - Speak another language Native:
8.5% (130)Foreign-born:
100.0% (313)
White alone - Speak only English Native:
98.0% (14,625)Foreign-born:
10.3% (31)
White alone - Speak another language Native:
2.0% (304)Foreign-born:
94.4% (282)
Hispanic or Latino - Speak only English Native:
43.5% (738)Foreign-born:
5.6% (62)
Hispanic or Latino - Speak another language Native:
55.1% (934)Foreign-born:
94.1% (1,032)
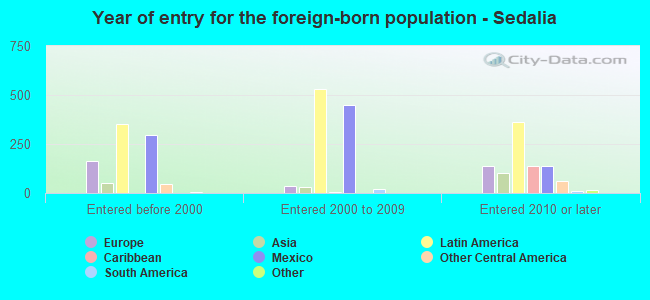
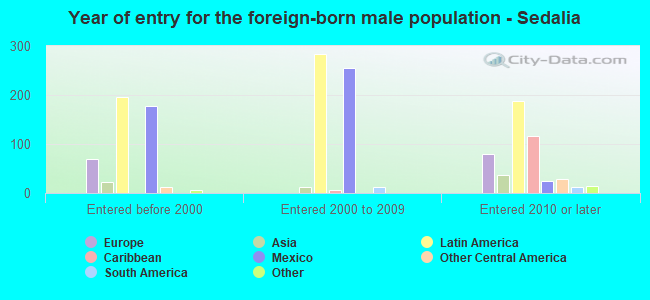
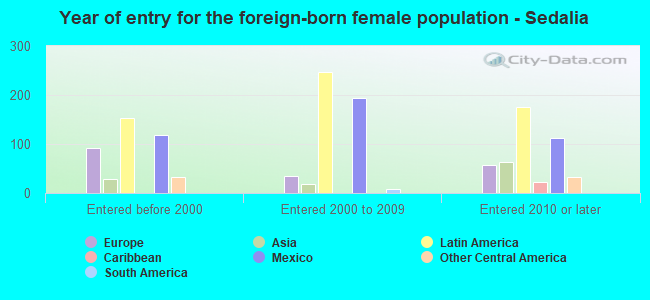
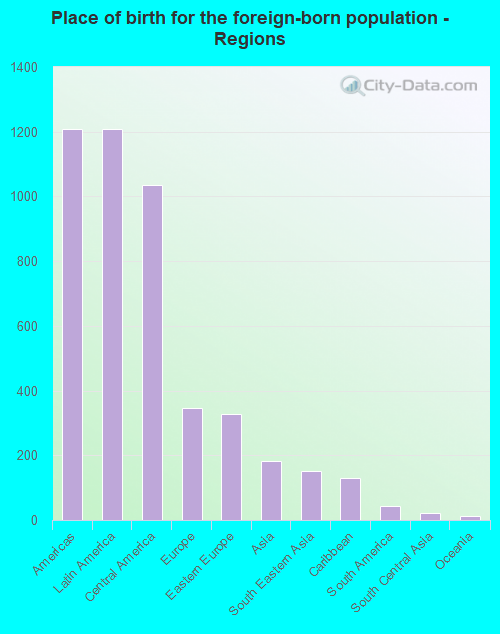
Foreign-born residents in Sedalia 1,757 residents are foreign born (5.7% Latin America , 1.6% Europe , 0.9% Asia ).
This city:
8.0%Missouri:
4.2%
Marital status for residents in Sedalia Marital status - White (Caucasian) population 15 years and over
Males 34.5% Never married45.6% Now married2.1% Separated3.1% Widowed14.8% DivorcedFemales 27.1% Never married41.7% Now married1.9% Separated11.9% Widowed17.5% DivorcedWomen who gave birth in the past 12 months Now married:
62.5% (160)Unmarried:
37.5% (96)
Women who did not give birth in the past 12 months Now married:
40.0% (1,475)Unmarried:
60.0% (2,211)
Marital status - Black or African American population 15 years and over
Males 52.7% Never married41.1% Now married1.6% Separated0.0% Widowed4.5% DivorcedFemales 49.4% Never married18.4% Now married9.6% Separated9.6% Widowed13.0% DivorcedWomen who gave birth in the past 12 months Now married:
0.0% (0)Unmarried:
100.0% (12)
Women who did not give birth in the past 12 months Now married:
14.3% (20)Unmarried:
85.7% (118)
Marital status - American Indian / Alaska Native population 15 years and over
Males 100.0% Never married0.0% Now married0.0% Separated0.0% Widowed0.0% DivorcedFemales 100.0% Never married0.0% Now married0.0% Separated0.0% Widowed0.0% DivorcedWomen who did not give birth in the past 12 months Now married:
0.0% (0)Unmarried:
100.0% (76)
Marital status - Asian population 15 years and over
Males 41.4% Never married48.5% Now married0.0% Separated0.0% Widowed10.1% DivorcedFemales 14.8% Never married48.9% Now married0.0% Separated27.3% Widowed9.1% DivorcedWomen who gave birth in the past 12 months Now married:
100.0% (42)Unmarried:
0.0% (0)
Women who did not give birth in the past 12 months Now married:
11.4% (4)Unmarried:
88.6% (33)
Marital status - Other race population 15 years and over
Males 49.2% Never married44.0% Now married0.0% Separated5.2% Widowed1.6% DivorcedFemales 35.1% Never married62.6% Now married0.0% Separated0.0% Widowed2.3% DivorcedWomen who gave birth in the past 12 months Now married:
100.0% (21)Unmarried:
0.0% (0)
Women who did not give birth in the past 12 months Now married:
56.4% (140)Unmarried:
43.6% (108)
Marital status - Two or more races population 15 years and over
Males 46.8% Never married41.1% Now married0.0% Separated0.7% Widowed11.3% DivorcedFemales 61.6% Never married25.1% Now married3.8% Separated1.9% Widowed7.6% DivorcedWomen who gave birth in the past 12 months Now married:
100.0% (43)Unmarried:
0.0% (0)
Women who did not give birth in the past 12 months Now married:
19.0% (98)Unmarried:
81.0% (419)
Marital status - White alone, not Hispanic / Latino population 15 years and over
Males 34.2% Never married45.2% Now married2.1% Separated3.4% Widowed15.2% DivorcedFemales 27.5% Never married40.8% Now married1.9% Separated12.4% Widowed17.4% DivorcedWomen who gave birth in the past 12 months Now married:
62.5% (161)Unmarried:
37.5% (97)
Women who did not give birth in the past 12 months Now married:
38.2% (1,316)Unmarried:
61.8% (2,133)
Marital status - Hispanic or Latino population 15 years and over
Males 39.4% Never married48.7% Now married1.2% Separated1.6% Widowed9.1% DivorcedFemales 31.4% Never married54.8% Now married1.5% Separated1.6% Widowed10.8% DivorcedWomen who gave birth in the past 12 months Now married:
100.0% (44)Unmarried:
0.0% (0)
Women who did not give birth in the past 12 months Now married:
55.1% (372)Unmarried:
44.9% (303)
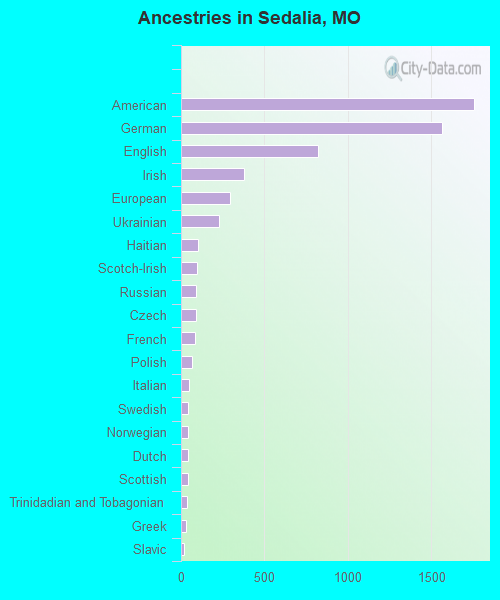
Ancestries in Sedalia
1,760 17.9% American1,568 16.0% German823 8.4% English379 3.9% Irish293 3.0% European227 2.3% Ukrainian102 1.0% Haitian95 1.0% Scotch-Irish93 0.9% Russian89 0.9% Czech83 0.8% French68 0.7% Polish49 0.5% Italian45 0.5% Swedish42 0.4% Norwegian41 0.4% Dutch41 0.4% Scottish37 0.4% Trinidadian and Tobagonian29 0.3% Greek19 0.2% Slavic14 0.1% Canadian13 0.1% Yugoslavian12 0.1% Welsh9 0.09% Ethiopian8 0.08% Northern European8 0.08% Scandinavian8 0.08% Somali6 0.06% Nigerian5 0.05% Brazilian
Geographical mobility in Sedalia Same house 1 year ago 15,248 87.3% White (Caucasian)684 76.5% Black or African American118 100.0% American Indian / Alaska Native199 97.2% Asian971 94.4% Other race2,029 96.0% Two or more races14,218 88.4% White alone, not Hispanic / Latino2,615 85.2% Hispanic or LatinoMoved within same county 1,181 6.8% White / Caucasian188 21.0% Black or African American13 94.6% Native Hawaiian / Pacific Islander14 1.4% Other race78 3.7% Two or more races947 5.9% White alone, not Hispanic / Latino252 8.2% Hispanic or LatinoMoved within same state 704 4.0% White / Caucasian5 0.5% Black or African American18 1.7% Other race21 1.0% Two or more races636 4.0% White alone, not Hispanic / Latino110 3.6% Hispanic or LatinoMoved from different state 281 1.6% White / Caucasian1 0.9% American Indian / Alaska Native9 4.3% Asian1 0.1% Other race259 1.6% White alone, not Hispanic / Latino29 1.0% Hispanic or LatinoMoved from abroad 22 0.1% White37 3.6% Other race23 0.1% White alone, not Hispanic / Latino33 1.1% Hispanic or Latino
Children Nativity (place of birth) in Sedalia
Children under 6 years - Living with two parents Both parents native 594 100.0% NativeBoth parents foreign-born 223 100.0% NativeOne native, one foreign-born parent 139 100.0% NativeChildren under 6 years - Living with one parent Native parent 823 100.0% NativeForeign-born parent 80 100.0% NativeChildren 6 to 17 years - Living with two parents Both parents native 1,314 100.0% NativeBoth parents foreign-born 341 87.2% Native50 12.8% Foreign-bornOne native, one foreign-born parent 185 96.9% Native6 3.1% Foreign-bornChildren 6 to 17 years - Living with one parent Native parent 1,146 100.0% NativeForeign-born parent 109 52.3% Native99 47.7% Foreign-born
Grandparents responsible for own grandchildren in Sedalia
Grandparents (30 to 59 years) White / Caucasian 69 41.9% Responsible for grandchildren95 58.1% Not responsible for grandchildrenOther race 2 100.0% Not responsible for grandchildrenWhite alone, not Hispanic / Latino 70 41.8% Responsible for grandchildren97 58.2% Not responsible for grandchildrenHispanic or Latino 2 100.0% Not responsible for grandchildrenGrandparents (60 years and over) White / Caucasian 128 55.5% Responsible for grandchildren102 44.5% Not responsible for grandchildrenOther race 28 100.0% Not responsible for grandchildrenWhite alone, not Hispanic / Latino 95 52.2% Responsible for grandchildren86 47.8% Not responsible for grandchildrenHispanic or Latino 54 54.8% Responsible for grandchildren45 45.2% Not responsible for grandchildren