Races in Selah, Washington (WA) Detailed Stats
Ancestries, Foreign-born residents, place of birth
Settings
X


Recent posts about races in Selah, Washington on our local forum with over 2,400,000 registered users:
 | Any advice on buying good land with house on it - somewhere around Selah - Ellensburg? (8 replies) |
| Small towns, rural feel, and crime rates? (46 replies) |
| Yakima! Real numbers (17 replies) |
| Yakima to Ellensburg. Where is the best place to live in this area??? (26 replies) |
| Curious about Washington (33 replies) |
| Yakima, is it as bad as they say? (28 replies) |
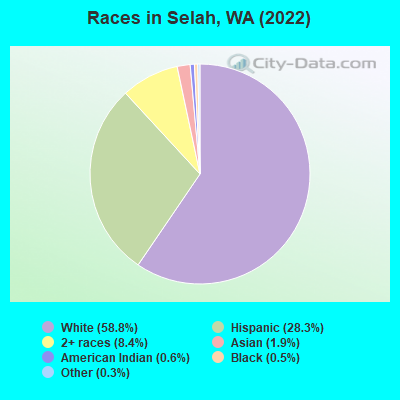
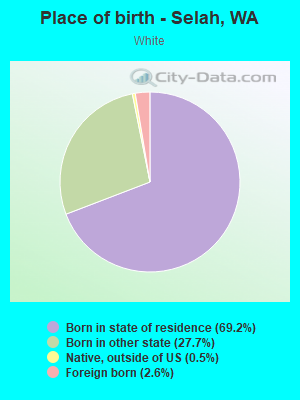
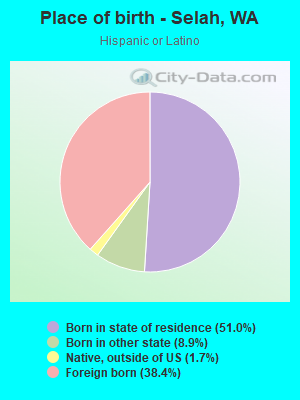
According to 2022 data, the most numerous races in Selah, WA are White alone (4,843 residents), Hispanic (2,330 residents), and Asian alone (154 residents). 71.3% of Selah residents speak English at home. 13.3% of Selah, WA residents are foreign-born (10.4% born in Latin America), which is 12.5% less than the foreign-born rate of 15.0% across the entire state of Washington.
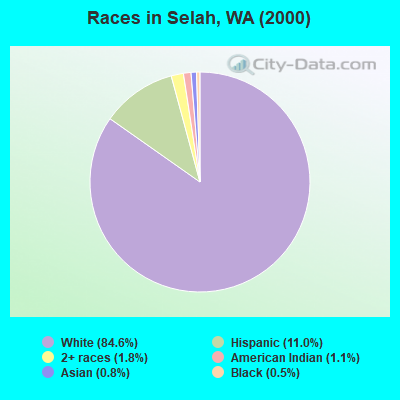
Race distribution in Selah
2000
2022

- 5,33984.6%White alone
- 69711.0%Hispanic
- 1111.8%Two or more races
- 721.1%American Indian alone
- 510.8%Asian alone
- 310.5%Black alone
- 50.08%Other race alone
- 40.06%Native Hawaiian and Other
Pacific Islander alone
-
- 4,84358.8%White alone
- 2,33028.3%Hispanic
- 6898.4%Two or more races
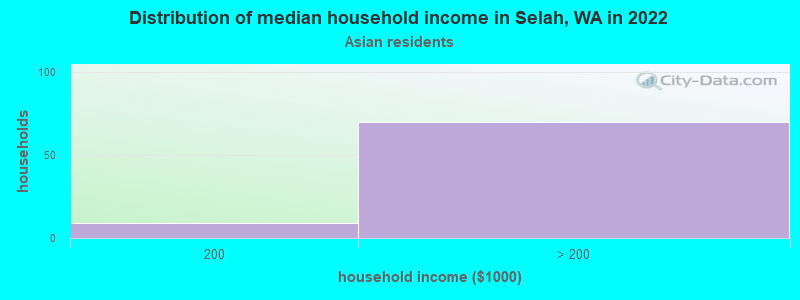
- 1541.9%Asian alone
- 470.6%American Indian alone
- 390.5%Black alone
- 240.3%Other race alone
2000
2022
-
- 4,652,49078.9%White alone
- 441,5097.5%Hispanic
- 319,4015.4%Asian alone
- 184,6313.1%Black alone
- 175,9263.0%Two or more races
- 85,3961.4%American Indian alone
- 22,7790.4%Native Hawaiian and Other
Pacific Islander alone - 11,9890.2%Other race alone

-
- 4,941,45663.5%White alone
- 1,093,31314.0%Hispanic
- 755,8329.7%Asian alone
- 523,4486.7%Two or more races
- 299,5373.8%Black alone
- 69,0240.9%American Indian alone
- 52,2310.7%Native Hawaiian and Other
Pacific Islander alone - 50,9450.7%Other race alone

Income and house value in Selah
- Median household income in 2022
- $68,554White non-Hispanic householders
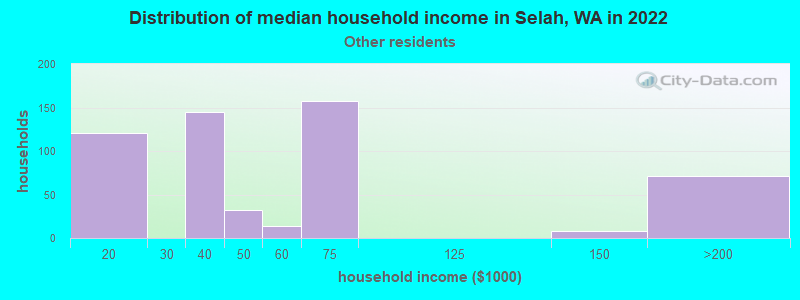
- $59,908Some other race householders
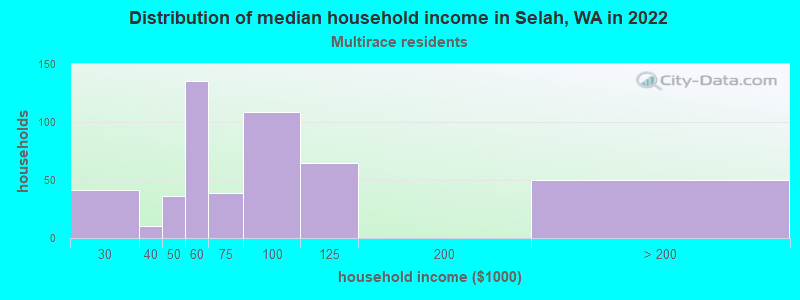
- $53,560Two or more races householders
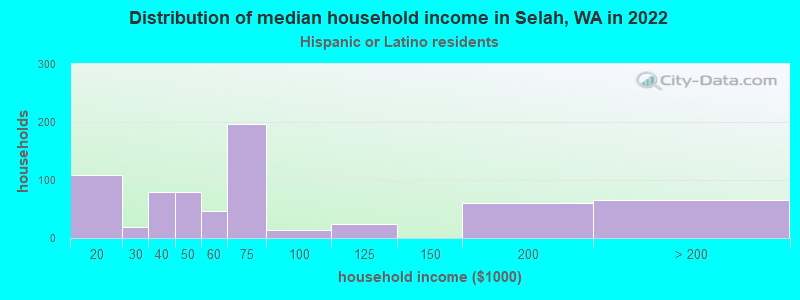
- $61,860Hispanic or Latino race householders
- Median 2022 house value
- $377,668White Non-Hispanic householders
- $209,784Some other race householders
- $530,830Two or more races householders
- $215,729Hispanic or Latino householders
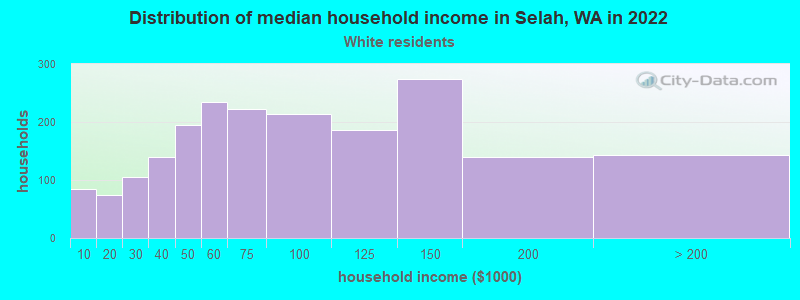
Household income for White non-Hispanic householders
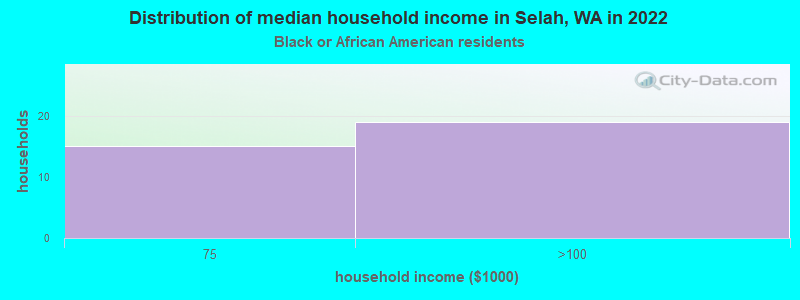
Household income for Black householders
Household income for Asian householders
Household income for Some other race householders
Household income for Two or more races householders
Household income for Hispanic or Latino race householders
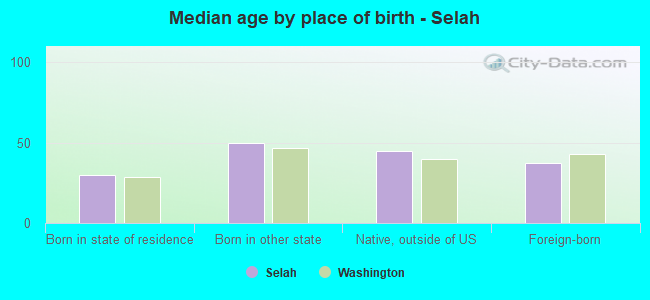
Median age by race in Selah
- 46.2Median age for White residents
- 49.2Males
- 43.8Females
- 12.5Median age for Black or African American residents
- -684,418,145.3Males
- -711,934,155.7Females
- 30.0Median age for American Indian / Alaska Native residents
- -574,324,323.8Males
- 30.5Females
- 32.9Median age for Asian residents
- 38.2Males
- 32.1Females
- -681,388,011.9Median age for Native Hawaiian / Pacific Islander residents
- -696,774,192.9Males
- -666,666,666.0Females
- 26.2Median age for Other race residents
- 25.3Males
- 28.6Females
- 17.2Median age for Two or more races residents
- 32.9Males
- 17.8Females
- 43.2Median age for White alone residents
- 43.5Males
- 43.6Females
- 22.5Median age for Hispanic or Latino residents
- 19.3Males
- 24.6Females
Owner/renter occupied households by race in Selah
- House owners and renters - White residents
- 1,26262.7%Owner occupied
- 75237.3%Renter occupied
- House owners and renters - Black or African American residents
- 1747.5%Owner occupied
- 1952.5%Renter occupied
- House owners and renters - American Indian / Alaska Native residents
- 4100.0%Renter occupied
- House owners and renters - Asian residents
- 8595.8%Owner occupied
- 44.2%Renter occupied
- House owners and renters - Other race residents
- 30851.8%Owner occupied
- 28648.2%Renter occupied
- House owners and renters - Two or more races residents
- 25245.7%Owner occupied
- 29954.3%Renter occupied
- House owners and renters - White alone residents
- 1,35661.1%Owner occupied
- 86538.9%Renter occupied
- House owners and renters - Hispanic or Latino residents
- 33845.8%Owner occupied
- 39954.2%Renter occupied
Language usage in Selah
- English speakers - Total
- 71.3% of residents of Selah speak English at home.
- 25.6% of residents speak Spanish at home
- 1,47574.8%Speak English very well
- 49625.2%Speak English less than very well
- 1.7% of residents speak other language at home
- 12597.7%Speak English very well
- 32.3%Speak English less than very well
- English speakers - Born in the United States
- 82.6% of residents of Selah speak English at home.
- 13.9% of residents speak Spanish at home
- 22597.8%Speak English very well
- 52.2%Speak English less than very well
- 0.9% of residents speak other language at home
- 15100.0%Speak English very well
- English speakers - Native, born elsewhere
- 41.7% of residents of Selah speak English at home.
- 38.9% of residents speak Spanish at home
- 28100.0%Speak English very well
- English speakers - Foreign-born
- 11.9% of residents of Selah speak English at home.
- 74.4% of residents speak Spanish at home
- 50865.1%Speak English very well
- 27234.9%Speak English less than very well
- 8.2% of residents speak other language at home
- 8497.7%Speak English very well
- 22.3%Speak English less than very well
White (Caucasian) - Speak only English
| Native: | 100.0% (4,319) |
| Foreign-born: | 39.7% (47) |
White (Caucasian) - Speak another language
| Native: | 3.5% (152) |
| Foreign-born: | 63.3% (75) |
Asian - Speak only English
| Native: | 94.9% (69) |
| Foreign-born: | 29.2% (23) |
Asian - Speak another language
| Native: | 8.2% (6) |
| Foreign-born: | 71.7% (56) |
Other race - Speak another language
| Native: | 95.6% (701) |
| Foreign-born: | 99.2% (878) |
Two or more races - Speak only English
| Native: | 60.9% (673) |
| Foreign-born: | 43.0% (58) |
Two or more races - Speak another language
| Native: | 29.1% (321) |
| Foreign-born: | 63.5% (85) |
White alone - Speak only English
| Native: | 96.3% (4,401) |
| Foreign-born: | 60.2% (50) |
White alone - Speak another language
| Native: | 3.5% (160) |
| Foreign-born: | 36.2% (30) |
Hispanic or Latino - Speak only English
| Native: | 26.3% (328) |
| Foreign-born: | 4.5% (41) |
Hispanic or Latino - Speak another language
| Native: | 73.9% (920) |
| Foreign-born: | 95.1% (850) |
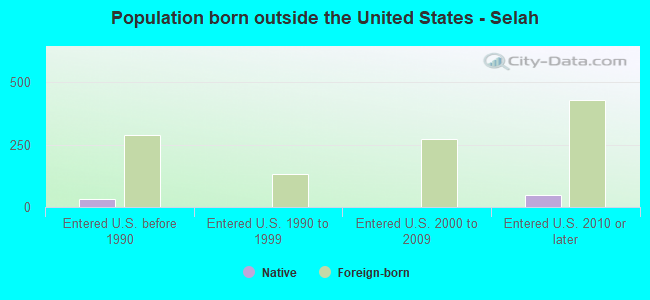
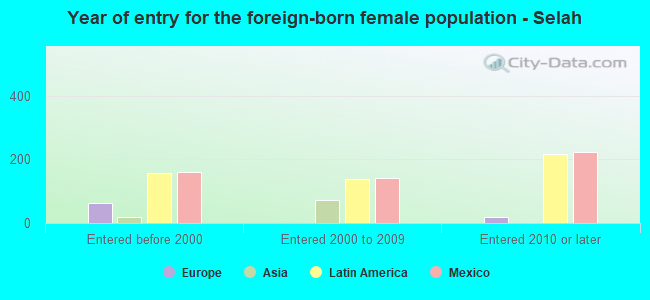
Foreign-born residents in Selah
1,097 residents are foreign born (10.4% Latin America).
| This city: | 13.3% |
| Washington: | 14.9% |
Marital status for residents in Selah
Marital status - White (Caucasian) population 15 years and over
- Males
- 24.3%Never married
- 56.7%Now married
- 1.7%Separated
- 3.4%Widowed
- 13.8%Divorced
- Females
- 28.0%Never married
- 42.2%Now married
- 0.0%Separated
- 8.8%Widowed
- 21.1%Divorced
Women who gave birth in the past 12 months
| Now married: | 100.0% (44) |
| Unmarried: | 0.0% (0) |
Women who did not give birth in the past 12 months
| Now married: | 36.4% (384) |
| Unmarried: | 63.6% (671) |
Marital status - Black or African American population 15 years and over
- Males
- 100.0%Never married
- 0.0%Now married
- 0.0%Separated
- 0.0%Widowed
- 0.0%Divorced
- Females
- 0.0%Never married
- 0.0%Now married
- 0.0%Separated
- 0.0%Widowed
- 100.0%Divorced
Marital status - Asian population 15 years and over
- Males
- 0.0%Never married
- 100.0%Now married
- 0.0%Separated
- 0.0%Widowed
- 0.0%Divorced
- Females
- 11.0%Never married
- 89.0%Now married
- 0.0%Separated
- 0.0%Widowed
- 0.0%Divorced
Women who did not give birth in the past 12 months
| Now married: | 89.0% (88) |
| Unmarried: | 11.0% (11) |
Marital status - Other race population 15 years and over
- Males
- 25.9%Never married
- 60.0%Now married
- 0.0%Separated
- 0.0%Widowed
- 14.1%Divorced
- Females
- 24.3%Never married
- 73.7%Now married
- 0.0%Separated
- 0.0%Widowed
- 2.0%Divorced
Women who did not give birth in the past 12 months
| Now married: | 72.5% (380) |
| Unmarried: | 27.5% (144) |
Marital status - Two or more races population 15 years and over
- Males
- 24.8%Never married
- 14.3%Now married
- 0.0%Separated
- 0.0%Widowed
- 61.0%Divorced
- Females
- 48.1%Never married
- 31.0%Now married
- 2.5%Separated
- 2.5%Widowed
- 15.8%Divorced
Women who did not give birth in the past 12 months
| Now married: | 31.4% (126) |
| Unmarried: | 68.6% (276) |
Marital status - White alone, not Hispanic / Latino population 15 years and over
- Males
- 24.7%Never married
- 55.9%Now married
- 1.8%Separated
- 3.5%Widowed
- 14.1%Divorced
- Females
- 27.2%Never married
- 41.9%Now married
- 0.0%Separated
- 9.4%Widowed
- 21.5%Divorced
Women who gave birth in the past 12 months
| Now married: | 100.0% (55) |
| Unmarried: | 0.0% (0) |
Women who did not give birth in the past 12 months
| Now married: | 34.7% (421) |
| Unmarried: | 65.3% (793) |
Marital status - Hispanic or Latino population 15 years and over
- Males
- 28.3%Never married
- 57.5%Now married
- 0.0%Separated
- 0.0%Widowed
- 14.2%Divorced
- Females
- 28.4%Never married
- 62.5%Now married
- 0.0%Separated
- 1.6%Widowed
- 7.5%Divorced
Women who did not give birth in the past 12 months
| Now married: | 66.2% (471) |
| Unmarried: | 33.8% (240) |
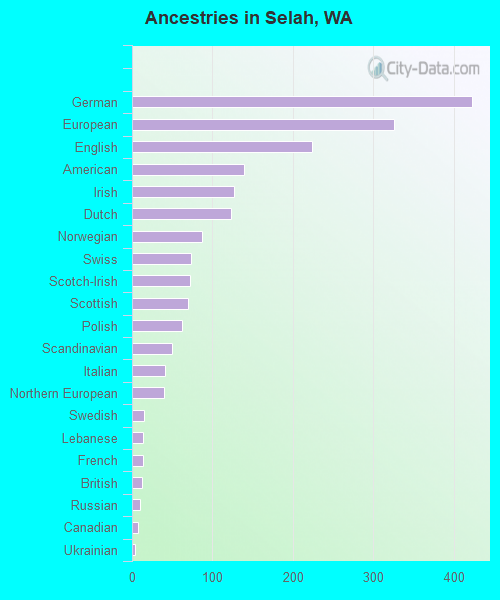
Ancestries in Selah

- 42310.3%German
- 3268.0%European
- 2245.5%English
- 1393.4%American
- 1273.1%Irish
- 1233.0%Dutch
- 872.1%Norwegian
- 731.8%Swiss
- 721.8%Scotch-Irish
- 701.7%Scottish
- 621.5%Polish
- 501.2%Scandinavian
- 411.0%Italian
- 401.0%Northern European
- 150.4%Swedish
- 140.3%Lebanese
- 140.3%French
- 120.3%British
- 100.2%Russian
- 80.2%Canadian
- 40.10%Ukrainian
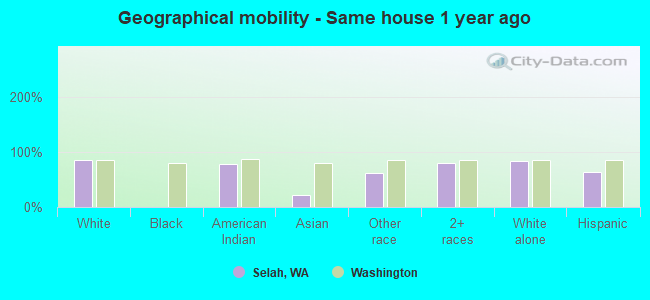
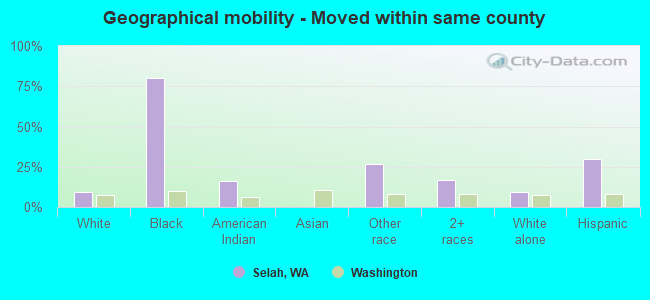
Geographical mobility in Selah

- Same house 1 year ago
- 3,53184.9%White (Caucasian)
- 4377.8%American Indian / Alaska Native
- 3622.0%Asian
- 1,09462.8%Other race
- 1,22480.6%Two or more races
- 4,08084.7%White alone, not Hispanic / Latino
- 1,48163.7%Hispanic or Latino
-
- Moved within same county
- 3839.2%White / Caucasian
- 6080.1%Black or African American
- 916.3%American Indian / Alaska Native
- 46226.5%Other race
- 25516.8%Two or more races
- 4379.1%White alone, not Hispanic / Latino
- 69529.9%Hispanic or Latino
-
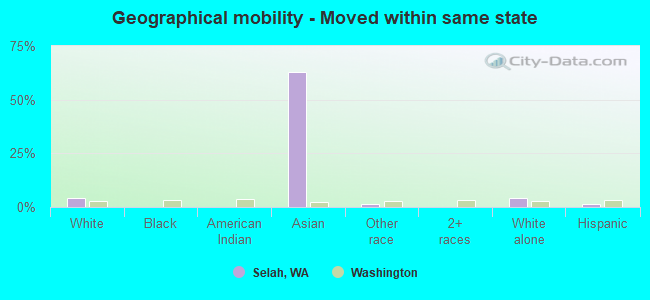
- Moved within same state
- 1754.2%White / Caucasian
- 10262.9%Asian
- 211.2%Other race
- 1914.0%White alone, not Hispanic / Latino
- 281.2%Hispanic or Latino
-
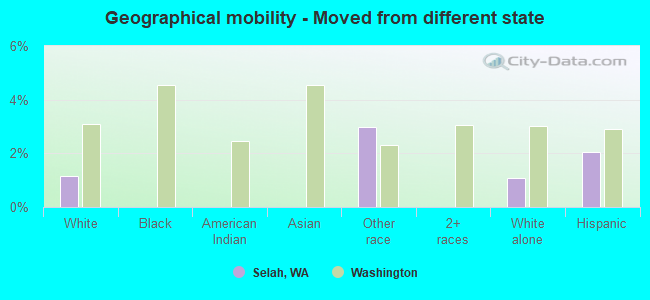
- Moved from different state
- 481.2%White / Caucasian
- 523.0%Other race
- 521.1%White alone, not Hispanic / Latino
- 482.1%Hispanic or Latino
-
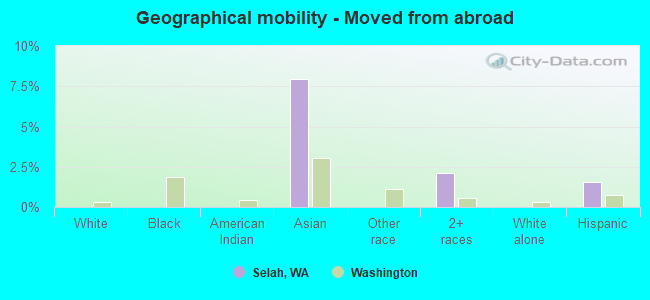
- Moved from abroad
- 137.9%Asian
- 322.1%Two or more races
- 361.6%Hispanic or Latino
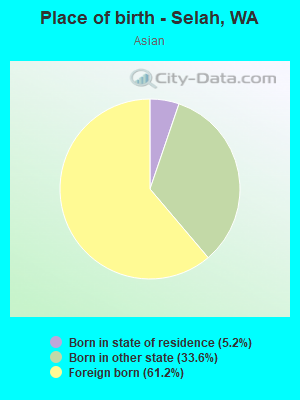
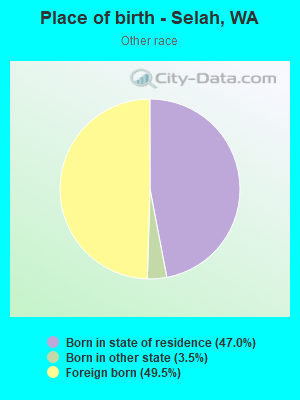
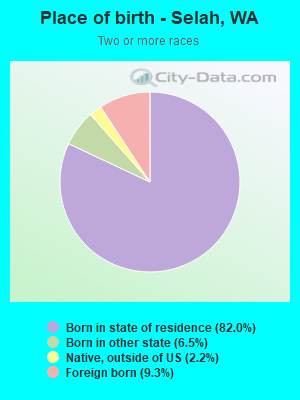
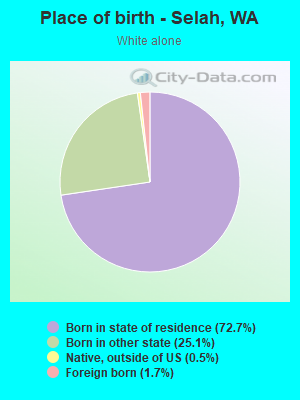
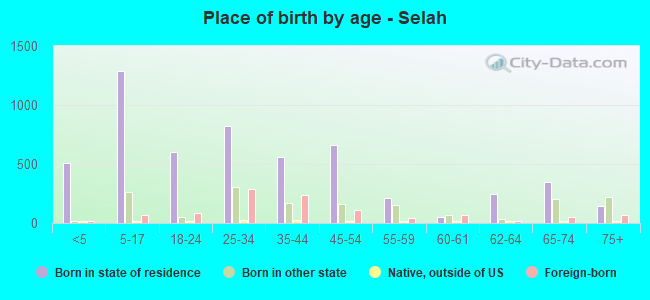
Children Nativity (place of birth) in Selah
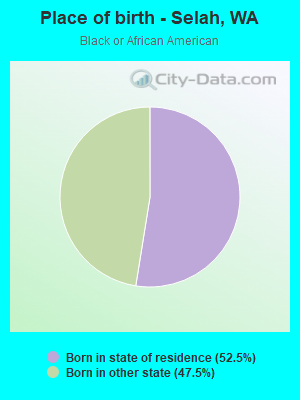
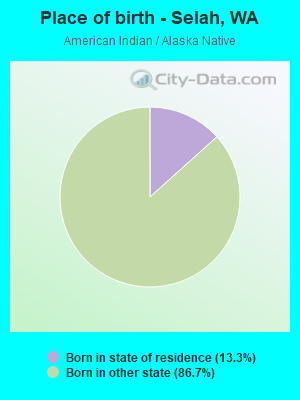
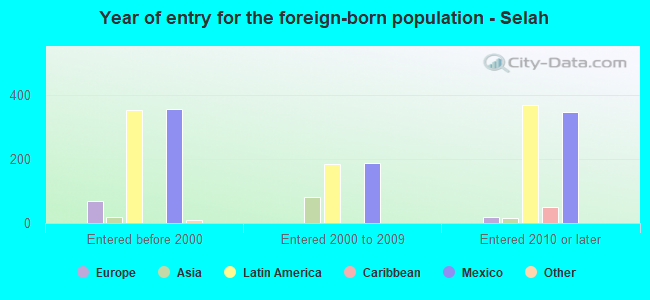
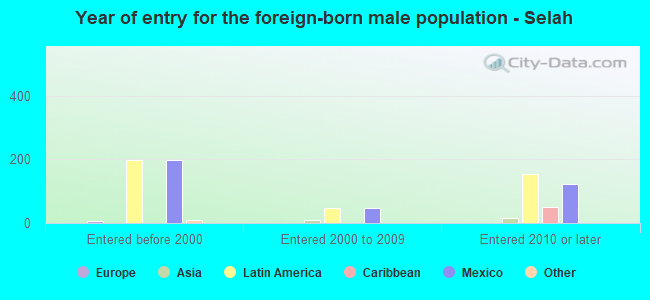
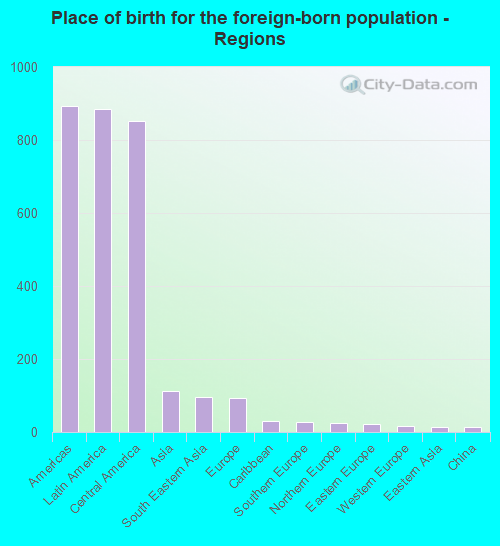
Place of birth for residents in Selah
![Place of birth for the foreign-born population - Regions]()
- 892Americas
- 884Latin America
- 853Central America
- 111Asia
- 97South Eastern Asia
- 93Europe
- 31Caribbean
- 28Southern Europe
- 25Northern Europe
- 22Eastern Europe
- 16Western Europe
- 13Eastern Asia
- 13China
- 8Northern America
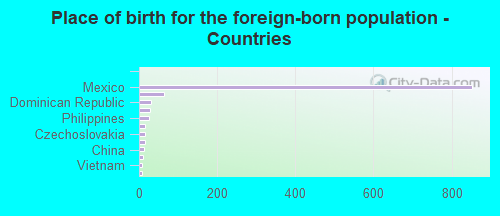
![Place of birth for the foreign-born population - Countries]()
- 853Mexico
- 63Burma (Myanmar)
- 31Dominican Republic
- 28Spain
- 25Philippines
- 16Switzerland
- 16Czechoslovakia
- 15Ireland
- 13China
- 10Scotland
- 8Vietnam
- 8Canada
- 6Ukraine
Grandparents responsible for own grandchildren in Selah
Zip codes: 98942.