Races in Seneca, New York (NY) Detailed Stats
Ancestries, Foreign-born residents, place of birth
1.5% of Seneca, NY residents are foreign-born , which is 1365.4% less than the foreign-born rate of 22.0% across the entire state of New York.
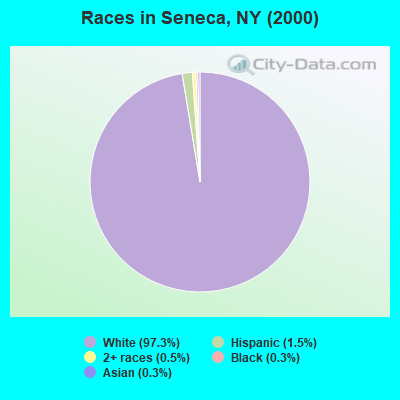
Race distribution in Seneca

- 2,65797.3%White alone
- 411.5%Hispanic
- 140.5%Two or more races
- 90.3%Black alone
- 70.3%Asian alone
- 20.07%American Indian alone
- 10.04%Other race alone
2000
2022
-
- 11,760,98162.0%White alone
- 2,867,58315.1%Hispanic
- 2,812,62314.8%Black alone
- 1,035,9265.5%Asian alone
- 366,1161.9%Two or more races
- 75,4990.4%Other race alone
- 52,4990.3%American Indian alone
- 5,2300.03%Native Hawaiian and Other
Pacific Islander alone

-
- 10,408,93352.9%White alone
- 3,867,29919.7%Hispanic
- 2,633,84013.4%Black alone
- 1,776,2869.0%Asian alone
- 732,6703.7%Two or more races
- 216,1101.1%Other race alone
- 35,0820.2%American Indian alone
- 6,9310.04%Native Hawaiian and Other
Pacific Islander alone

Income and house value in Seneca
- Median household income in 2022
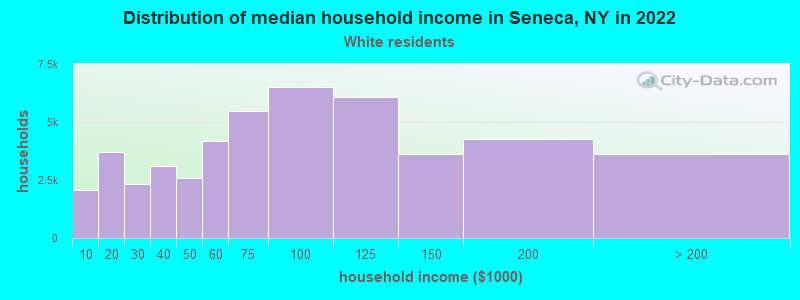
- $81,629White non-Hispanic householders
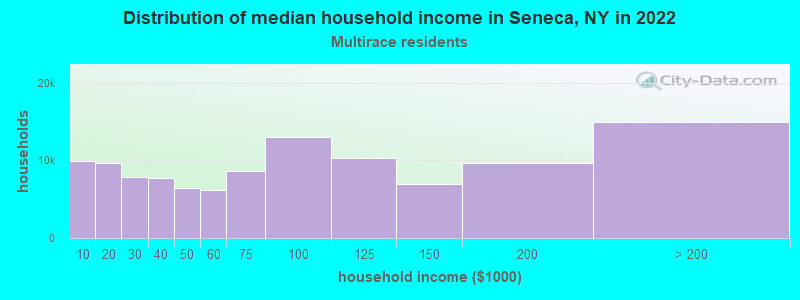
- $25,046Two or more races householders
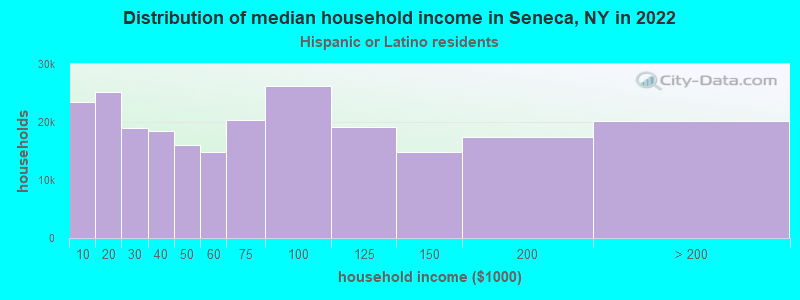
- $20,531Hispanic or Latino race householders
- Median 2022 house value
- $195,945White Non-Hispanic householders
- $260,565Two or more races householders
Household income for White non-Hispanic householders
Household income for Two or more races householders
Household income for Hispanic or Latino race householders
Foreign-born residents in Seneca
41 residents are foreign born
| This city: | 1.5% |
| New York: | 20.4% |
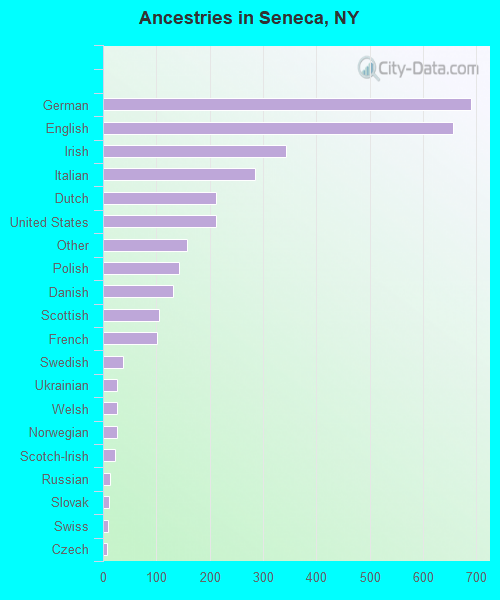
Ancestries in Seneca

- 68921.4%German
- 65620.4%English
- 34310.7%Irish
- 2858.9%Italian
- 2116.6%Dutch
- 2116.6%United States
- 1574.9%Other
- 1424.4%Polish
- 1314.1%Danish
- 1053.3%Scottish
- 1013.1%French
- 381.2%Swedish
- 270.8%Ukrainian
- 270.8%Welsh
- 260.8%Norwegian
- 230.7%Scotch-Irish
- 130.4%Russian
- 120.4%Slovak
- 100.3%Swiss
- 70.2%Czech
Zip codes: 14561.