Races in Seymour, Indiana (IN) Detailed Stats
Data:
Races - White alone (%)
Races - White alone (% change since 2000)
Races - Black alone (%)
Races - Black alone (% change since 2000)
Races - American Indian alone (%)
Races - American Indian alone (% change since 2000)
Races - Asian alone (%)
Races - Asian alone (% change since 2000)
Races - Hispanic (%)
Races - Hispanic (% change since 2000)
Races - Native Hawaiian and Other Pacific Islander alone (%)
Races - Native Hawaiian and Other Pacific Islander alone (% change since 2000)
Races - Two or more races(%)
Races - Two or more races(% change since 2000)
Races - Other race alone (%)
Races - Other race alone (% change since 2000)
Racial diversity
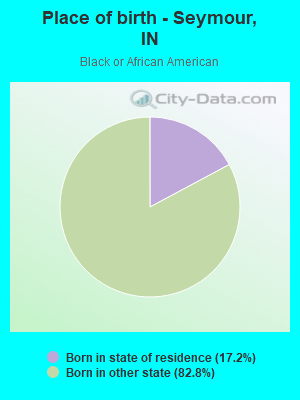
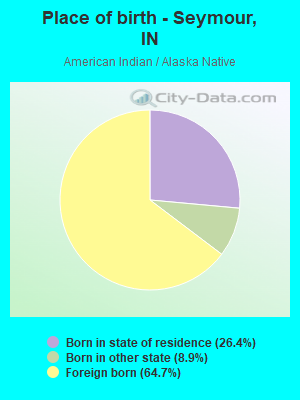
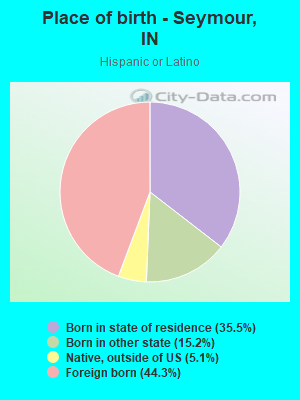
Place of birth - Born in state of residence (%)
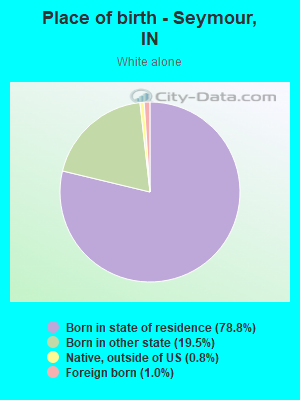
Place of birth - Born in state of residence (%) - White
Place of birth - Born in state of residence (%) - Black or African American
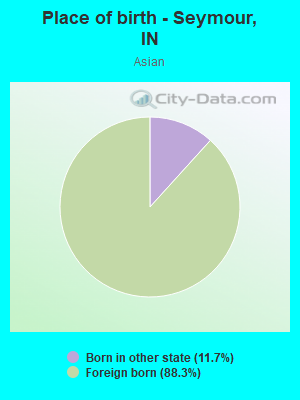
Place of birth - Born in state of residence (%) - Asian
Place of birth - Born in state of residence (%) - Hispanic or Latino
Place of birth - Born in state of residence (%) - American Indian and Alaska Native
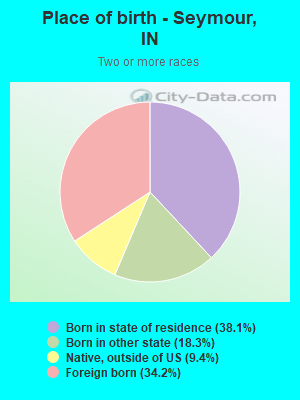
Place of birth - Born in state of residence (%) - Multirace
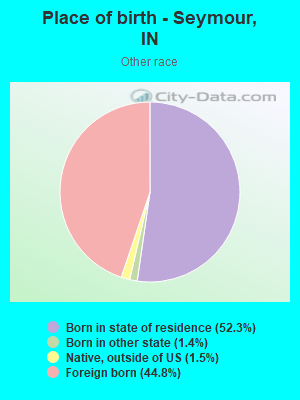
Place of birth - Born in state of residence (%) - Other Race
Place of birth - Born in other state (%)
Place of birth - Born in other state (%) - White
Place of birth - Born in other state (%) - Black or African American
Place of birth - Born in other state (%) - Asian
Place of birth - Born in other state (%) - Hispanic or Latino
Place of birth - Born in other state (%) - American Indian and Alaska Native
Place of birth - Born in other state (%) - Multirace
Place of birth - Born in other state (%) - Other Race
Place of birth - Native, outside of US (%)
Place of birth - Native, outside of US (%) - White
Place of birth - Native, outside of US (%) - Black or African American
Place of birth - Native, outside of US (%) - Asian
Place of birth - Native, outside of US (%) - Hispanic or Latino
Place of birth - Native, outside of US (%) - American Indian and Alaska Native
Place of birth - Native, outside of US (%) - Multirace
Place of birth - Native, outside of US (%) - Other Race
Place of birth - Foreign born (%)
Place of birth - Foreign born (%) - White
Place of birth - Foreign born (%) - Black or African American
Place of birth - Foreign born (%) - Asian
Place of birth - Foreign born (%) - Hispanic or Latino
Place of birth - Foreign born (%) - American Indian and Alaska Native
Place of birth - Foreign born (%) - Multirace
Place of birth - Foreign born (%) - Other Race
Residents speaking English at home (%)
Residents speaking English at home - Born in the United States (%)
Residents speaking English at home - Native, born elsewhere (%)
Residents speaking English at home - Foreign born (%)
Residents speaking Spanish at home (%)
Residents speaking Spanish at home - Born in the United States (%)
Residents speaking Spanish at home - Native, born elsewhere (%)
Residents speaking Spanish at home - Foreign born (%)
Residents speaking other language at home (%)
Residents speaking other language at home - Born in the United States (%)
Residents speaking other language at home - Native, born elsewhere (%)
Residents speaking other language at home - Foreign born (%)
Marital status - Never married (%)
Marital status - Now married (%)
Marital status - Separated (%)
Marital status - Widowed (%)
Marital status - Divorced (%)
Ancestries Reported - Arab (%)
Ancestries Reported - Czech (%)
Ancestries Reported - Danish (%)
Ancestries Reported - Dutch (%)
Ancestries Reported - English (%)
Ancestries Reported - French (%)
Ancestries Reported - French Canadian (%)
Ancestries Reported - German (%)
Ancestries Reported - Greek (%)
Ancestries Reported - Hungarian (%)
Ancestries Reported - Irish (%)
Ancestries Reported - Italian (%)
Ancestries Reported - Lithuanian (%)
Ancestries Reported - Norwegian (%)
Ancestries Reported - Polish (%)
Ancestries Reported - Portuguese (%)
Ancestries Reported - Russian (%)
Ancestries Reported - Scotch-Irish (%)
Ancestries Reported - Scottish (%)
Ancestries Reported - Slovak (%)
Ancestries Reported - Subsaharan African (%)
Ancestries Reported - Swedish (%)
Ancestries Reported - Swiss (%)
Ancestries Reported - Ukrainian (%)
Ancestries Reported - United States (%)
Ancestries Reported - Welsh (%)
Ancestries Reported - West Indian (%)
Ancestries Reported - Other (%)
Geographical mobility - Same house 1 year ago (%)
Geographical mobility - Same house 1 year ago (%) - White
Geographical mobility - Same house 1 year ago (%) - Black or African American
Geographical mobility - Same house 1 year ago (%) - Asian
Geographical mobility - Same house 1 year ago (%) - Hispanic or Latino
Geographical mobility - Same house 1 year ago (%) - American Indian and Alaska Native
Geographical mobility - Same house 1 year ago (%) - Multirace
Geographical mobility - Same house 1 year ago (%) - Other Race
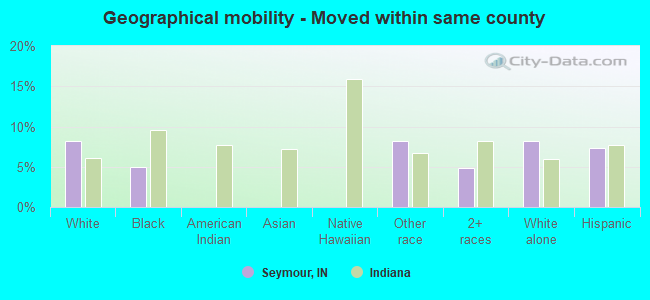
Geographical mobility - Moved within same county (%)
Geographical mobility - Moved within same county (%) - White
Geographical mobility - Moved within same county (%) - Black or African American
Geographical mobility - Moved within same county (%) - Asian
Geographical mobility - Moved within same county (%) - Hispanic or Latino
Geographical mobility - Moved within same county (%) - American Indian and Alaska Native
Geographical mobility - Moved within same county (%) - Multirace
Geographical mobility - Moved within same county (%) - Other Race
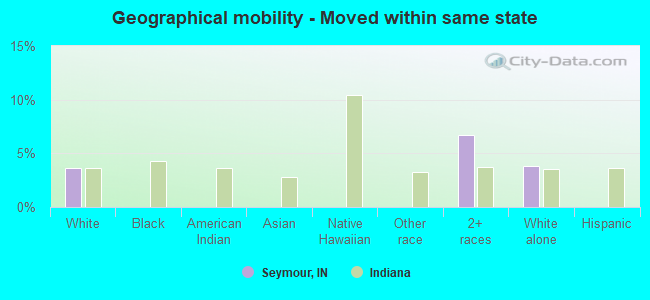
Geographical mobility - Moved from different county within same state (%)
Geographical mobility - Moved from different county within same state (%) - White
Geographical mobility - Moved from different county within same state (%) - Black or African American
Geographical mobility - Moved from different county within same state (%) - Asian
Geographical mobility - Moved from different county within same state (%) - Hispanic or Latino
Geographical mobility - Moved from different county within same state (%) - American Indian and Alaska Native
Geographical mobility - Moved from different county within same state (%) - Multirace
Geographical mobility - Moved from different county within same state (%) - Other Race
Geographical mobility - Moved from different state (%)
Geographical mobility - Moved from different state (%) - White
Geographical mobility - Moved from different state (%) - Black or African American
Geographical mobility - Moved from different state (%) - Asian
Geographical mobility - Moved from different state (%) - Hispanic or Latino
Geographical mobility - Moved from different state (%) - American Indian and Alaska Native
Geographical mobility - Moved from different state (%) - Multirace
Geographical mobility - Moved from different state (%) - Other Race
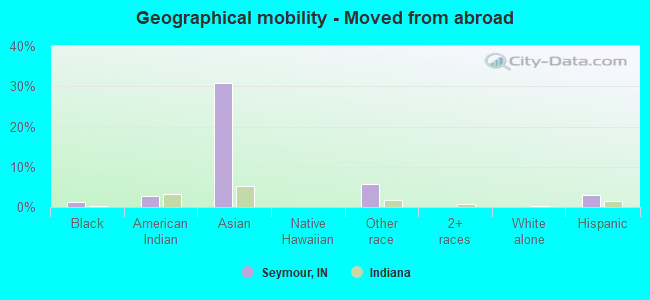
Geographical mobility - Moved from abroad (%)
Geographical mobility - Moved from abroad (%) - White
Geographical mobility - Moved from abroad (%) - Black or African American
Geographical mobility - Moved from abroad (%) - Asian
Geographical mobility - Moved from abroad (%) - Hispanic or Latino
Geographical mobility - Moved from abroad (%) - American Indian and Alaska Native
Geographical mobility - Moved from abroad (%) - Multirace
Geographical mobility - Moved from abroad (%) - Other Race
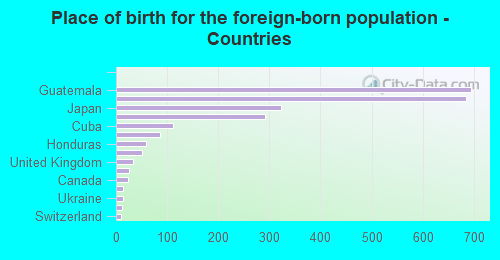
Place of birth for the foreign-born population - Ireland (%)
Place of birth for the foreign-born population - Denmark (%)
Place of birth for the foreign-born population - Norway (%)
Place of birth for the foreign-born population - Sweden (%)
Place of birth for the foreign-born population - United Kingdom (%)
Place of birth for the foreign-born population - England (%)
Place of birth for the foreign-born population - Scotland (%)
Place of birth for the foreign-born population - Other Northern Europe (%)
Place of birth for the foreign-born population - Austria (%)
Place of birth for the foreign-born population - Belgium (%)
Place of birth for the foreign-born population - France (%)
Place of birth for the foreign-born population - Germany (%)
Place of birth for the foreign-born population - Netherlands (%)
Place of birth for the foreign-born population - Switzerland (%)
Place of birth for the foreign-born population - Other Western Europe (%)
Place of birth for the foreign-born population - Greece (%)
Place of birth for the foreign-born population - Italy (%)
Place of birth for the foreign-born population - Portugal (%)
Place of birth for the foreign-born population - Spain (%)
Place of birth for the foreign-born population - Other Southern Europe (%)
Place of birth for the foreign-born population - Albania (%)
Place of birth for the foreign-born population - Belarus (%)
Place of birth for the foreign-born population - Bosnia and Herzegovina (%)
Place of birth for the foreign-born population - Bulgaria (%)
Place of birth for the foreign-born population - Croatia (%)
Place of birth for the foreign-born population - Czechoslovakia (%)
Place of birth for the foreign-born population - Hungary (%)
Place of birth for the foreign-born population - Latvia (%)
Place of birth for the foreign-born population - Lithuania (%)
Place of birth for the foreign-born population - North Macedonia (Macedonia) (%)
Place of birth for the foreign-born population - Moldova (%)
Place of birth for the foreign-born population - Poland (%)
Place of birth for the foreign-born population - Romania (%)
Place of birth for the foreign-born population - Russia (%)
Place of birth for the foreign-born population - Serbia (%)
Place of birth for the foreign-born population - Ukraine (%)
Place of birth for the foreign-born population - Other Eastern Europe (%)
Place of birth for the foreign-born population - China (%)
Place of birth for the foreign-born population - Hong Kong (%)
Place of birth for the foreign-born population - Taiwan (%)
Place of birth for the foreign-born population - Japan (%)
Place of birth for the foreign-born population - Korea (%)
Place of birth for the foreign-born population - Other Eastern Asia (%)
Place of birth for the foreign-born population - Afghanistan (%)
Place of birth for the foreign-born population - Bangladesh (%)
Place of birth for the foreign-born population - India (%)
Place of birth for the foreign-born population - Iran (%)
Place of birth for the foreign-born population - Kazakhstan (%)
Place of birth for the foreign-born population - Nepal (%)
Place of birth for the foreign-born population - Pakistan (%)
Place of birth for the foreign-born population - Sri Lanka (%)
Place of birth for the foreign-born population - Uzbekistan (%)
Place of birth for the foreign-born population - Other South Central Asia (%)
Place of birth for the foreign-born population - Burma (%)
Place of birth for the foreign-born population - Cambodia (%)
Place of birth for the foreign-born population - Indonesia (%)
Place of birth for the foreign-born population - Laos (%)
Place of birth for the foreign-born population - Malaysia (%)
Place of birth for the foreign-born population - Philippines (%)
Place of birth for the foreign-born population - Singapore (%)
Place of birth for the foreign-born population - Thailand (%)
Place of birth for the foreign-born population - Vietnam (%)
Place of birth for the foreign-born population - Other South Eastern Asia (%)
Place of birth for the foreign-born population - Armenia (%)
Place of birth for the foreign-born population - Iraq (%)
Place of birth for the foreign-born population - Israel (%)
Place of birth for the foreign-born population - Jordan (%)
Place of birth for the foreign-born population - Kuwait (%)
Place of birth for the foreign-born population - Lebanon (%)
Place of birth for the foreign-born population - Saudi Arabia (%)
Place of birth for the foreign-born population - Syria (%)
Place of birth for the foreign-born population - Turkey (%)
Place of birth for the foreign-born population - Yemen (%)
Place of birth for the foreign-born population - Other Western Asia (%)
Place of birth for the foreign-born population - Eritrea (%)
Place of birth for the foreign-born population - Ethiopia (%)
Place of birth for the foreign-born population - Kenya (%)
Place of birth for the foreign-born population - Somalia (%)
Place of birth for the foreign-born population - Uganda (%)
Place of birth for the foreign-born population - Zimbabwe (%)
Place of birth for the foreign-born population - Other Eastern Africa (%)
Place of birth for the foreign-born population - Cameroon (%)
Place of birth for the foreign-born population - Congo (%)
Place of birth for the foreign-born population - Democratic Republic of Congo (Zaire) (%)
Place of birth for the foreign-born population - Other Middle Africa (%)
Place of birth for the foreign-born population - Egypt (%)
Place of birth for the foreign-born population - Morocco (%)
Place of birth for the foreign-born population - Sudan (%)
Place of birth for the foreign-born population - Other Northern Africa (%)
Place of birth for the foreign-born population - South Africa (%)
Place of birth for the foreign-born population - Other Southern Africa (%)
Place of birth for the foreign-born population - Cabo Verde (%)
Place of birth for the foreign-born population - Ghana (%)
Place of birth for the foreign-born population - Liberia (%)
Place of birth for the foreign-born population - Nigeria (%)
Place of birth for the foreign-born population - Senegal (%)
Place of birth for the foreign-born population - Sierra Leone (%)
Place of birth for the foreign-born population - Other Western Africa (%)
Place of birth for the foreign-born population - Australia (%)
Place of birth for the foreign-born population - New Zealand (%)
Place of birth for the foreign-born population - Fiji (%)
Place of birth for the foreign-born population - Micronesia (%)
Place of birth for the foreign-born population - Bahamas (%)
Place of birth for the foreign-born population - Barbados (%)
Place of birth for the foreign-born population - Cuba (%)
Place of birth for the foreign-born population - Dominica (%)
Place of birth for the foreign-born population - Dominican Republic (%)
Place of birth for the foreign-born population - Grenada (%)
Place of birth for the foreign-born population - Haiti (%)
Place of birth for the foreign-born population - Jamaica (%)
Place of birth for the foreign-born population - St. Vincent and the Grenadines (%)
Place of birth for the foreign-born population - Trinidad and Tobago (%)
Place of birth for the foreign-born population - West Indies (%)
Place of birth for the foreign-born population - Other Caribbean (%)
Place of birth for the foreign-born population - Belize (%)
Place of birth for the foreign-born population - Costa Rica (%)
Place of birth for the foreign-born population - El Salvador (%)
Place of birth for the foreign-born population - Guatemala (%)
Place of birth for the foreign-born population - Honduras (%)
Place of birth for the foreign-born population - Mexico (%)
Place of birth for the foreign-born population - Nicaragua (%)
Place of birth for the foreign-born population - Panama (%)
Place of birth for the foreign-born population - Other Central America (%)
Place of birth for the foreign-born population - Argentina (%)
Place of birth for the foreign-born population - Bolivia (%)
Place of birth for the foreign-born population - Brazil (%)
Place of birth for the foreign-born population - Chile (%)
Place of birth for the foreign-born population - Colombia (%)
Place of birth for the foreign-born population - Ecuador (%)
Place of birth for the foreign-born population - Guyana (%)
Place of birth for the foreign-born population - Peru (%)
Place of birth for the foreign-born population - Uruguay (%)
Place of birth for the foreign-born population - Venezuela (%)
Place of birth for the foreign-born population - Other South America (%)
Place of birth for the foreign-born population - Canada (%)
Place of birth for the foreign-born population - Other Northern America (%)
Place of birth for the foreign-born population - Other (%)
Latest news about races in Seymour, IN collected exclusively by city-data.com from local newspapers, TV, and radio stations
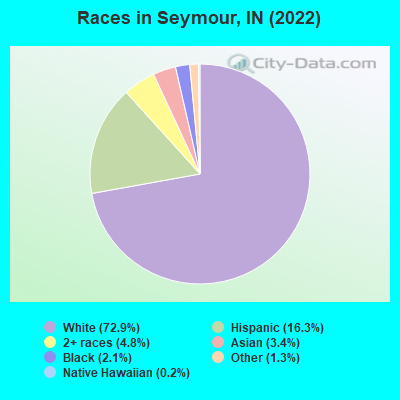
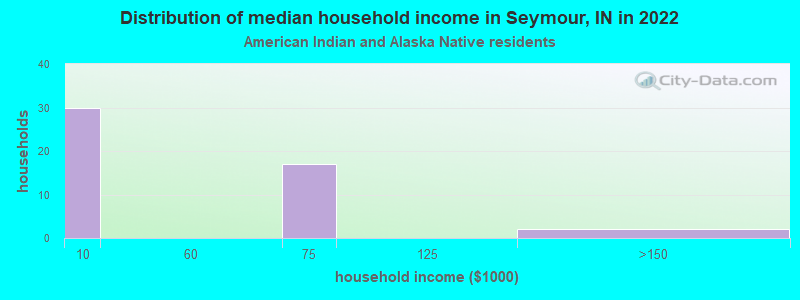
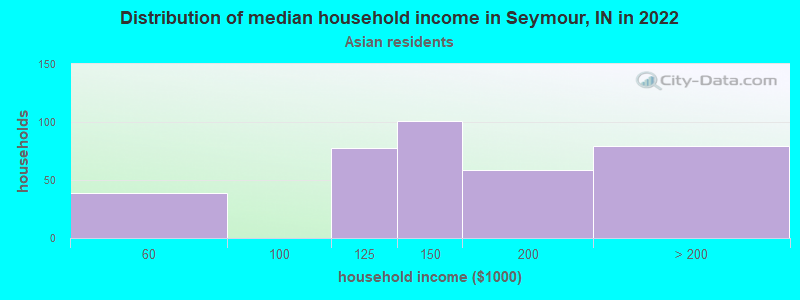
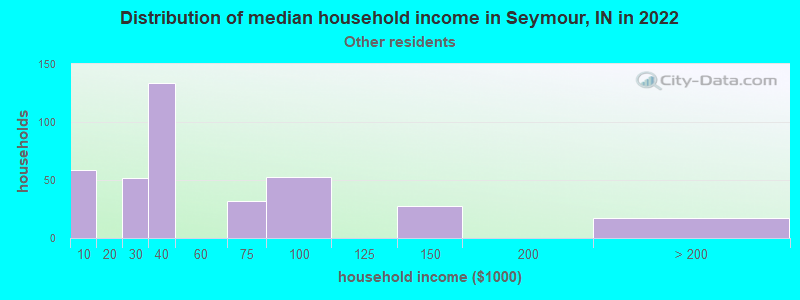
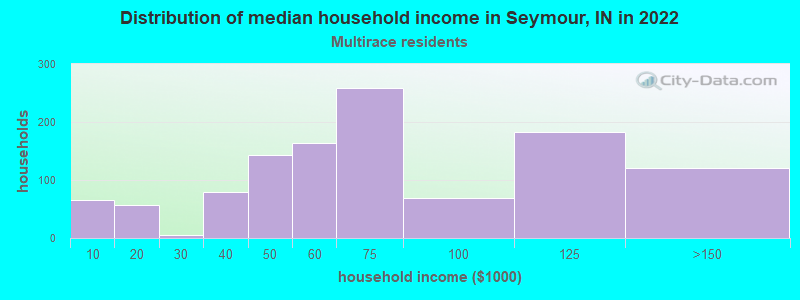
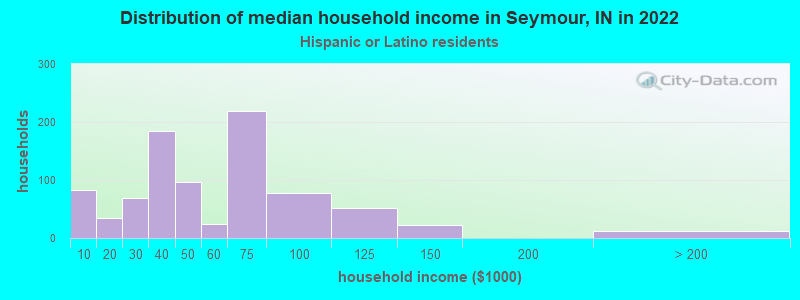
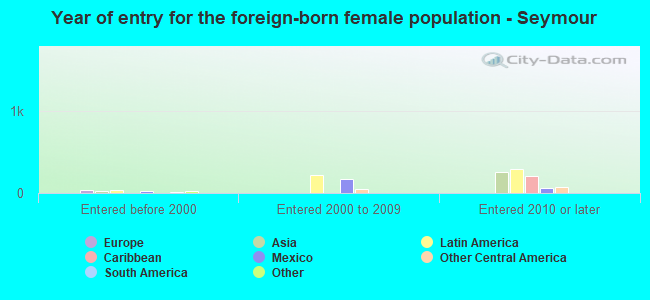
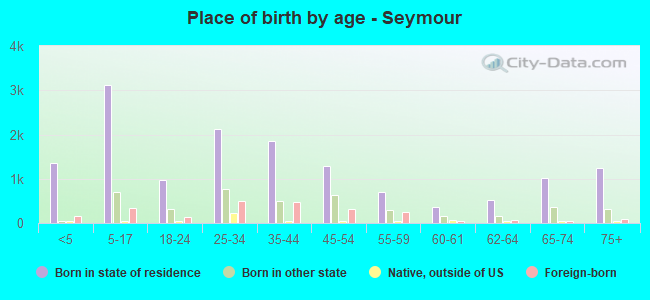
According to 2022 data, the most numerous races in Seymour, IN are White alone (15,697 residents), Black alone (447 residents), and Hispanic (3,503 residents). 84.3% of Seymour residents speak English at home. 11.3% of Seymour, IN residents are foreign-born (6.7% born in Latin America, 3.0% born in Asia), which is 47.0% greater than the foreign-born rate of 6.0% across the entire state of Indiana.
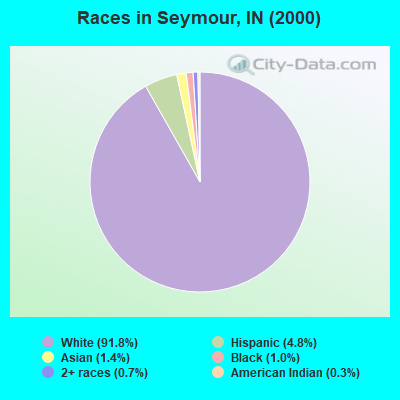
Race distribution in Seymour
2000 2022
5,219,373 85.8% White alone 505,462 8.3% Black alone 214,536 3.5% Hispanic 61,115 1.0% Two or more races 58,424 1.0% Asian alone 13,654 0.2% American Indian alone 6,348 0.1% Other race alone 1,573 0.03% Native Hawaiian and Other
5,192,455 76.0% White alone 628,054 9.2% Black alone 534,528 7.8% Hispanic 263,242 3.9% Two or more races 172,880 2.5% Asian alone 33,467 0.5% Other race alone 5,866 0.09% American Indian alone 2,545 0.04% Native Hawaiian and Other
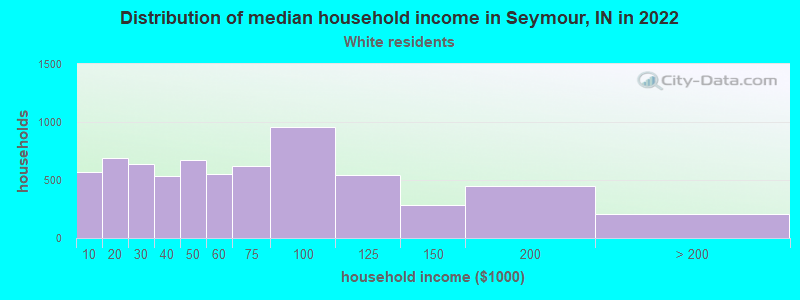
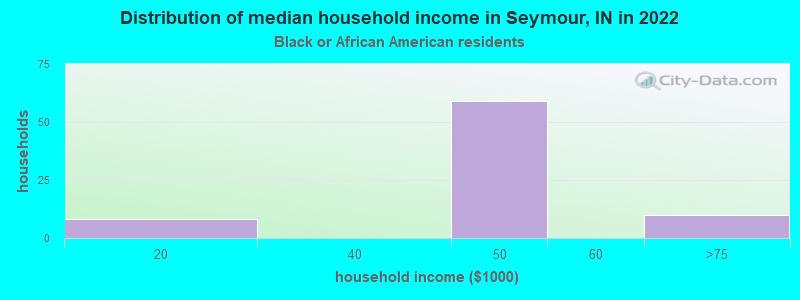
Income and house value in Seymour Median household income in 2022 $55,765 White non-Hispanic householders$50,418 Black householders$156,950 Asian householders$38,110 Some other race householders$61,367 Two or more races householders$45,988 Hispanic or Latino race householdersMedian 2022 house value $171,002 White Non-Hispanic householders$134,017 Black or African American householders$197,390 American Indian or Alaska Native householders $231,673 Asian householders$197,390 Some other race householders$171,417 Two or more races householders$214,843 Hispanic or Latino householders
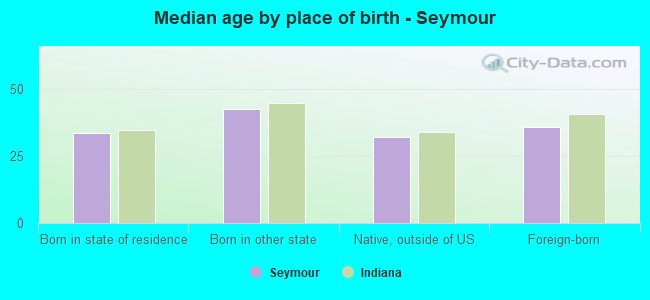
Median age by race in Seymour
39.1 Median age for White residents37.0 42.8 29.2 Median age for Black or African American residents24.9 32.3 19.9 Median age for American Indian / Alaska Native residents30.0 8.9 37.2 Median age for Asian residents37.9 35.2 -664,335,663.7 Median age for Native Hawaiian / Pacific Islander residents-644,025,156.6 -664,437,011.6 24.5 Median age for Other race residents24.2 19.1 22.3 Median age for Two or more races residents15.8 32.4 40.6 Median age for White alone residents38.0 43.4 16.8 Median age for Hispanic or Latino residents16.1 17.5
Owner/renter occupied households by race in Seymour
House owners and renters - White residents 4,178 62.9% Owner occupied2,463 37.1% Renter occupiedHouse owners and renters - Black or African American residents 8 10.5% Owner occupied72 89.5% Renter occupiedHouse owners and renters - American Indian / Alaska Native residents 11 23.8% Owner occupied35 76.2% Renter occupiedHouse owners and renters - Asian residents 313 100.0% Renter occupiedHouse owners and renters - Other race residents 146 36.5% Owner occupied255 63.5% Renter occupiedHouse owners and renters - Two or more races residents 749 66.4% Owner occupied380 33.6% Renter occupiedHouse owners and renters - White alone residents 4,185 62.9% Owner occupied2,470 37.1% Renter occupiedHouse owners and renters - Hispanic or Latino residents 400 46.2% Owner occupied465 53.8% Renter occupied
Language usage in Seymour
English speakers - Total 84.3% of residents of Seymour speak English at home.
12.0% of residents speak Spanish at home 1,154 48.1% Speak English very well1,246 51.9% Speak English less than very well4.1% of residents speak other language at home 300 36.5% Speak English very well522 63.5% Speak English less than very well
English speakers - Born in the United States 92.1% of residents of Seymour speak English at home.
7.4% of residents speak Spanish at home 253 81.4% Speak English very well58 18.6% Speak English less than very well0.5% of residents speak other language at home 23 100.0% Speak English very well
English speakers - Native, born elsewhere 50.3% of residents of Seymour speak English at home.
48.2% of residents speak Spanish at home 25 13.7% Speak English very well158 86.3% Speak English less than very well
English speakers - Foreign-born 10.0% of residents of Seymour speak English at home.
56.2% of residents speak Spanish at home 221 17.7% Speak English very well1,026 82.3% Speak English less than very well35.3% of residents speak other language at home 252 32.2% Speak English very well530 67.8% Speak English less than very well
White (Caucasian) - Speak only English Native:
98.1% (14,539)Foreign-born:
73.9% (115)
White (Caucasian) - Speak another language Native:
2.0% (295)Foreign-born:
34.1% (53)
American Indian / Alaska Native - Speak another language Native:
78.5% (18)Foreign-born:
100.0% (164)
Other race - Speak only English Native:
38.5% (261)Foreign-born:
15.6% (103)
Other race - Speak another language Native:
59.3% (402)Foreign-born:
85.2% (564)
Two or more races - Speak only English Native:
68.9% (1,430)Foreign-born:
1.8% (16)
Two or more races - Speak another language Native:
33.5% (695)Foreign-born:
97.3% (832)
White alone - Speak only English Native:
99.4% (14,519)Foreign-born:
76.9% (123)
White alone - Speak another language Native:
0.5% (70)Foreign-born:
18.3% (29)
Hispanic or Latino - Speak only English Native:
27.6% (428)Foreign-born:
7.1% (97)
Hispanic or Latino - Speak another language Native:
74.0% (1,148)Foreign-born:
92.7% (1,261)
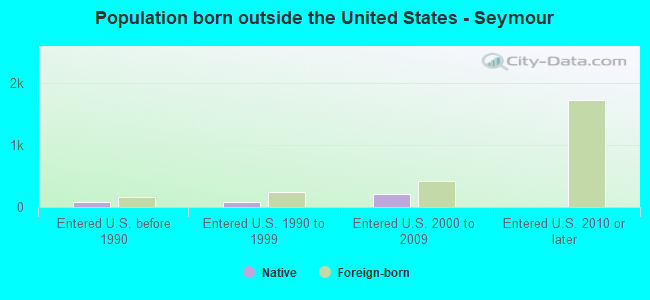
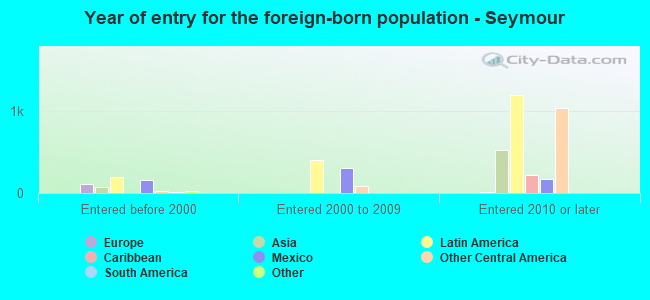
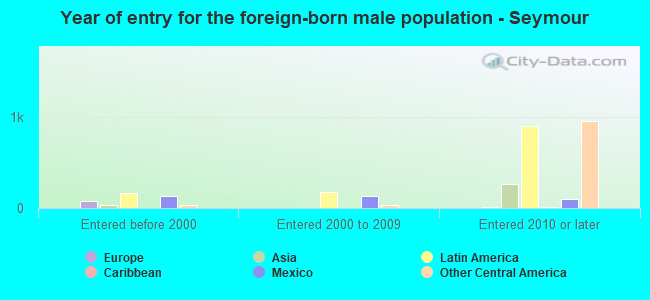
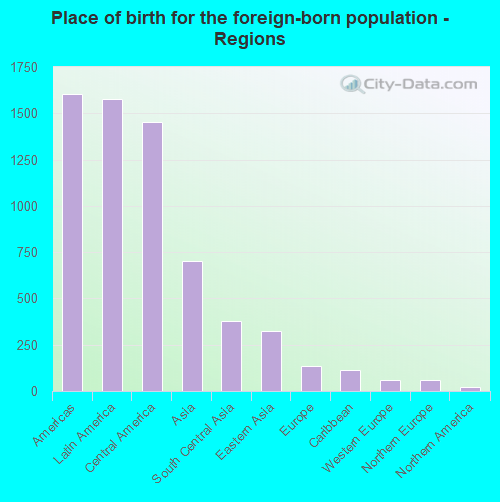
Foreign-born residents in Seymour 2,437 residents are foreign born (6.7% Latin America , 3.0% Asia ).
This city:
11.3%Indiana:
5.6%
Marital status for residents in Seymour Marital status - White (Caucasian) population 15 years and over
Males 29.3% Never married47.2% Now married0.5% Separated2.4% Widowed20.7% DivorcedFemales 25.2% Never married40.1% Now married3.1% Separated15.6% Widowed16.1% DivorcedWomen who gave birth in the past 12 months Now married:
82.6% (187)Unmarried:
17.4% (40)
Women who did not give birth in the past 12 months Now married:
43.3% (1,535)Unmarried:
56.7% (2,010)
Marital status - Black or African American population 15 years and over
Males 90.6% Never married4.3% Now married2.0% Separated0.0% Widowed3.1% DivorcedFemales 69.4% Never married0.0% Now married0.0% Separated30.6% Widowed0.0% DivorcedWomen who did not give birth in the past 12 months Now married:
0.0% (0)Unmarried:
100.0% (136)
Marital status - American Indian / Alaska Native population 15 years and over
Males 48.7% Never married28.2% Now married0.0% Separated0.0% Widowed23.1% DivorcedFemales 0.0% Never married100.0% Now married0.0% Separated0.0% Widowed0.0% DivorcedWomen who gave birth in the past 12 months Now married:
100.0% (5)Unmarried:
0.0% (0)
Women who did not give birth in the past 12 months Now married:
100.0% (61)Unmarried:
0.0% (0)
Marital status - Asian population 15 years and over
Males 0.0% Never married100.0% Now married0.0% Separated0.0% Widowed0.0% DivorcedFemales 0.0% Never married78.2% Now married0.0% Separated0.0% Widowed21.8% DivorcedWomen who did not give birth in the past 12 months Now married:
76.6% (243)Unmarried:
23.4% (74)
Marital status - Other race population 15 years and over
Males 58.2% Never married33.2% Now married0.0% Separated8.6% Widowed0.0% DivorcedFemales 40.5% Never married22.5% Now married5.1% Separated0.0% Widowed31.9% DivorcedWomen who did not give birth in the past 12 months Now married:
51.1% (118)Unmarried:
48.9% (113)
Marital status - Two or more races population 15 years and over
Males 48.8% Never married35.4% Now married1.4% Separated6.4% Widowed7.9% DivorcedFemales 56.4% Never married38.7% Now married0.0% Separated3.1% Widowed1.8% DivorcedWomen who did not give birth in the past 12 months Now married:
39.1% (358)Unmarried:
60.9% (558)
Marital status - White alone, not Hispanic / Latino population 15 years and over
Males 29.4% Never married47.0% Now married0.5% Separated2.4% Widowed20.8% DivorcedFemales 25.3% Never married39.7% Now married3.0% Separated15.7% Widowed16.2% DivorcedWomen who gave birth in the past 12 months Now married:
82.6% (191)Unmarried:
17.4% (40)
Women who did not give birth in the past 12 months Now married:
42.5% (1,507)Unmarried:
57.5% (2,039)
Marital status - Hispanic or Latino population 15 years and over
Males 54.0% Never married35.3% Now married0.9% Separated3.8% Widowed6.0% DivorcedFemales 39.0% Never married41.3% Now married3.2% Separated2.2% Widowed14.4% DivorcedWomen who gave birth in the past 12 months Now married:
100.0% (2)Unmarried:
0.0% (0)
Women who did not give birth in the past 12 months Now married:
57.1% (365)Unmarried:
42.9% (274)
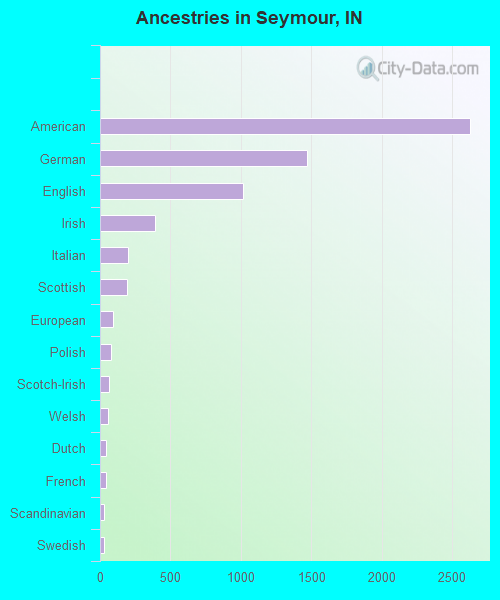
Ancestries in Seymour
2,632 24.3% American1,470 13.6% German1,016 9.4% English392 3.6% Irish202 1.9% Italian191 1.8% Scottish91 0.8% European80 0.7% Polish67 0.6% Scotch-Irish54 0.5% Welsh45 0.4% Dutch42 0.4% French31 0.3% Scandinavian28 0.3% Swedish21 0.2% Pennsylvania German11 0.1% British7 0.06% Austrian4 0.04% Danish
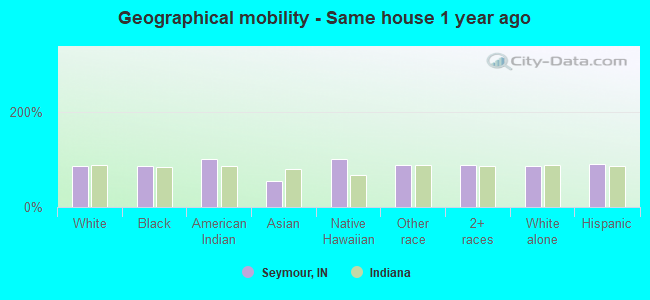
Geographical mobility in Seymour Same house 1 year ago 13,654 86.2% White (Caucasian)385 85.6% Black or African American280 100.0% American Indian / Alaska Native403 55.2% Asian32 100.0% Native Hawaiian / Pacific Islander1,214 87.5% Other race2,875 88.0% Two or more races13,310 85.9% White alone, not Hispanic / Latino3,114 90.7% Hispanic or LatinoMoved within same county 1,291 8.1% White / Caucasian23 5.0% Black or African American114 8.2% Other race160 4.9% Two or more races1,272 8.2% White alone, not Hispanic / Latino250 7.3% Hispanic or LatinoMoved within same state 575 3.6% White / Caucasian221 6.8% Two or more races585 3.8% White alone, not Hispanic / LatinoMoved from different state 247 1.6% White / Caucasian28 6.2% Black or African American154 21.1% Asian252 1.6% White alone, not Hispanic / LatinoMoved from abroad 23 0.1% White6 1.2% Black or African American7 2.7% American Indian / Alaska Native225 30.9% Asian80 5.8% Other race19 0.1% White alone, not Hispanic / Latino103 3.0% Hispanic or Latino
Children Nativity (place of birth) in Seymour
Children under 6 years - Living with two parents Both parents native 740 100.0% NativeBoth parents foreign-born 149 90.7% Native15 9.3% Foreign-bornOne native, one foreign-born parent 131 100.0% NativeChildren under 6 years - Living with one parent Native parent 506 100.0% NativeForeign-born parent 95 20.6% Native366 79.4% Foreign-bornChildren 6 to 17 years - Living with two parents Both parents native 1,643 100.0% NativeBoth parents foreign-born 278 77.6% Native80 22.4% Foreign-bornOne native, one foreign-born parent 224 100.0% NativeChildren 6 to 17 years - Living with one parent Native parent 946 100.0% NativeForeign-born parent 138 61.5% Native87 38.5% Foreign-born
Grandparents responsible for own grandchildren in Seymour
Grandparents (30 to 59 years) White / Caucasian 44 31.3% Responsible for grandchildren96 68.7% Not responsible for grandchildrenNative Hawaiian / Pacific Islander 39 100.0% Responsible for grandchildrenTwo or more races 13 100.0% Responsible for grandchildrenWhite alone, not Hispanic / Latino 45 30.8% Responsible for grandchildren101 69.2% Not responsible for grandchildrenGrandparents (60 years and over) White / Caucasian 89 39.2% Responsible for grandchildren138 60.8% Not responsible for grandchildrenWhite alone, not Hispanic / Latino 90 39.1% Responsible for grandchildren140 60.9% Not responsible for grandchildren