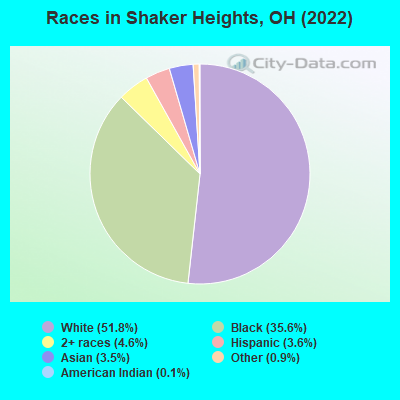
Races in Shaker Heights, Ohio (OH) Detailed Stats
Data:
Races - White alone (%)
Races - White alone (% change since 2000)
Races - Black alone (%)
Races - Black alone (% change since 2000)
Races - American Indian alone (%)
Races - American Indian alone (% change since 2000)
Races - Asian alone (%)
Races - Asian alone (% change since 2000)
Races - Hispanic (%)
Races - Hispanic (% change since 2000)
Races - Native Hawaiian and Other Pacific Islander alone (%)
Races - Native Hawaiian and Other Pacific Islander alone (% change since 2000)
Races - Two or more races(%)
Races - Two or more races(% change since 2000)
Races - Other race alone (%)
Races - Other race alone (% change since 2000)
Racial diversity
Place of birth - Born in state of residence (%)
Place of birth - Born in state of residence (%) - White
Place of birth - Born in state of residence (%) - Black or African American
Place of birth - Born in state of residence (%) - Asian
Place of birth - Born in state of residence (%) - Hispanic or Latino
Place of birth - Born in state of residence (%) - American Indian and Alaska Native
Place of birth - Born in state of residence (%) - Multirace
Place of birth - Born in state of residence (%) - Other Race
Place of birth - Born in other state (%)
Place of birth - Born in other state (%) - White
Place of birth - Born in other state (%) - Black or African American
Place of birth - Born in other state (%) - Asian
Place of birth - Born in other state (%) - Hispanic or Latino
Place of birth - Born in other state (%) - American Indian and Alaska Native
Place of birth - Born in other state (%) - Multirace
Place of birth - Born in other state (%) - Other Race
Place of birth - Native, outside of US (%)
Place of birth - Native, outside of US (%) - White
Place of birth - Native, outside of US (%) - Black or African American
Place of birth - Native, outside of US (%) - Asian
Place of birth - Native, outside of US (%) - Hispanic or Latino
Place of birth - Native, outside of US (%) - American Indian and Alaska Native
Place of birth - Native, outside of US (%) - Multirace
Place of birth - Native, outside of US (%) - Other Race
Place of birth - Foreign born (%)
Place of birth - Foreign born (%) - White
Place of birth - Foreign born (%) - Black or African American
Place of birth - Foreign born (%) - Asian
Place of birth - Foreign born (%) - Hispanic or Latino
Place of birth - Foreign born (%) - American Indian and Alaska Native
Place of birth - Foreign born (%) - Multirace
Place of birth - Foreign born (%) - Other Race
Residents speaking English at home (%)
Residents speaking English at home - Born in the United States (%)
Residents speaking English at home - Native, born elsewhere (%)
Residents speaking English at home - Foreign born (%)
Residents speaking Spanish at home (%)
Residents speaking Spanish at home - Born in the United States (%)
Residents speaking Spanish at home - Native, born elsewhere (%)
Residents speaking Spanish at home - Foreign born (%)
Residents speaking other language at home (%)
Residents speaking other language at home - Born in the United States (%)
Residents speaking other language at home - Native, born elsewhere (%)
Residents speaking other language at home - Foreign born (%)
Marital status - Never married (%)
Marital status - Now married (%)
Marital status - Separated (%)
Marital status - Widowed (%)
Marital status - Divorced (%)
Ancestries Reported - Arab (%)
Ancestries Reported - Czech (%)
Ancestries Reported - Danish (%)
Ancestries Reported - Dutch (%)
Ancestries Reported - English (%)
Ancestries Reported - French (%)
Ancestries Reported - French Canadian (%)
Ancestries Reported - German (%)
Ancestries Reported - Greek (%)
Ancestries Reported - Hungarian (%)
Ancestries Reported - Irish (%)
Ancestries Reported - Italian (%)
Ancestries Reported - Lithuanian (%)
Ancestries Reported - Norwegian (%)
Ancestries Reported - Polish (%)
Ancestries Reported - Portuguese (%)
Ancestries Reported - Russian (%)
Ancestries Reported - Scotch-Irish (%)
Ancestries Reported - Scottish (%)
Ancestries Reported - Slovak (%)
Ancestries Reported - Subsaharan African (%)
Ancestries Reported - Swedish (%)
Ancestries Reported - Swiss (%)
Ancestries Reported - Ukrainian (%)
Ancestries Reported - United States (%)
Ancestries Reported - Welsh (%)
Ancestries Reported - West Indian (%)
Ancestries Reported - Other (%)
Geographical mobility - Same house 1 year ago (%)
Geographical mobility - Same house 1 year ago (%) - White
Geographical mobility - Same house 1 year ago (%) - Black or African American
Geographical mobility - Same house 1 year ago (%) - Asian
Geographical mobility - Same house 1 year ago (%) - Hispanic or Latino
Geographical mobility - Same house 1 year ago (%) - American Indian and Alaska Native
Geographical mobility - Same house 1 year ago (%) - Multirace
Geographical mobility - Same house 1 year ago (%) - Other Race
Geographical mobility - Moved within same county (%)
Geographical mobility - Moved within same county (%) - White
Geographical mobility - Moved within same county (%) - Black or African American
Geographical mobility - Moved within same county (%) - Asian
Geographical mobility - Moved within same county (%) - Hispanic or Latino
Geographical mobility - Moved within same county (%) - American Indian and Alaska Native
Geographical mobility - Moved within same county (%) - Multirace
Geographical mobility - Moved within same county (%) - Other Race
Geographical mobility - Moved from different county within same state (%)
Geographical mobility - Moved from different county within same state (%) - White
Geographical mobility - Moved from different county within same state (%) - Black or African American
Geographical mobility - Moved from different county within same state (%) - Asian
Geographical mobility - Moved from different county within same state (%) - Hispanic or Latino
Geographical mobility - Moved from different county within same state (%) - American Indian and Alaska Native
Geographical mobility - Moved from different county within same state (%) - Multirace
Geographical mobility - Moved from different county within same state (%) - Other Race
Geographical mobility - Moved from different state (%)
Geographical mobility - Moved from different state (%) - White
Geographical mobility - Moved from different state (%) - Black or African American
Geographical mobility - Moved from different state (%) - Asian
Geographical mobility - Moved from different state (%) - Hispanic or Latino
Geographical mobility - Moved from different state (%) - American Indian and Alaska Native
Geographical mobility - Moved from different state (%) - Multirace
Geographical mobility - Moved from different state (%) - Other Race
Geographical mobility - Moved from abroad (%)
Geographical mobility - Moved from abroad (%) - White
Geographical mobility - Moved from abroad (%) - Black or African American
Geographical mobility - Moved from abroad (%) - Asian
Geographical mobility - Moved from abroad (%) - Hispanic or Latino
Geographical mobility - Moved from abroad (%) - American Indian and Alaska Native
Geographical mobility - Moved from abroad (%) - Multirace
Geographical mobility - Moved from abroad (%) - Other Race
Place of birth for the foreign-born population - Ireland (%)
Place of birth for the foreign-born population - Denmark (%)
Place of birth for the foreign-born population - Norway (%)
Place of birth for the foreign-born population - Sweden (%)
Place of birth for the foreign-born population - United Kingdom (%)
Place of birth for the foreign-born population - England (%)
Place of birth for the foreign-born population - Scotland (%)
Place of birth for the foreign-born population - Other Northern Europe (%)
Place of birth for the foreign-born population - Austria (%)
Place of birth for the foreign-born population - Belgium (%)
Place of birth for the foreign-born population - France (%)
Place of birth for the foreign-born population - Germany (%)
Place of birth for the foreign-born population - Netherlands (%)
Place of birth for the foreign-born population - Switzerland (%)
Place of birth for the foreign-born population - Other Western Europe (%)
Place of birth for the foreign-born population - Greece (%)
Place of birth for the foreign-born population - Italy (%)
Place of birth for the foreign-born population - Portugal (%)
Place of birth for the foreign-born population - Spain (%)
Place of birth for the foreign-born population - Other Southern Europe (%)
Place of birth for the foreign-born population - Albania (%)
Place of birth for the foreign-born population - Belarus (%)
Place of birth for the foreign-born population - Bosnia and Herzegovina (%)
Place of birth for the foreign-born population - Bulgaria (%)
Place of birth for the foreign-born population - Croatia (%)
Place of birth for the foreign-born population - Czechoslovakia (%)
Place of birth for the foreign-born population - Hungary (%)
Place of birth for the foreign-born population - Latvia (%)
Place of birth for the foreign-born population - Lithuania (%)
Place of birth for the foreign-born population - North Macedonia (Macedonia) (%)
Place of birth for the foreign-born population - Moldova (%)
Place of birth for the foreign-born population - Poland (%)
Place of birth for the foreign-born population - Romania (%)
Place of birth for the foreign-born population - Russia (%)
Place of birth for the foreign-born population - Serbia (%)
Place of birth for the foreign-born population - Ukraine (%)
Place of birth for the foreign-born population - Other Eastern Europe (%)
Place of birth for the foreign-born population - China (%)
Place of birth for the foreign-born population - Hong Kong (%)
Place of birth for the foreign-born population - Taiwan (%)
Place of birth for the foreign-born population - Japan (%)
Place of birth for the foreign-born population - Korea (%)
Place of birth for the foreign-born population - Other Eastern Asia (%)
Place of birth for the foreign-born population - Afghanistan (%)
Place of birth for the foreign-born population - Bangladesh (%)
Place of birth for the foreign-born population - India (%)
Place of birth for the foreign-born population - Iran (%)
Place of birth for the foreign-born population - Kazakhstan (%)
Place of birth for the foreign-born population - Nepal (%)
Place of birth for the foreign-born population - Pakistan (%)
Place of birth for the foreign-born population - Sri Lanka (%)
Place of birth for the foreign-born population - Uzbekistan (%)
Place of birth for the foreign-born population - Other South Central Asia (%)
Place of birth for the foreign-born population - Burma (%)
Place of birth for the foreign-born population - Cambodia (%)
Place of birth for the foreign-born population - Indonesia (%)
Place of birth for the foreign-born population - Laos (%)
Place of birth for the foreign-born population - Malaysia (%)
Place of birth for the foreign-born population - Philippines (%)
Place of birth for the foreign-born population - Singapore (%)
Place of birth for the foreign-born population - Thailand (%)
Place of birth for the foreign-born population - Vietnam (%)
Place of birth for the foreign-born population - Other South Eastern Asia (%)
Place of birth for the foreign-born population - Armenia (%)
Place of birth for the foreign-born population - Iraq (%)
Place of birth for the foreign-born population - Israel (%)
Place of birth for the foreign-born population - Jordan (%)
Place of birth for the foreign-born population - Kuwait (%)
Place of birth for the foreign-born population - Lebanon (%)
Place of birth for the foreign-born population - Saudi Arabia (%)
Place of birth for the foreign-born population - Syria (%)
Place of birth for the foreign-born population - Turkey (%)
Place of birth for the foreign-born population - Yemen (%)
Place of birth for the foreign-born population - Other Western Asia (%)
Place of birth for the foreign-born population - Eritrea (%)
Place of birth for the foreign-born population - Ethiopia (%)
Place of birth for the foreign-born population - Kenya (%)
Place of birth for the foreign-born population - Somalia (%)
Place of birth for the foreign-born population - Uganda (%)
Place of birth for the foreign-born population - Zimbabwe (%)
Place of birth for the foreign-born population - Other Eastern Africa (%)
Place of birth for the foreign-born population - Cameroon (%)
Place of birth for the foreign-born population - Congo (%)
Place of birth for the foreign-born population - Democratic Republic of Congo (Zaire) (%)
Place of birth for the foreign-born population - Other Middle Africa (%)
Place of birth for the foreign-born population - Egypt (%)
Place of birth for the foreign-born population - Morocco (%)
Place of birth for the foreign-born population - Sudan (%)
Place of birth for the foreign-born population - Other Northern Africa (%)
Place of birth for the foreign-born population - South Africa (%)
Place of birth for the foreign-born population - Other Southern Africa (%)
Place of birth for the foreign-born population - Cabo Verde (%)
Place of birth for the foreign-born population - Ghana (%)
Place of birth for the foreign-born population - Liberia (%)
Place of birth for the foreign-born population - Nigeria (%)
Place of birth for the foreign-born population - Senegal (%)
Place of birth for the foreign-born population - Sierra Leone (%)
Place of birth for the foreign-born population - Other Western Africa (%)
Place of birth for the foreign-born population - Australia (%)
Place of birth for the foreign-born population - New Zealand (%)
Place of birth for the foreign-born population - Fiji (%)
Place of birth for the foreign-born population - Micronesia (%)
Place of birth for the foreign-born population - Bahamas (%)
Place of birth for the foreign-born population - Barbados (%)
Place of birth for the foreign-born population - Cuba (%)
Place of birth for the foreign-born population - Dominica (%)
Place of birth for the foreign-born population - Dominican Republic (%)
Place of birth for the foreign-born population - Grenada (%)
Place of birth for the foreign-born population - Haiti (%)
Place of birth for the foreign-born population - Jamaica (%)
Place of birth for the foreign-born population - St. Vincent and the Grenadines (%)
Place of birth for the foreign-born population - Trinidad and Tobago (%)
Place of birth for the foreign-born population - West Indies (%)
Place of birth for the foreign-born population - Other Caribbean (%)
Place of birth for the foreign-born population - Belize (%)
Place of birth for the foreign-born population - Costa Rica (%)
Place of birth for the foreign-born population - El Salvador (%)
Place of birth for the foreign-born population - Guatemala (%)
Place of birth for the foreign-born population - Honduras (%)
Place of birth for the foreign-born population - Mexico (%)
Place of birth for the foreign-born population - Nicaragua (%)
Place of birth for the foreign-born population - Panama (%)
Place of birth for the foreign-born population - Other Central America (%)
Place of birth for the foreign-born population - Argentina (%)
Place of birth for the foreign-born population - Bolivia (%)
Place of birth for the foreign-born population - Brazil (%)
Place of birth for the foreign-born population - Chile (%)
Place of birth for the foreign-born population - Colombia (%)
Place of birth for the foreign-born population - Ecuador (%)
Place of birth for the foreign-born population - Guyana (%)
Place of birth for the foreign-born population - Peru (%)
Place of birth for the foreign-born population - Uruguay (%)
Place of birth for the foreign-born population - Venezuela (%)
Place of birth for the foreign-born population - Other South America (%)
Place of birth for the foreign-born population - Canada (%)
Place of birth for the foreign-born population - Other Northern America (%)
Place of birth for the foreign-born population - Other (%)
According to 2022 data, the most numerous races in Shaker Heights, OH are White alone (14,842 residents), Black alone (10,196 residents), and Two or more races (1,328 residents). 89.1% of Shaker Heights residents speak English at home. 8.6% of Shaker Heights, OH residents are foreign-born (2.9% born in Asia, 2.1% born in Europe, 1.7% born in Latin America, 1.1% born in Africa), which is 53.3% greater than the foreign-born rate of 4.0% across the entire state of Ohio.
Race distribution in Shaker Heights
2000 2022
9,538,111 84.0% White alone 1,290,662 11.4% Black alone 217,123 1.9% Hispanic 137,770 1.2% Two or more races 131,670 1.2% Asian alone 21,985 0.2% American Indian alone 13,483 0.1% Other race alone 2,336 0.02% Native Hawaiian and Other
8,948,793 76.1% White alone 1,401,403 11.9% Black alone 529,291 4.5% Two or more races 517,232 4.4% Hispanic 293,387 2.5% Asian alone 52,805 0.4% Other race alone 9,785 0.08% American Indian alone 3,362 0.03% Native Hawaiian and Other
Income and house value in Shaker Heights Median household income in 2022 $153,315 White non-Hispanic householders$59,219 Black householders$82,543 Asian householders$122,148 Some other race householders$70,802 Two or more races householders$95,594 Hispanic or Latino race householdersMedian 2022 house value $396,643 White Non-Hispanic householders$218,453 Black or African American householders $322,439 Asian householders$374,348 Some other race householders$266,869 Two or more races householders$241,746 Hispanic or Latino householders
Median age by race in Shaker Heights
42.5 Median age for White residents42.7 42.3 43.2 Median age for Black or African American residents39.1 46.3 39.4 Median age for American Indian / Alaska Native residents-734,374,999.3 39.2 34.8 Median age for Asian residents35.2 39.3 -706,093,189.3 Median age for Native Hawaiian / Pacific Islander residents-750,242,953.6 -805,394,989.6 33.2 Median age for Other race residents48.0 24.2 28.7 Median age for Two or more races residents19.9 29.8 43.0 Median age for White alone residents43.3 42.8 31.8 Median age for Hispanic or Latino residents19.8 31.7
Owner/renter occupied households by race in Shaker Heights
House owners and renters - White residents 4,945 72.6% Owner occupied1,871 27.4% Renter occupiedHouse owners and renters - Black or African American residents 2,148 44.1% Owner occupied2,722 55.9% Renter occupiedHouse owners and renters - American Indian / Alaska Native residents 10 50.4% Owner occupied10 49.6% Renter occupiedHouse owners and renters - Asian residents 224 56.3% Owner occupied174 43.7% Renter occupiedHouse owners and renters - Other race residents 194 89.2% Owner occupied23 10.8% Renter occupiedHouse owners and renters - Two or more races residents 370 64.3% Owner occupied206 35.7% Renter occupiedHouse owners and renters - White alone residents 4,954 74.2% Owner occupied1,719 25.8% Renter occupiedHouse owners and renters - Hispanic or Latino residents 107 31.5% Owner occupied233 68.5% Renter occupied
Language usage in Shaker Heights
English speakers - Total 89.1% of residents of Shaker Heights speak English at home.
4.1% of residents speak Spanish at home 682 62.2% Speak English very well414 37.8% Speak English less than very well6.8% of residents speak other language at home 1,396 76.0% Speak English very well441 24.0% Speak English less than very well
English speakers - Born in the United States 95.1% of residents of Shaker Heights speak English at home.
1.5% of residents speak Spanish at home 112 83.6% Speak English very well22 16.4% Speak English less than very well3.3% of residents speak other language at home 235 79.9% Speak English very well59 20.1% Speak English less than very well
English speakers - Native, born elsewhere 81.7% of residents of Shaker Heights speak English at home.
7.9% of residents speak Spanish at home 2 15.4% Speak English very well11 84.6% Speak English less than very well9.1% of residents speak other language at home 15 100.0% Speak English very well
English speakers - Foreign-born 29.3% of residents of Shaker Heights speak English at home.
14.7% of residents speak Spanish at home 168 52.0% Speak English very well155 48.0% Speak English less than very well55.8% of residents speak other language at home 920 75.3% Speak English very well302 24.7% Speak English less than very well
White (Caucasian) - Speak only English Native:
97.4% (12,702)Foreign-born:
32.5% (310)
White (Caucasian) - Speak another language Native:
2.8% (371)Foreign-born:
67.8% (647)
Black or African American - Speak only English Native:
95.7% (9,122)Foreign-born:
27.0% (80)
Black or African American - Speak another language Native:
3.4% (324)Foreign-born:
67.2% (200)
Asian - Speak only English Native:
53.4% (193)Foreign-born:
19.0% (110)
Asian - Speak another language Native:
45.9% (166)Foreign-born:
81.1% (467)
Other race - Speak only English Native:
41.0% (160)Foreign-born:
56.7% (107)
Other race - Speak another language Native:
57.0% (223)Foreign-born:
52.3% (99)
Two or more races - Speak only English Native:
84.5% (1,146)Foreign-born:
32.7% (58)
Two or more races - Speak another language Native:
13.9% (189)Foreign-born:
66.2% (117)
White alone - Speak only English Native:
96.8% (12,574)Foreign-born:
36.6% (315)
White alone - Speak another language Native:
3.1% (406)Foreign-born:
63.3% (545)
Hispanic or Latino - Speak another language Native:
41.7% (255)Foreign-born:
100.0% (292)
Foreign-born residents in Shaker Heights 2,455 residents are foreign born (2.9% Asia , 2.1% Europe , 1.7% Latin America , 1.1% Africa ).
Marital status for residents in Shaker Heights Marital status - White (Caucasian) population 15 years and over
Males 25.5% Never married65.3% Now married0.6% Separated3.3% Widowed5.3% DivorcedFemales 22.5% Never married59.7% Now married0.3% Separated7.6% Widowed9.9% DivorcedWomen who gave birth in the past 12 months Now married:
100.0% (175)Unmarried:
0.0% (0)
Women who did not give birth in the past 12 months Now married:
56.2% (1,575)Unmarried:
43.8% (1,226)
Marital status - Black or African American population 15 years and over
Males 43.3% Never married34.3% Now married0.7% Separated6.0% Widowed15.7% DivorcedFemales 45.8% Never married22.2% Now married2.4% Separated10.0% Widowed19.6% DivorcedWomen who gave birth in the past 12 months Now married:
65.3% (48)Unmarried:
34.7% (26)
Women who did not give birth in the past 12 months Now married:
20.2% (560)Unmarried:
79.8% (2,214)
Marital status - American Indian / Alaska Native population 15 years and over
Males 100.0% Never married0.0% Now married0.0% Separated0.0% Widowed0.0% DivorcedFemales 47.6% Never married14.3% Now married0.0% Separated38.1% Widowed0.0% DivorcedWomen who did not give birth in the past 12 months Now married:
0.0% (0)Unmarried:
100.0% (12)
Marital status - Asian population 15 years and over
Males 26.5% Never married67.1% Now married1.4% Separated1.4% Widowed3.6% DivorcedFemales 40.8% Never married55.7% Now married0.0% Separated0.0% Widowed3.5% DivorcedWomen who gave birth in the past 12 months Now married:
100.0% (46)Unmarried:
0.0% (0)
Women who did not give birth in the past 12 months Now married:
41.1% (116)Unmarried:
58.9% (166)
Marital status - Other race population 15 years and over
Males 30.8% Never married63.6% Now married5.6% Separated0.0% Widowed0.0% DivorcedFemales 47.6% Never married40.7% Now married11.7% Separated0.0% Widowed0.0% DivorcedWomen who did not give birth in the past 12 months Now married:
38.5% (92)Unmarried:
61.5% (148)
Marital status - Two or more races population 15 years and over
Males 49.9% Never married44.2% Now married0.0% Separated0.0% Widowed5.9% DivorcedFemales 52.9% Never married20.4% Now married0.0% Separated1.3% Widowed25.4% DivorcedWomen who did not give birth in the past 12 months Now married:
14.7% (64)Unmarried:
85.3% (372)
Marital status - White alone, not Hispanic / Latino population 15 years and over
Males 26.0% Never married64.6% Now married0.6% Separated3.3% Widowed5.4% DivorcedFemales 21.5% Never married60.6% Now married0.3% Separated7.3% Widowed10.2% DivorcedWomen who gave birth in the past 12 months Now married:
100.0% (150)Unmarried:
0.0% (0)
Women who did not give birth in the past 12 months Now married:
58.1% (1,601)Unmarried:
41.9% (1,155)
Marital status - Hispanic or Latino population 15 years and over
Males 23.6% Never married76.4% Now married0.0% Separated0.0% Widowed0.0% DivorcedFemales 49.4% Never married37.6% Now married5.8% Separated7.3% Widowed0.0% DivorcedWomen who gave birth in the past 12 months Now married:
100.0% (31)Unmarried:
0.0% (0)
Women who did not give birth in the past 12 months Now married:
31.6% (105)Unmarried:
68.4% (228)
Ancestries in Shaker Heights
732 5.0% American671 4.6% European617 4.2% German473 3.2% Polish459 3.1% English372 2.5% Irish286 2.0% Eastern European257 1.8% Italian172 1.2% Hungarian167 1.1% Swedish139 1.0% African130 0.9% Russian85 0.6% British81 0.6% Romanian79 0.5% Dutch76 0.5% Scottish62 0.4% Northern European56 0.4% French49 0.3% Jamaican48 0.3% French Canadian44 0.3% Slovene43 0.3% Greek42 0.3% Czech42 0.3% Bulgarian34 0.2% Slovak32 0.2% Welsh31 0.2% Iranian27 0.2% Lithuanian23 0.2% Lebanese21 0.1% Scotch-Irish20 0.1% Croatian19 0.1% Liberian19 0.1% Swiss16 0.1% Albanian15 0.1% Estonian15 0.1% Pennsylvania German13 0.09% Belgian13 0.09% Ukrainian12 0.08% Nigerian11 0.08% Austrian10 0.07% Cape Verdean10 0.07% Armenian10 0.07% Iraqi8 0.05% Serbian6 0.04% Cajun6 0.04% Norwegian4 0.03% Moroccan2 0.01% Finnish
Geographical mobility in Shaker Heights Same house 1 year ago 12,960 86.6% White (Caucasian)8,615 84.8% Black or African American28 74.4% American Indian / Alaska Native790 83.4% Asian524 84.2% Other race1,378 83.0% Two or more races12,896 87.7% White alone, not Hispanic / Latino709 68.4% Hispanic or LatinoMoved within same county 636 4.2% White / Caucasian1,066 10.5% Black or African American3 7.7% American Indian / Alaska Native124 13.1% Asian15 2.4% Other race60 3.6% Two or more races577 3.9% White alone, not Hispanic / Latino116 11.2% Hispanic or LatinoMoved within same state 399 2.7% White / Caucasian160 1.6% Black or African American4 12.0% American Indian / Alaska Native25 2.7% Asian43 2.6% Two or more races402 2.7% White alone, not Hispanic / LatinoMoved from different state 884 5.9% White / Caucasian353 3.5% Black or African American12 1.3% Asian220 13.3% Two or more races919 6.3% White alone, not Hispanic / Latino26 2.5% Hispanic or LatinoMoved from abroad 167 1.1% White63 10.1% Other race40 2.4% Two or more races55 0.4% White alone, not Hispanic / Latino160 15.5% Hispanic or Latino
Children Nativity (place of birth) in Shaker Heights
Children under 6 years - Living with two parents Both parents native 1,481 100.0% NativeBoth parents foreign-born 202 55.6% Native161 44.4% Foreign-bornOne native, one foreign-born parent 143 100.0% NativeChildren under 6 years - Living with one parent Native parent 119 99.2% Native1 0.8% Foreign-bornForeign-born parent 38 63.7% Native22 36.3% Foreign-bornChildren 6 to 17 years - Living with two parents Both parents native 2,141 99.4% Native13 0.6% Foreign-bornBoth parents foreign-born 201 82.2% Native44 17.8% Foreign-bornOne native, one foreign-born parent 312 100.0% NativeChildren 6 to 17 years - Living with one parent Native parent 1,255 98.0% Native25 2.0% Foreign-bornForeign-born parent 127 69.6% Native56 30.4% Foreign-born
Grandparents responsible for own grandchildren in Shaker Heights
Grandparents (30 to 59 years) White / Caucasian 11 100.0% Responsible for grandchildrenBlack or African American 15 88.4% Responsible for grandchildren2 11.6% Not responsible for grandchildrenTwo or more races 86 100.0% Responsible for grandchildrenWhite alone, not Hispanic / Latino 12 100.0% Responsible for grandchildrenGrandparents (60 years and over) White / Caucasian 43 39.0% Responsible for grandchildren67 61.0% Not responsible for grandchildrenBlack or African American 9 18.2% Responsible for grandchildren42 81.8% Not responsible for grandchildrenTwo or more races 8 100.0% Responsible for grandchildrenWhite alone, not Hispanic / Latino 44 38.5% Responsible for grandchildren70 61.5% Not responsible for grandchildren