Races in Shaler Township, Pennsylvania (PA) Detailed Stats
Ancestries, Foreign-born residents, place of birth

Recent posts about races in Shaler Township, Pennsylvania on our local forum with over 2,400,000 registered users:
 | Gentrification in Pittsburgh (192 replies) |
| Local County Seat Foodie Day-Trip Suggestions? (27 replies) |
| Suburb of the week: Etna (42 replies) |
| The Rent's Just Too Damn High! (403 replies) |
| The East End Real Estate Bubble (81 replies) |
| Why do Pittsburghers Wear Pajamas To The Grocery Store? (129 replies) |
2.5% of Shaler Township, PA residents are foreign-born (1.1% born in Europe, 0.8% born in Asia, 0.3% born in Latin America), which is 177.7% less than the foreign-born rate of 7.0% across the entire state of Pennsylvania.
Race distribution in Shaler Township

- 29,01797.5%White alone
- 2680.9%Asian alone
- 1550.5%Hispanic
- 1550.5%Two or more races
- 1210.4%Black alone
- 180.06%American Indian alone
- 160.05%Other race alone
- 70.02%Native Hawaiian and Other
Pacific Islander alone
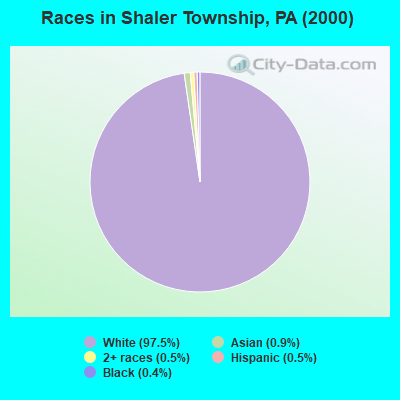
2000
2022
-
- 10,322,45584.1%White alone
- 1,202,4379.8%Black alone
- 394,0883.2%Hispanic
- 218,2961.8%Asian alone
- 113,0970.9%Two or more races
- 13,0860.1%Other race alone
- 14,9040.1%American Indian alone
- 2,6910.02%Native Hawaiian and Other
Pacific Islander alone

-
- 9,487,22873.1%White alone
- 1,311,58110.1%Black alone
- 1,115,9978.6%Hispanic
- 493,9423.8%Two or more races
- 487,1243.8%Asian alone
- 63,5820.5%Other race alone
- 10,1300.08%American Indian alone
- 2,4240.02%Native Hawaiian and Other
Pacific Islander alone

Income and house value in Shaler Township
- Median household income in 2022
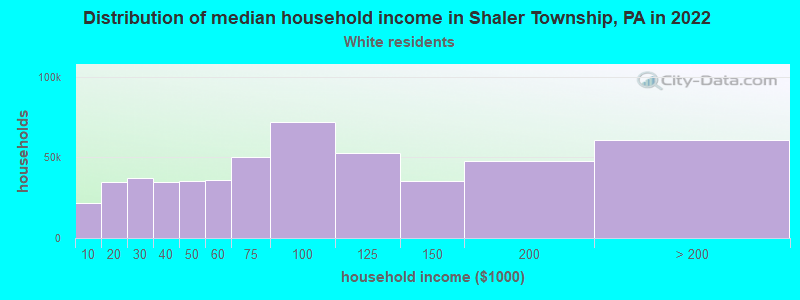
- $93,153White non-Hispanic householders
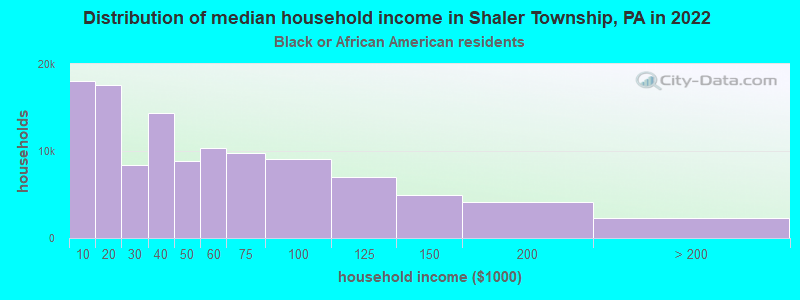
- $75,185Black householders
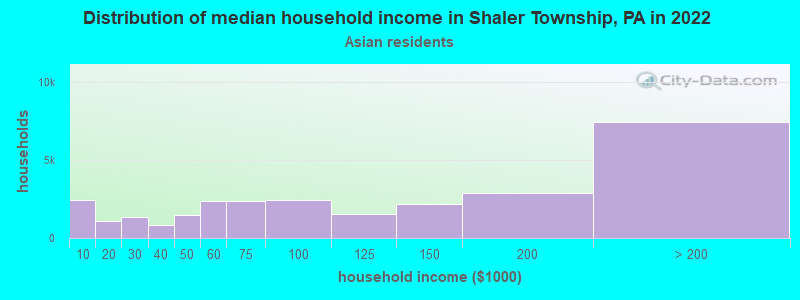
- $145,686Asian householders
- $77,241Some other race householders
- $161,616Two or more races householders
- $148,887Hispanic or Latino race householders
- Median 2022 house value
- $266,040White Non-Hispanic householders
- $150,543Black or African American householders
- $433,841Asian householders
- $231,258Two or more races householders
- $346,754Hispanic or Latino householders
Household income for White non-Hispanic householders
Household income for Black householders
Household income for Asian householders
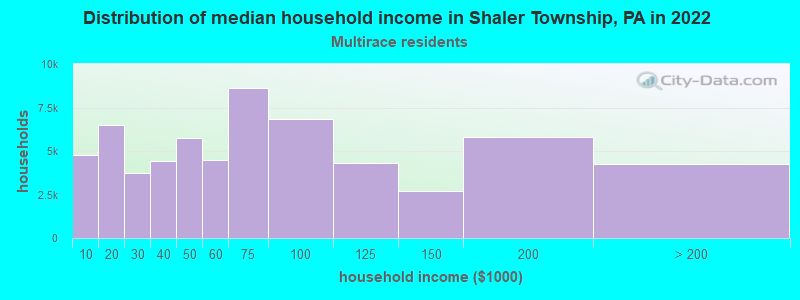
Household income for Two or more races householders
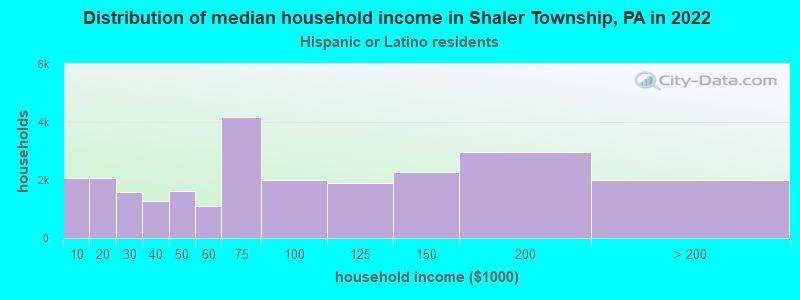
Household income for Hispanic or Latino race householders
Foreign-born residents in Shaler Township
750 residents are foreign born (1.1% Europe, 0.8% Asia, 0.3% Latin America).
| This city: | 2.5% |
| Pennsylvania: | 4.1% |
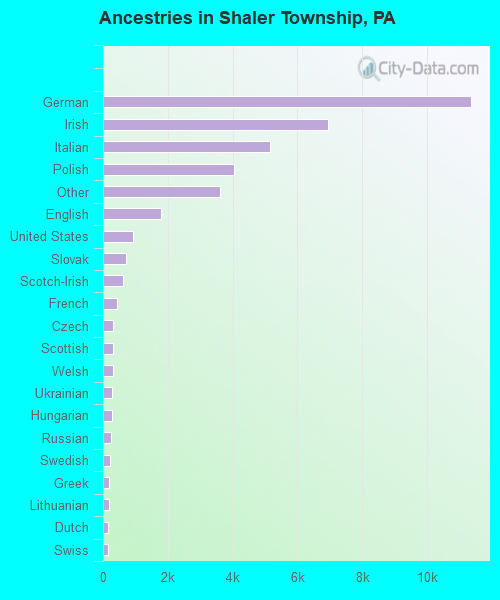
Ancestries in Shaler Township

- 11,34829.5%German
- 6,93718.1%Irish
- 5,16913.5%Italian
- 4,05910.6%Polish
- 3,6189.4%Other
- 1,7984.7%English
- 9182.4%United States
- 7111.9%Slovak
- 6121.6%Scotch-Irish
- 4171.1%French
- 3240.8%Czech
- 3200.8%Scottish
- 2940.8%Welsh
- 2880.7%Ukrainian
- 2740.7%Hungarian
- 2510.7%Russian
- 2110.5%Swedish
- 1910.5%Greek
- 1900.5%Lithuanian
- 1570.4%Dutch
- 1470.4%Swiss
- 830.2%Arab
- 400.1%French Canadian
- 280.07%Norwegian
- 140.04%Subsaharan African
- 100.03%Portuguese
- 60.02%West Indian
- 50.01%Danish
Zip codes: 15209.